
Mastering options calculations is an essential skill needed to attain the very highest covered call writing returns. Although the Ellman Calculator will do most of the heavy lifting for us, understanding the reasons behind these calculations and when and how to apply them, will make us all more skilled investors.
Recently a BCI member sent me a hypothetical trade that involved two of our exit strategy choices: rolling down and the mid-contract unwind exit strategy. Let me first define:
Rolling down: Closing out options at one strike and simultaneously opening another at a lower strike price.
Mid-contract unwind exit strategy (MCU): Closing an entire covered call position mid-contract when the time value of the premium approaches zero and using the cash to establish a second income stream in the same month with a new position.
The hypothetical trade
- Buy shares @ $74.
- STO $74 calls (ATM) @$2.50.
- Buyback $74C’s @0.50.
- Rolldown to $70 strike C’s @$2.
- Price rockets way up to $78.
- Buyback $70C’s @ $8.20
The questions
– Now what I want to know is that if I am correct here in knowing that the intrinsic value of the last option (#6) is $8, and T.V is at $0.20(for the $8.20 option), then am I to also take the MCU share gain as $8?(from $70 to $78)
– It can’t surely be from $75 up to $78 can it, as time value would be too large? (or am I wrong?)
– Is my calculation correct for a -$4.20 total options loss, and +$8 for price gain to = +$3.80 profit?
Let’s take off our shoes and socks and do the math
Based on this example I see the confusion commonly experienced by covered call writers. There are 2 sets of calculations that should be viewed individually but frequently are combined and that will cloud the situation. The 1st calculation relates to whether to pull the trigger on the MCU strategy or not. The 2nd is the overall profit (loss) results. Let’s address the MCU 1st:
1- We base our decision whether to completely close our short option and long stock positions based on the current market value of our shares which was rolled down to $70. We do not base it on some value in the past ($74). The time value component to accomplish this is $0.20 because the shares can be sold for $78 and gain $8 in share value at this point in time. If we can generate more than $20/$7000 or .28% (a fraction of 1%) by re-investing that newly-acquired cash, we should pull the trigger on the MCU strategy.
2- Final results: we don’t know yet because the cash generated from instituting the MCU strategy hasn’t been re-invested so the final chapter hasn’t been written. However, to date you have an options debit of:
$2.50 + ($2.00 – $0.50) – $8.20 = (-) 4.20 (sum of all options credits and debits)
You have a share credit of $78 – $74 = + $4 (bought at $74 and sold @ $78)
Total loss to date = (-) $0.20
This tabulates to a fraction of 1% as shown in the figure below:
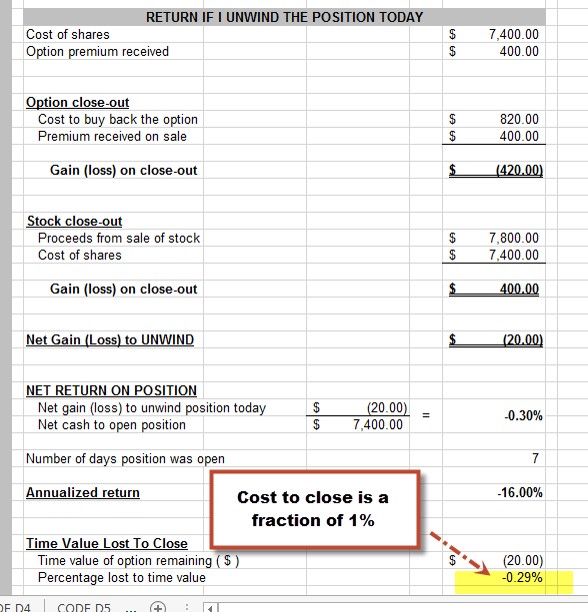
Mid-contract unwind exit strategy
Now, it’s up to us to write the final chapter that month and re-invest the $7800/contract to turn that small loss into a gain. We turn to our watch list of eligible stocks, find an appropriate price per share and check options chains. The information is fed into the Ellman Calculator as we make our final decisions.
This is a great example of how being active can, in many cases, allow us to manage our positions to mitigate losses, turn losses into gains and enhance gains.
April seminar in Arizona (Phoenix area):
Family Investment Library
New product package available in our Blue Collar store combining 2 of our best-selling books and saving $5:
https://www.thebluecollarinvestor.com/package-family-investment-library/
Market tone:
This week marked another reaffirming an improving economy but with geo-political and global economic concerns:
- 4th quarter GDP was revised upward to 2.6% from 2.4% according to the Commerce Department
- Initial jobless claims for the week ending 3-22-14 came in @ 311,000, less that the projected 325,000
- Consumer spending reached its highest level in 3 years, up 2.2%, according to the Commerce Department
- Sales of new single-family homes dropped by 3.3% in February and 1.1% lower than 1 year ago. This decline was due to rising mortgage rates and severe weather conditions
- Savings rate for February was up 4.3%
- According to the Conference Board, Consumer Confidence rose by 4 points to 82.3, higher then the expected 78.6. This is the highest level in the past 6 years
- New orders for durable goods rose by 2.2% in February after declining the previous 2 months
- Personal consumer spending rose by 0.3% in February more than the 0.2% anticipated
- Personal income rose by 0.3% in February
For the week, the S&P 500 declined by 0.5%, for a year-to-date return of 1%, including dividends.
Summary:
IBD: Market in correction
BCI: This site continues to be bullish on the economy. It’s difficult to ignore years of improving economic reports. However, because global political and economic concerns we remain slightly bearish in our current holdings, favoring in-the-money strikes 3-to-2.
My best to all,
Alan ([email protected])


Alan,
I was reviewing your conservative in-the-money strike strategy and wondering whether the following strategy might ALWAYS give a profit for every stock and market situation with no chance of ever losing money?
Buy BCI deep ITM strike with a 2% premium and downside protection.
Over the contract period – if the share price of BCI goes upward, sits tight, or drops by less than the downside protection – don’t do anything.
As soon as BCI drops mid-contract to lower than the strike price, buy back the option and sell the stock immediately (hopefully doing both before BCI drops below the breakeven price)?
ie you make 2% or nothing on the trade.
Also, if this IS a 100% never-lose flowchart, is there a broker that might automate the entire process for us so we don’t need to check share price every day ?
Tony (from Wagga)
Tony,
I admire your effort to use the BCI methodology to locate that perfect strategy. Thinking outside the box is what makes us all better investors.
One thing I’ve learned over the years is that there is no free lunch and no strategy that returns greater than the risk-free returns (treasuries) that is 100% guaranteed.
Here are a few factors to consider:
1- A stock price can gap-down and even if we wanted to sell @ the strike, there is no guarantee we will get our price.
2- To generate time value of 2%, the strike certainly can be ITM but not DEEP ITM unless the stock has huge implied volatility…so the strike will be below current market value but not out of sight.
3- In our books/DVDs we review the time value of different strike prices and ATM strikes offer the greatest time value and will therefore cost the most when buying back the option…so there will be an option DEBIT in this hypothetical strategy. In other words, the time value generated from the sale of the option (ITM) will be less than the time value it will cost us to buy back the option (ATM) before selling the stock mid-contract.
4- There will be a small debit also from the bid-ask spread…less of a factor than “3”
Thanks for sharing your ideas and I encourage you to continue to do so as i do every day so we can share with the BCI community and all become better investors and learn from each other.
Alan
Thanks again Alan,
Great answer..
But would my (no lose) plan work if I make slight adjustments ?
ie. Buy BCI shares at $80. I buy a ITM strike at $75.
BCI share price falls.
I acknowledge that Time Value increases as share price falls towards the strike, but Intrinsic Value of the option will decrease – meaning there might be an option CREDIT. Or am I wrong?
If I buy back the option (at a net option CREDIT) when BCI reaches $76 (80% of the way down for option with delta of 0.9) can’t I break even almost every time?
Free lunch today, or have I missed something?
If this works, then it’s like there are mathematically only 2 outcomes – make money or break-even. ie I can’t lose on any trade?
Tony
Tony,
Sorry to say but you will still have to pay for lunch although with your initiative and motivation I suspect that it will be with a discount coupon so you will pay less than most others.
Let’s say you sell the initial option for $6, $5 is intrinsic value (not profit) and $1 time value or a little more than a 1.3% initial return. Now your shares are worth $75, not $80 as we use the $5 of IV to “buy down” our cost basis.
As the share price approaches the strike mid-contract the TV will rise despite the impact of theta (time value erosion). If share price reaches the strike, there will be an options debit. If share price reaches $76 when closing you will pay the TV + $1 of IV and you will sell for $76 so IV is practically a wash.
The key is to watch time value…that’s what lunch will cost you.
A good exercise would be to look at any options chain and play out different scenarios. Below is one for FB trading @ $60.01. Look at the $55 deep ITM strike and the ATM $60 strike as it relates to TV. CLICK ON IMAGE TO ENLARGE AND USE THE BACK ARROW TO RETURN TO BLOG:
Alan
Premium Members,
The Weekly Report for 03-28-14 has been uploaded to the Premium Member website and is available for download.
Also, be sure to check out the latest BCI Training Videos and “Ask Alan” segments. You can view them at The Blue Collar YouTube Channel. For your convenience, the BCI YouTube Channel link is:
http://www.youtube.com/user/BlueCollarInvestor
Best,
Barry and The BCI Team
Alan, It is great to see a learning example of that papertrade I had asked you is shown above here. One thing though, the stock I used was actually bought at $75, and not $74, – only a small difference and I guess the calculations are pretty much the same anyway! (this will help me if it happens again too.)
Now I do want to continue from my other questions, for what actions are best depending on the look of the stock charts.
1. If at expiration my stock(s) is channelling s/ways and either above or below the 20dEMA(or both EMA’s), then is it best for me to sell shares(or allow assignment), to reduce any risk of price falling?
2. Does it depend here on if MACD,etc confirming indicators are positive or negative?
3. When buying a stock is it alright if it is channelling s/ways, or does it always have to be trending up above the EMA’s?
4. If I see a divergence on the MACD or Slow Stochastics(or both) for the S&P500, then shouldn’t this act as a warning not to buy stocks yet, – and maybe more so if these indicators are going down?
5. Also this is just a personal experience, as I was also going to do some practice trades at start of month, but because after seeing negative divergences on the S&P500 I decided to wait. It’s just as well I did as the market has pulled back a bit, so will likely now put on some practice trades.
I’m just wondering though if what I did by waiting for a market pullback is a good idea? Should I have entered(bought) and done some trades at start of cycle anyway?, have you yet?
Getting answers again to this topic will help a lot. Thanks
Adrian,
1- Technical analysis is as much an art as it is a science. I look at the mosaic presented by the 4 indicators discussed in my material and that will lead me to stock and strike selection. A sideways moving stock that has great fundamentals and meets all our “common sense” principles may be a good candidate for selling ITM strikes. Another factor I consider is how is that security performing compared to the overall market?
2- Yes, that is one of the factors but not the only one as stated above.
3- Yes, these stocks are eligible but I tend to favor ITM strikes.
4- Market timing is tough. I look at the chart of the S&P 500, the VIX and analyze the weekly economic reports to make my overall market assessment and then this will be one of the factors I use in setting up my portfolio for the month…but I stay “in the game”
5- I am almost always fully invested…2008 was a rare exception. The question is how aggressive should I set up my portfolio at that point in time. It is important to remember that if and when a trade turns against us, we have an entire arsenal of exit strategies to mitigate losses, enhance gains or turn losses into gains. Position management is critical.
Alan
Thanks for getting back to me. But for your 1st answer, how would I know if the s/ways trending stock at expiration still has great fundamentals if the premium report comes out after expiration?, wouldn’t I have to beforehand make a decision either to keep or sell the stock?, or could I look back at the previous weeks P.report to see if passed fundamentals?
(From what I know then I probably should have entered my papertrades anyway at start of this monthly cycle (instead of a week later), and then work out suitable strike prices depending on the stocks charts, market tone charts, and economic reports. And because you stated market timing as being tough, well considering that I guess there isn’t much clue knowing how much longer the market would keep falling before any reversal.)
All that helped my understanding again. Thanks
Adrian,
One tactic you might think about is to buy a protective put if you want to keep the stock through earnings. The put would only be in place for a short time, just through earnings, but would protect you in the case of a bad ER. The negative is that the put price would be higher due to the implied volatility prior to the ER and if there wasn’t any negative news, the put would lose value due to a drop in the implied volatility called”volatility crush”. But…your downside would be protected.
Best,
Barry
Adrian,
Fundamentals rarely change until the earnings report is published and we have access to the 3 major financial statements:
Balance sheet
Income statement
Statement of cash flows
Fortunately, we don’t need to read through all those accounting stats because they are part of our BCI screens so prior to an ER, fundamentals are usually still okay.
A quick check of the BCI Premium Report is a quick way to confirm.
Alan
Premium members:
This week’s 8-page report of top-performing ETFs and analysis of ALL Select Sector Components has been uploaded to your premium site. The report also lists Top-performing ETFs with Weekly options as well as the implied volatility of all eligible candidates.
For your convenience, here is the link to login to the premium site:
https://www.thebluecollarinvestor.com/member/login.php
NOT A PREMIUM MEMBER? Check out this link:
https://www.thebluecollarinvestor.com/membership.shtml
For those of you who live in the Phoenix area I hope to see you at my seminar on April 8th:
http://www.meetup.com/AZ-POINT-Group/events/172997092/?a=ea1_grp&rv=ea1&_af_eid=172997092&_af=event
Alan and the BCI team