
Understanding the Greeks, or factors that impact the value of our covered call premiums, is essential to mastering options trading basics and becoming an elite covered call writer. One of the Greeks (although not truly a Greek letter) is Vega, the amount an option price will change for every 1% change in volatility. As the anticipated or implied (implied by the option premiums) volatility of the underlying security moves higher, so does the value of the option premium if all other factors remain the same. This implied volatility is different from the historical or statistical volatility which is based on actual price fluctuation over a specific time frame.
This understanding of the impact volatility has on our option profits has led some investors to look for divergences between historical and implied volatility, specifically when implied is well above its historical statistics. The theory here is that the greater the divergence, the greater the opportunity to generate higher returns. Here is an example of such a trade made a few months ago by a friend of one of our members, Tony:
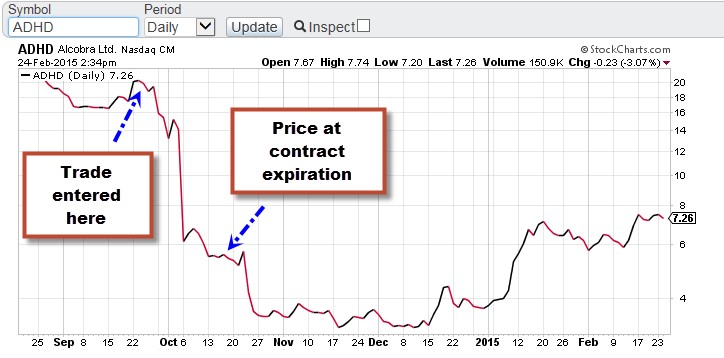
The company is Alcobra (ADHD), a pharmaceutical company known for dealing with attention deficit medical conditions.
- Buy ADHD @ $20.92
- Sell October17, 2014 $20 call @ $7.20
Let’s feed this information into the “multiple tab” of the Ellman Calculator (For a free copy, click on the “Free Resources” tab on the top black bar of this page) :

Initial returns for ADHD
The results show a HUGE return of 31.4% in less than 2 months and also downside protection of that profit of 4.4%. In other words, share value can drop by 4.4% by expiration and we still would have generated a return of 31.4%. Equally as impressive is the trade breakeven point of $13.72. Can this be the free lunch we all have been searching for?
So why are option buyers willing to pay us such a generous premium? It is so important to understand the other side of a trade in addition to looking at it from our perspective. The answer goes back to implied volatility or the market’s anticipation of future price movement of the underlying security. The option buyers are expecting substantial price movement of this security by expiration and we are being paid for undertaking this risk. To determine the implied volatility of this specific option, I turned to the options calculator found @ www.cboe.com:

Implied volatility of ADHD
On the lower right side of this screenshot we see the implied volatility of the October $20 call is a whopping 218.77%. Now I have this thing for math so please bear with me…there is a formula that we can use to determine the market’s anticipated price movement based on this implied volatility and it is based on 1 standard deviation which just means that it will be accurate 68% of the time…hang in there:
1 Standard Deviation = stock price x implied volatility x [the square root of the number of days in the trade/365]
1 SD = $20.92 x 2.18 x .39 = plus or minus $17.78
Let’s bring this down to human talk: Based on this implied volatility of 218%, the market is anticipating a price range for this stock as low as $3.14 and as high as $38.70, 68% of the time. This is why the premium is so generous but do we want to hang our hats on such a security? Covered call writing is a conservative strategy for low-risk tolerance investors who stress capital preservation.
I wonder how many of you are wondering why the market is anticipating such a monumental price change over the next 55 days. Me too. Like many pharmaceuticals, the company is involved in a drug trial with the FDA and initial results were due out in the 4th quarter, 2014. A positive report and the share price can go to the moon; a negative report and…well you get the idea.
So what happened?
ADHD after negative news
The market expectation was correct on the negative side as share price dropped from over $20 per share to under $6 per share.
Conclusion
Understanding how the Greeks (and implied volatility in particular) impact our covered call writing decisions is critical to becoming an elite options trader. Screening for stocks that show a large divergence between implied and historical volatility may be a way to eliminate covered call writing candidates and should only be embraced by those with a high risk-tolerance.
***For more information on the Greeks, see pages 156 – 166 of the Complete Encyclopedia for Covered Call Writing and pages 195 – 212 of Selling Cash-Secured Puts.
FREE Beginners Corner for Puts tutorial
Now available by clicking the link shown below:

Next live seminars: Central Florida
Market tone
-
According to the Commerce Department, GDP in the 4th quarter was revised downward from 2.6% to 2.2% on an annualized basis
-
For the year 2014, GDP came in at 2.4%, the best pace in the last 4 years
-
Existing home sales in January dropped by 4.9% to a 9-month low of 4.82 million units, but 3.2% better than a year ago
-
The supply of existing homes on the market increased to 4.7 months from the previous 4.4 months
-
The median price of homes dropped to $199,600 in January but was still 6.2% higher than a year ago
-
New-home sales dipped by 0.2% in January but better than analysts anticipated
-
Consumer confidence rose to an impressive 102.9 in January, a 7-year high and much better than economists were expecting
-
The Consumer Price Index dropped by 0.7% in January, mainly due to energy. Excluding food and energy, price were up by 0.2%
-
Durable goods orders rose by 2.8% in January, better than the 1.9% projected
Summary
IBD: Confirmed uptrend
GMI: 6/6- Buy signal since market close of January 23, 2015
BCI: Cautiously bullish using an equal number of in-the-money and out-of-the-money strikes. A bit of weakness in the housing industry is of minor concern.
Wishing you the best in investing,
Alan ([email protected])


Hi Alan,
What website do you use for generating percentage return charts like the ones in the premium ETF reports?
thanks
Dave,
We use Investools, a site that charges a monthly fee. You can also use “Perf” charts @ http://www.stockcharts.com, which is a free site.
Alan
Great explanation, as always, and wonderful example.
If it is to good to be true, it is generally too risky for me.
55 days expiration is very stressful on my nerves, and an FDA trial result is as uncertain as an earnings report, or maybe worse.
I have enough trouble handling the market fluctuations, and worrying about unpredictable corrections, to add unecessary risk to the covered call investment method.
Thanks – Roni
Excellent example and one only found in the bio-tech space, I would think. Where else could one find such a huge implied volatility? No where else that I can think. Most stocks that experience huge price moves cannot be so well anticipated (at least legally). For example, I hold covered calls on NXPI at $84.50 with a strike of $90 and expiration of March 20. The news just came out tonight (Sunday) that NXPI will buy Freescale. That should move NXPI on Monday, maybe above $100, but could not easily be anticipated ahead of time (I heard no rumors and volume was average on Friday).
In any case, I will avoid any call options with a 30 day return of 30%. “Too good to be true”
A few people have been asking about screening for options. I have a technique that has been working. I take the list of tickers BCI provides each week (the last page of the premium newsletter) and I enter it into the FinViz.com stock screener (right hand side of page). I select Charts option (middle of page) Then I select the “Order” and pick Volatility by Month in Descending order. This will provide a list of the top stocks BCI selects with highest implied volatility first. Plus you get a quick glance at the technical picture of the stocks which I find helpful (if breaking down, I move on).
I also will be using Options Express (optionsexpress.com) which has a screener for options that lets you screen by volatility, yield and all kinds of other options / Greek parameters. But I prefer starting with the pre-selection work done by BCI. It is a very good list of stocks. Alan’s stock selection methodology is very good by my own personal experience.
Premium Members:
This week’s Weekly Stock Screen And Watch List has been uploaded to The Blue Collar Investor premium member site and is available for download in the “Reports” section. Look for the report dated 02/27/15.
Also, be sure to check out the latest BCI Training Videos and “Ask Alan” segments. You can view them at The Blue Collar YouTube Channel. For your convenience, the link to the BCI YouTube Channel is:
http://www.youtube.com/user/BlueCollarInvestor
Best,
Barry and the BCI Team
Alan, I have 2 questions on the two exit strategies of the Mid-contract unwind(MCU) as well as the Hitting a double strategy that I am each needing a clearer view on:-
(MCU)1. You told me that you need at least 1% extra over the cost to close value or else you will not do the MCU strategy.
Can you tell me why you choose 1%, and no less,- is it because of the commissions?, and from this do you suggest that we should also not do the MCU unless we can get at least 1% extra too?
2. If you had told me that it is not a good idea to use the same stock again that you have already done a MCU on maybe 2 weeks prior, then would this still hold true to not buy a stock that has just rallied up sharply, whether to a resistance level or not for fear it may then pullback a bit?
(Hitting a double)3. When you had a stock that has declined and you want to “Hit a double”, then after how many days of it rising back up do you then re-sell another call option for it?(does it depend if the stock or market has met a resistance level/area for you to then take action?)
4. And when I want to hit a double then does(or should) it have to be at the same strike price as just done before? Thank you
Adrian,
1- As you know, except for the earnings report rule, we have a multitude of “guidelines” where we have some latitude. I say 1% as a guideline because we are deciding between a max trade with huge downside protection versus entering a new position to generate more cash and which always has a risk component. For a return of < 1% even for a 2-week period does it pay to incur any risk? That's up to you...for me, no. I will usually look to get 1% + using an ITM strike mid-contract. 2- I am more likely to buy a stock that has appreciated significantly with a month to expiration than I would one with 2-weeks to expiration...more time for exit strategy execution. 3- With theta working against us, I will execute the 2nd leg of the trade no later than the 3rd week of a 4-week contract or the 4th seek of a 5-week contract and early in those weeks. If no rebound in share price I( would look to roll down. 4- Yes, same strike...I will rarely roll up in the same month. Alan
Barry-
Last week LUV was on the Running List. This week it is ‘Banned’ How did it earn this designation from one week to the next. I recognize that 3/3 is dividend payout. Does this factor in? I see that SAVE is banned also. Both in Transportation industry.
Joe and all members,
I will be writing a blog artivle about 13 new entries onto our “banned stocks” list…all airline stocks. I have recently learned that these stocks report monthlty “capacity” reports and then back-tested and found that a monthly disappointing capacity report can cause dramatic share depreciation. This is much like our banned stocks and monthly retail sales stats. More on an upcoming blog artile but we wanted to get these factors incorporated into our reports as soon as possible.
I’ll get to other emails and questions when I return from the Stock Trader’s Expo in NYC but wanted to answer this question while still at the event.
Alan
Thanks for your work, Alan….I have never bought an airline stock and never will. It is the ultimate fungible commodity.
The market is getting a little toppy feeling and the highlighted stocks from your list have dangerous looking charts. I recently lost MNST, NXPI and ULTA on big gap-ups in price. It seems more and more common. Now I see a chart like MOH that popped higher but is rolling over. I think we will see much more of that. What is your favorite bear strategy using options. Do you ever do bear call spreads or bull put spreads? It seems using the buy-write that getting bearish is difficult (though I did do that today with AKRX and was trying to do it with NOW)
Brian,
Not at all my intent to interrupt your dialogue with Alan who is first class about getting back to us. Rather to say I enjoy your insightful comments and questions.
I always felt I was making a deal with the devil when I sold covered calls on bio tech, internet, semi conductor or health care stocks that have solid charts and fundamentals. They often got called at a discount to market or I scrambled for a roll forward strategy.
Now I let them run uncovered. Or at most cover only half the position OTM. I have been delighted finding many like NXPI, VRX, CAVM and SWKS on Barry and Alan’s lists.
For call writing I prefer consumer, industrial, utilities and financial stocks. The likelihood of the empty feeling we have all had getting left at a bus stop we never intended to get off at is reduced.
To mix my metaphors keep a few horses under collar and let the rest run free! – Jay
Brian,
Covered call writing and put-selling are my go-to strategies in the stock portion of my portfolio. This is where I have had sustained success over the past 2+ decades. Spread trading is gaining interest in the BCI community and we plan to add educational material in this area as well.
Thanks for your contributions and feedback to our BCI community.
Alan
Premium Members,
The Premium Report has been revised and uploaded to the premium member website. The minor formatting issues have been addressed.
Best,
Barry and The Blue Collar Investor Team
Jay….I don’t think Alan will have any problem with his members dialogging with each other and sharing ideas. I mentioned earlier that I don’t care for bio-tech stocks, but let me clarify: I don’t buy small bio-techs with one drug still in FDA approval. THAT is a lottery ticket since no one knows how the FDA will rule. But I have or would buy larger more established bio-techs with existing revenue and good margins like Genzyme, Gilead, Celgene or Genentech.
One thing is for sure with the covered call strategy: one must be willing to take some risk with stock selection. Large and low-volatility stocks from the sectors you mention: utilities, consumer, financials, do not have enough vol to offer the 2-4% in 30 day premium recommended by BCI. Almost all the stocks on the watch list are tech, bio-tech, specialty retail or restaurant stocks. These are the stocks that really move in price (both directions) and that volatility and uncertainty is the source of higher option premiums. Even the older tech stocks like MSFT, INTC, CSCO or EBAY have poor call premiums.
To execute the covered call approach with the aggressive 2-4% in 30 goals of the BCI strategy requires the type of stocks that show up on the watch list, which are largely the same as from the IBD Leaderboard (aka day trading stocks). To execute successfully requires a lot of discipline, that Alan is willing to teach us, a good eye for technical analysis (I still believe that fundamentals hardly matter with this approach to investing except to screen for revenue growth and profitability). One can screen for sector rotation, but the watch list already takes care of that. A solid knowledge of “The Greeks” and options mechanics (subject of this week’s letter) is important to construct the best possible portfolio.
Though I have traded options for over 10 years, I am still learning and Alan is my teacher. I look forward to more lessons.
Brian,
Good morning and thank you for your reply. My hunch is like yours: Alan would love for this comment board to be more of an interactive member forum than him being perpetually in the witness chair :).
Speaking only for my journey with options selling the first thing I had to learn is premiums are cash flow not always income. I confused the two initially. I was perplexed when my account never went up by the amount of calls or puts I sold each month.
Then I had to make peace with how the highest premium stocks are not always the best choices because of where a particular sector or the overall market is.
Next I realized option selling is a great tool but not the Silver Bullet. As the old saying goes, “if your only tool is a hammer all your problems look like nails.”
I am in a good place today. I sell calls, puts and credit spreads on a variety of stocks to create a cash flow that could become income if the cards fall my way. I also hold a lot of things for appreciation I would not dream of writing calls against. I even buy some puts or calls for Pirate speculation on occasion to keep the game interesting :).
As you know, option premium levels are largely a function of where the VIX is and how turbulent the indexes are. So please do not lose faith in the kitchen table names like MSFT, INTC, CSCO or EBAY. I much prefer using them as my income stocks and using the heroes of the moment as my growth stocks unfettered by call writing.
It’s a Rubic’s Cube. And no solution is better than any other so long as you get the colors where you want them! – Jay
Back from International Traders Expo…Working on Puts Beginners Corner:
My team and I are back from our presentations in NYC @ The Stock Traders Expo. It was wonderful meeting so many BCIers and listening to your success stories…a real treat for me and my team.
My tech team is working on a glitch in the Puts Beginners Corner program and expect to have it resolved shortly.
I will be catching up on emails (hundreds last time I looked) over the course of this week.
Thanks to all of you for making The Blue Collar Investor such a prominent presence in the financial community.
Alan
International Stock Traders Expo: Alan’s seminar
CLICK ON IMAGE TO ENLARGE & USE BACK ARROW TO RETURN TO BLOG
@Jay….an alternative approach for the high vol stocks is to use aggressive call spreads with some small portion of the portfolio. I have done this successfully in the past and plan to do so in the future. My only caveat: limit to a small portion, maybe 15%, of portfolio. I once had over 50% in call spreads and the market turned against me (May 2010). It is amazing how fast your portfolio can disappear if overly aggressive. If more moderate, however, it is a good way to goose performance.
I would use call spreads rather than naked calls, on the typical BCI Watch List or IBD Leaderboard stocks since they have high vol and so have a lot of time premium in the ATM call options. If one goes 20% ITM on the long call and covers with a short call that is 20% OTM, most of the time premium can be eliminated even on LEAPs while providing plenty of upside as compared to the covered call strategy (much more conservative)
Example on a current Leader, PANW (current price $145): Jan ’16 120/170 call spread would cost net $24, which eliminates time premium. Max return is $170-145 = $25 for over 100% by next January.
Brian,
I am not as visionary as you. I am short term focused, keep score on as monthly basis and never sell options out longer than a month. But I will think about your post, run some numbers and test for errors in my thinking.
Your point is crystal clear and well taken.
Thanks for your May 2010 story.
I once naively tried to implode a substantial portion of my portfolio selling an inappropriate amount of puts and taking on inordinate risk. Pure luck got me out of that expiry alive but when I saw what happened to the stocks that went down I got a wake up call like the one you mention.
Moderation, position size and diversification are the simplest rules of the road. I had to learn them the hard way. – Jay
Selling puts is super dangerous in my experience. You really have to want those stocks put to you to sell their put options. There is nothing worse than having sold put options, like in September 2008, thinking a nice 5-10% correction will get you a good deal on the stocks you want and no worse, only to watch the market crater 50% and be left with a lot more stock than you ever wanted to lose 40-50% on, some of it at margin which then had to be sold at a loss to cover. Yuck. I will never go that way again.
This market is capable of a repeat of 2008 in my opinion. I have my portfolio on a very short leash.
Share devaluation is our main concern whether writing covered calls or selling cash-secured puts. This impacts us whether we own the shares first before writing a call or later, as a result of put exercise. Agreed that we should only sell puts on stock we would otherwise want to own…not because of option return. That’s why the screening process is so important as well as strike selection and position management. When we are extremely bearish, we will write deeper in-the-money covered calls and sell deeper out-of-the-money cash-secured puts, both giving us additional downside protection.
One of the guidelines in my latest book is to always buy back the put option when the stock price drops > 3% below the strike. This will generally keep us out of trouble.
Alan
The 3% bellow strike buy back guideline alone, is worth purchasing your book, and then some.
Thank you again – Roni
Alan,
You mentioned sell in-the-money strikes , is it about calls ,right ?
These stocks aren’t candidates to out-of-the money puts .
Best Regards
Eli
Eli,
The most conservative approach to selling covered calls is to utilize in-the-money strikes. The deeper ITM we go, the more protection we have and the lower are the option returns.
For put-selling, the most conservative approach is to sell out-of-the-money puts. The deeper OTM we go, the more conservative we are and the lower the returns will be.
Alan
Hey Alan,
This week I tried the “how to play the Bid-ask spread” described in a recent article.
I attempted to sell 3 APR 10 LUV 44 calls which had a spread of 1.70-2.05. There had already been a trade that day at 1.91. Therefore I decided to enter a limit order for 1.90 and see what how it would go. Well, not only did the order not fill, but it seems that my limit order updated the ask price to 1.90. After waiting a bit, I simply cancelled the order.
Any insight on what I may have done wrong?
Jon, several things can happen to explain not getting filled at the mid when trying to sell a call.
1) The most common is the stock price goes down after you place your order. This makes the selected strike less valuable so of course it won’t fill.
2) Single strikes that are not rolls are often/usually used by the MarketMakers to fill other retail trader’s orders. If no one else has an order in to buy that strike at that price, it won’t fill.
3) Given 2), your offer must have been the highest sell order on that strike but lower than what the MM had been offering. Hence, the MM offered yours to other traders to buy and it became the Ask.
Hope these make sense to you.
Steve
Let me add this to Steve’s terrific response:
Jon,
You did fine…there’s no 100% guarantee that your order will be executed. According to the “Show or Fill Rule” (Exchange Act Rule 11 Ac 1-4) market makers are required to publish any order that “improves” the bid or ask prices (as yours did) OR fill the order. So the market maker is faced with the dilemma of executing the trade at our limit order and keep the current larger spread or fill the order at our requested limit price. In this case, the market maker decided to publish your order and decrease the spread. In other scenarios, our limit orders will be executed. You will note that you still had the opportunity to sell at the original published bid. I have found that using this approach will result in more favorable trade executions for us more often than not.
Keep doing what you’re doing.
Alan
Jon, I find I get much better execution if I eliminate the risk to the market maker. When I roll up or down or out, I get better pricing. This is because, I believe, the MM does not have to take a position but can maintain risk and collect the commission / spread. On a well traded option I can roll out a month or up a strike and give up maybe $0.10 spread (plus the brokerage commissions) which is a good execution. I do this whenever I can, which also keeps me from get whipped around by the market by pushing the panic button. I do let my options expire ITM, though. It forces me to reconsider and is cheap in terms of trading costs.
I have added a new rule that I will not roll up in the first month since I have been whipsawed by some very volatile stocks doing this. It happens when I roll up as the price approaches the strike losing my original premium on my short call only to see the price drop back below my original stock purchase price and then hitting my stop limit causing me to sell out at a loss).
I would like to give up a lot less spread, but the options market is too thin. Maybe someday, we will get a spread of a penny for the MMs. 🙂
Joe M shares his portfolio management technique and then hits a “ground rule double”
Joe thanks for sharing:
I, 100% subscribe to the “best-of-the-best” “cream-of-the crop” sector picking philosophy.
That being said, today is the end of the trading month. I always do an overall evaluation of where I am; how I did; and where I’m going from here. This isn’t specific to covered calls but more portfolio management and evaluation. What I do is go to Morningstar and click a saved sectors link.
http://news.morningstar.com/fund-category-returns/
Sort by 3 month and/or 1 year (high to low).
Scroll to the bottom and look at the sector equity funds. I then list these sectors on a XL spread sheet. I have been doing this month after month for quite some time now. I color code all the different sectors. This allows me to visually track those that are growing stronger and those becoming weaker. I was doing this monthly using the 1 year return numbers but since I started with Covered Calls and I started tracking the 3 month returns every month as well. I probably own equal number of ETFs and stocks and mutual funds. I find that as I sell off my underperforming Mutual Funds, I have a tendency to move to higher performing ETFs. Although these sector statistics are made up of mutual funds, I use it just to get the sector list – strongest to weakest. If I am looking to add an ETF to my portfolio I next click
http://news.morningstar.com/etf/Lists/ETFReturns.html
Click ‘Show Complete List’ then sort by ‘Category’.
Now I can scroll to the category / sector I am interested in. I can look at the returns and especially the volume to pick a new ‘soldier’ to join my forces. It’s also interesting to sort by ‘volume’. Finally, the same evaluations can be done at:
http://news.morningstar.com/stockReturns/CapWtdSectorReturns.html
Using the drop down you can get industry related rather than sector. Sort by industry performance then select the industry to see the performance of individual equities in each industry – strongest to weakest.
There you have it. I know this is rather long. I apologize for that. It’s just my writing style. I think that if you take the time to look at these links you will see how easy they are to follow and the information is relative. I know your Weekly Report results are more specific to good Covered Call candidates. That is a big part of why I became a premium member. However, this may help those that are not yet premium members looking for a good way to scan that brings viable candidates.
One final thing. Earlier this month (Feb expiration) I was crushed by AXP (one of my long time holdings). Sold covered call o-t-m. Bailed out at 17% following the 10%/20% guideline. Rolled down and had to bail out again at 8%. Not a true ‘hitting-a-double’ since I rolled down, but can I get credit for a ‘ground-rule-double’? Love this time of year. Spring training game next weekend and tickets for opening day. Life is good.
Below is Joe’s spreadsheet, CLICK ON IMAGE TO ENLARGE & USE BACK ARROW TO RETURN TO BLOG
Charts are nice for visualizing the market all at once. Those who do not want to manually create the chart that Joe has above (very nice) can use a tool from FinViz that accomplishes about the same using a “heat map”. One can adjust this heat map for ETFs or Stocks and by period. The 3 month heat map for ETFs is here. See the bright reds are the losers and the bright greens are the winners. Sectors and winners or losers within sectors really jump out.
http://finviz.com/map.ashx?t=etf&st=w13
Brian, Better late than never. I visited the Heatmap in Finviz you posted. I agree that it tells a story that is a snapshot in time. The difference for me is I can better track sectors monthly for the past >year to see those that are exhibiting strength or growing weaker over time. Just a different perspective.
Premium members:
This week’s 6-page report of top-performing ETFs and analysis of ALL Select Sector Components has been uploaded to your premium site. The report also lists Top-performing ETFs with Weekly options.
For your convenience, here is the link to login to the premium site:
https://www.thebluecollarinvestor.com/member/login.php
NOT A PREMIUM MEMBER? Check out this link:
https://www.thebluecollarinvestor.com/membership.shtml
Alan and the BCI team
APPLE NEWS:
Apple Computer to join Dow 30 AT&T leaving.
Prestigious for Apple more than anything else…may see a bit of a pop today.
Alan
The Gap (GPS -1.43%) fell 2% in after-hours trading after it reported February same-store-sales fell 4% y/y.
There you have it. Point made. NO RETAILERS !!
Hi Alan,
On a blood on the street day such as today, would you recommend staying away from entering covered calls?
Raja,
I do research why the drop but generally do not panic or over-react. When we sell low-risk options. we are leveraging companies that have elite fundamentals and favorable technicals. Those assets do not disappear in a day. Nor do they improve dramatically in a day if the market goes up 300 points. I stick to the “plan”
The market consists of investors with human frailties…fear, greed, panic and euphoria for example. Ultimately, this will shake out and the market will return to the business of the day.
That said, when there is a bearish or volatile trend, we can still “stay in the game” by trading more cautiously…ITM strikes, low-beta stocks, ETFs or even inverse ETFs.
Looking back over decades of the US stock market we see an uptrend that averages 8-10% per year. One day should not dictate a trading philosophy in my view.
Alan