
Portfolio overwriting is a covered call writing-like strategy where we sell call options against long-term buy-and-hold securities. Generally, these are low-cost basis stocks that are dividend-bearing and trading in non-sheltered accounts. We want to leverage these stocks and exchange-traded funds (ETFs) to generate additional income but also want to avoid assignment of the shares to avoid tax issues. In essence, we want our cake and eat it too!
Setting up and managing our covered call positions are handled in a specific manner when incorporating portfolio overwriting into our investment arsenal. This article will focus in on the time frame just prior to contract expiration where share value has appreciated above the original out-of-the-money and now in-the-money strike. We will use United Health Group, Inc. (NYSE: UNH) as the June 2017 contracts were expiring on June 16, 2017.
Price chart of UNH on June 16, 2017
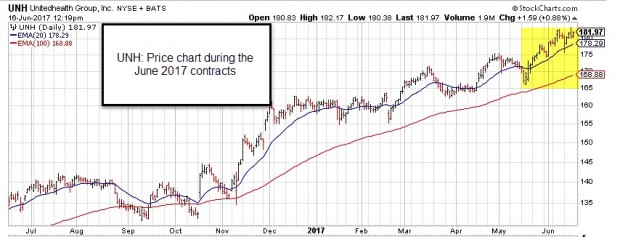
UNH Bullish Price Chart
The yellow field shows a price range of $169.00 – $182.00 during the contract month.
Trade assumptions
- The June 16, 2017 $180.00 out-of-the-money calls were sold after expiration of the May 2017 contracts
- Stock price is $182.10 in the early afternoon of June 16, 2017, expiration Friday
- Contract exercise and share assignment must be avoided to avoid tax consequences
- The options must be rolled to the next month
Position management decision
Since we use out-of-the-money strikes with portfolio overwriting to allow for continued share appreciation, we must determine which strike to select.
Cost-to-close the near-month short call
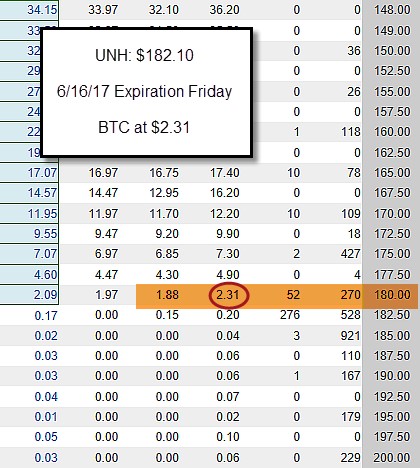
Option Chain for UNH to Close the June Short Call
The published “ask” price is $231.00 per contract to close the near-month covered call.
Option chain for the July 21, 2017 call expirations

Option Chain for UNH July 2017 Contracts
We will calculate the returns for 3 out-of-the-money strikes:
- $182.50
- $185.00
- $187.50
The Ellman Calculator
We will use the “What Now” tab of the Ellman Calculator to generate the following results:
$182.50 strike
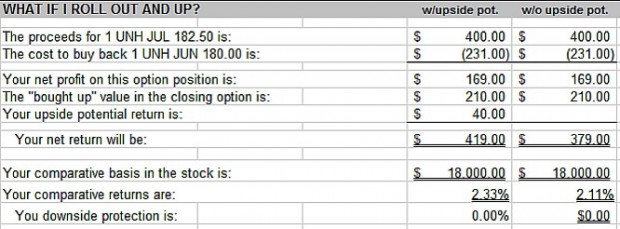
Rolling Out-And-Up to the $182.50 Strike-
$185.00 strike

Rolling Out-And-Up to the $185.00 Strike
$187.50 strike

Rolling Out-And-Up to the $187.50 Strike
These three screenshots show that the $187.50 strike offers the highest total potential return (option premium + share appreciation to the new strike = 3.98%). The $182.50 strike generates the highest initial return (2.11%) for option premium only.
Discussion
When using portfolio overwriting, it is understood that in-the-money strikes must be rolled prior to contract expiration to avoid tax issues and continue dividend flow. When significant share appreciation has taken place, we look to roll out-and-up. The selection of the new out-of-the-money strike will be dictated by our evaluation of the degree of bullishness we assess the market. If strongly bullish, we would favor deeper out-of-the-money strikes to capture more share appreciation in addition to the option premium. We select slightly out-of-the-money strikes when there is a bearish tone to our market outlook.
***Thanks to Paul S. for inspiring this article.
Next live event
AAII National Conference
November 3rd – 5th: Loews Royal Pacific Resort Orlando Florida:
Exhibit Hall # 303
Alan’s Workshop presentation Saturday 10:30 – 11:45 AM
COMING SOON
Strategies covered:
Portfolio Overwriting
The Collar Strategy
The Poor Man’s Covered Call
***The BCI team is also developing new calculators specific for each of these strategies.
Market tone
Global stocks dipped a bit lower this week, with Japan’s Nikkei average a bright spot, closing at a 21-year high. The price of a barrel of West Texas Intermediate crude oil rose about $1 to $52.60 while stock market volatility, as measured by the Chicago Board Options Exchange Volatility Index (VIX), was relatively unchanged at 9.80 from 9.9 last week. This week’s economic and international news of importance:
- The European Central Bank delivered a “dovish taper” The ECB will buy $30 billion worth of European bonds each month starting in January and ending in September
- The US economy grew at a faster-than-forecast pace of 3% in the third quarter, beating 2.5% forecasts
- Real consumer spending showed continued strength last quarter, rising 2.4%, which exceeded forecasts of 2.2%
- Core inflation remained well below the US Federal Reserve’s 2% target, coming in steady at 1.3%
- The Ifo Business Climate Index hit a record high this week, reflecting confidence that Europe’s economic recovery will extend into the future
- China’s Communist Party, Xi Jinping was elected to a second term as president
- The House of Representatives passed the Senate’s budget bill, laying the procedural groundwork for the passage of a tax reform package without any support from the Democratic opposition
- The US dollar advanced strongly late in the week, particularly against the euro, lifted in part by the ECB’s relatively dovish shift toward a less accommodative monetary policy
- The leadership of five large British business groups wrote to Prime Minister Theresa May this week that their members will start moving jobs and investment outside the United Kingdom if a transition deal with the European Union is not agreed soon
- Japanese prime minister Shinzo Abe won a landslide victory in last weekend’s general election, opening the way for a push to amend the country’s pacifist constitution
- With 45% of the constituents of the S&P 500 Index having reported Q3 earnings, the blended estimate for aggregate year-over-year earnings growth is 5.3%
- Excluding the energy sector, the earnings growth estimate is 3.0%. The blended aggregate revenue growth projection for the quarter is 4.8%. However, stripping out energy, revenue is expected to rise 3.9%
THE WEEK AHEAD
Mon Oct 30th
- Eurozone: Economic sentiment index
- US: Personal income/spending
Tue Oct 31st
- China: Purchasing manager’s indicies
- Japan: Bank of Japan rate decision
- Eurozone: Consumer prices
Wed Nov 1st
- Japan, UK, US: Manufacturing PMIs
- US: FOMC rate-setting meeting
Thu Nov 2nd
- Eurozone: Manufacturing PMIs
- UK: Bank of England rate-setting meeting
Fri Nov 4th
- US: Employment report
- China, UK, US: Services PMI
- Canada: Employment, trade reports
For the week, the S&P 500 rose by 0.23% for a year-to-date return of 15.29%
Summary
IBD: Market in confirmed uptrend
GMI: 6/6- Buy signal since market close of August 31, 2017
BCI: My portfolio makeup reflects a slightly bullish bias, selling 3 out-of-the-money calls for every 2 in-the-money calls.
WHAT THE BROAD MARKET INDICATORS (S&P 500 AND VIX) ARE TELLING US
The 6-month charts point to a slightly bullish outlook. In the past six months, the S&P 500 was up 8% while the VIX (9.80) moved down by 5%.
Much success to all,
Alan and the BCI team


Premium Members,
This week’s Weekly Stock Screen And Watch List has been uploaded to The Blue Collar Investor Premium Member site and is available for download in the “Reports” section. Look for the report dated 10/27/17.
Also, be sure to check out the latest BCI Training Videos and “Ask Alan” segments. You can view them at The Blue Collar YouTube Channel. For your convenience, the link to the BCI YouTube Channel is:
http://www.youtube.com/user/BlueCollarInvestor
Since we are in Earnings Season, be sure to read Alan’s article, “Constructing Your Covered Call Portfolio During Earnings Season”. You can access it at:
https://www.thebluecollarinvestor.com/constructing-your-covered-call-portfolio-during-earnings-season/
The report for next week, 11/03/17, will be published and uploaded late on Monday (11/06/17). Alan and I will be attending the American Association of Individual Investors (AAII) 2017 Convention. The event runs from Friday, 11/3/17 through Sunday, 11/5/17.
Best,
Barry and The BCI Team
[email protected]
Alan,
In the past you have talked about using the show or fill rule to get a better price when selling options. Can we also use it to get a better price when buying back options…lower than 2.31 in this case?
Thanks,
Gary
Gary,
Yes, absolutely. First, we locate the “mark” or mid-point of the spread. In this case $2.095. When buying an option, we place our limit order above this mid-point. A reasonable limit order to enter would be $2.20, which, if executed, would save us $11.00 per-contract. $2.15 could also be tried but will be slightly less likely to be executed.
Alan
Alan,
Just watched the video on “constructing covered call portfolio during earning season” which was very helpful.
My question is:
If you already own the stock and have been successfully writing covered calls (without having the shares called away), what do you do with the stock during this “earnings report” contract period? Sit on the sideline and wait till it’s over? Or sell the stock ahead of the earnings report?
Sorry if there’s already an “answer” on BCI web page, please direct me to it. Thank you!!
Have a great show in Orlando.
Theresa
Theresa,
Good question and I recently published an article on this topic:
https://www.thebluecollarinvestor.com/holding-a-stock-through-an-earnings-report-a-real-life-example-with-avgo/
Thanks for your “Orlando” well-wishes…maybe we’ll bump into Mickey Mouse…
Alan
Theresa
What has happened with prior expirations has no relevance to the current one. It’s a new day.
You should determine why you are holding the stock (growth, income or a combination of both) and what you want to achieve as well as prevent when there is a pending EA.
If you want to participate in the upside of a good EA and you are willing to accept the downside if the report is bad, just hold the stock and see what the market gives or takes (no covered call). If you don’t want any part of that then you have several choices:
– sell the stock and re-enter after the EA or sell and find another stock with good potential for the upcoming month
– sell a deep ITM call, accepting a lower time premium and protecting the downside
– hedge your position with a no/low cost collar so that you can profit from a good EA and only incur a limited loss potential if it’s bad. For those who understand option pricing (?) you can take advantage of pre-earnings IV expiration by diagonalizing the collar.
Use options to tailor the R/R to your comfort zone.
Hi Theresa,
Two things I have found helpful when intending to hold a stock for a duration beyond the confines of a couple months is have at least 200 shares if budget/asset allocation permits and only hold those with weeklies. My flexibility is greatly enhanced when I do that.
And while I never over write an earnings report I only have to sit out 4 out of 52 weeks during the year. And if I want to sell 100 shares and ride out earnings with the other 100 that is easy.
It also provides the ability to split strikes – maybe one ITM and one ITM or just cover 100 shares and let the other 100 run, or none at all, when planning the other 48 weeks of the year creating my own expiration periods that might be different for one half of a position than the other to diversify by both strike price and time.
Anyway, as you know from many successful expiry periods there is more flexibility in call writing than may meet the eye at first glance. Best wishes for a great earning season! – Jay
I have a question about how a Buy Write gets filled. There is a specialist on the stock side. Do they also handle the option side, or does that go to CBOE? Or is there a over riding computer program running an algorithm looking at the net debit and seeing if it falls within an acceptable spread, then it is filled, else it remains open? I hope this question makes sense.
Thanks;
Terry
Hi Terry,
The net-debit limit order is sent to the option exchange where market-makers agree on the net-debit limit price (spreads order book). They then contact the stock exchanges they work with and purchase the stock at the best available price and then adjust the option price accordingly. Most trading of this nature is now automated with electronic trading engines.
Alan
Premium Members,
There was a typo for the stock “YY”. The stock should show that it has “Weeklies”. It is located in the “Passed Previous Weeks & Failed Current Week” (pink) section of the 10/27/17 report.
Best,
Barry
Barry,
DXJ Wisdom Tree Japan Typo:
In the Premium Report for 10-27-17, Weekly ETF Summary, DJX should read DXJ. It is correct in the ETF report for 10-25-17.
Mario
Mario,
Thank you for spotting the typo/transcription. I changed the symbol in the master for next week’s (11/03/17) report…if DXJ makes the “Top Six” list of the ETF Report.
Best,
Barry
Some decent offers out there today, just bought into the BZUN 30’s, CSTM 12’s and WUBA 60’s, all November 17 expiry. All decent ROO’s with good DP and bullish charts.
Justin,
I’m fully invested.
Added today MKSI and ABMD.
Watching SCSS very closely.
Good morning – Roni
Roni – looking at those two I’m assuming you got the ATM’s with ROO’s around 2%?
Re SCSS yes those mattresses are sagging a bit – it still looks to be within the bullish flag formation it commenced about two weeks ago though.
Justin,
you are right,.
ABMD : Bought 100 shares @ 179.12 and sold 11/17/2017 180.00 C for 3.65 ROO = 2%
MKSI : Bought 200 shares @ 105.95 and sold 2 11/17/2017 105.00 C for 3.45 ROO = 2.4%
SCSS is improving slightly today.
Roni
Roni,
Thanks for the reminder on MKSI (LP 10/30/17 105.55). It is paying ITM (Strike 105) (time value 2.60) 2.47% with a good OI and slightly higher Spread of 0.65. ITM BEP is 102.40 (mark 3.15 premium) which is a good margin. It is paying OTM (Strike 110) (Time value 1.10 1.04% Static with Up potential of 4.2% for a total of 5.24%. OTM BEP of 104.5 is not that graat, but that comes with the higher risk and lower OTM premium you are taking. MKSI has a nice rising pattern not affected by much (until I buy it!).
I briefly looked at it yesterday but passed it over since I am trying for 200 shares minimum on my orders when looking to satisfy cash balances in more than one account since it will lower the commissions cost per share going in and going out. Important for a gap up to lower the cost if I have to close the option leg.
I am 88% invested. I bought Covered Calls on DAN (OTM) yesterday, in 3 accounts, and within 1 minute of completing my orders, the market dropped from -22 to -70. But I am still happy, it finished End of Day at my Purchase price.
On my larger account left with some cash, I can buy more than 100 shares so it looks like a good buy for today. That will put me at 90% plus invested. So you see you can still find some good values into the 2nd Week of a cycle.
I know it is important to try to get invested the first few days of a cycle but I find that daunting since I am also trying to phase out any sinking Worthless (option) investments or adding an option leg to a Worthless (option) but good trade (sounds like an oxymoron). Also there are other things, positive and negative, to do in life that come up.
ETF’s:
On my Joint Trust EFT only account, KWEB and EWZ have been disappointing at my entry price points.. Have to make a decision on whether to hold or cash out. They are currently 2.9% and 4.9% below my BEP.
KWEB has not been in the ETF top 6 list for 2 weeks after being there for 18 weeks straight, mostly in the top 3 In the last 2 months, it has cycled down and up twice.
EWZ,even though it is heading south, is still in the Top 6 list (#3 last Wednesday) and has been there for 10 weeks consecutively. It also has cycled down and up twice within the last months. I checked Barchart.com and it is a Weak Sell and
I am sure others have different viewpoints to tell because one’s view on a trade depends greatly when they entered the trade. That is what it all about – your cost.
I did a quick check on Barchart.com and both EWZ and KWEB are rated at Weak Sell.
With Barchart.com, looking at the ETF Report Top 6, 3 are Strong Buy (SOXX #2, SMH #2, DXJ #6), 2 are Weak Buy (LIT #1, RSX #5) and EWZ #3 is a Weak Sell.
Mario
Mario,
Wow….., all this must keep you very busy. Right ?
Roni
Looks like you’re very busy there Mario! Have you tried BCI’s DCCC program though? “A picture’s worth a thousand words” 🙂
Wretched CSTM – I buy in and they immediately announce a capital raising; thanks from the heart of my bottom guys…
Justin,
I tried to understand why your CSTM trade went against you, and I believe there are several problems.
1 – Small market cap, high PE
2 – low share price ( I never like to trade under 30.00 shares)
3 – 4.5% ITM ROO (red flag)
Please do not take offense.
Roni
Justin,
I bought back all the 7 SCSS calls monday at 0.25 (20% of original premium) and I’m waiting a few days to see if I can hit a double.
Roni
Roni,
I never take offense unless you start calling me names (the wrong ones anyway) 🙂
Certainly the smaller stocks are often more volatile – possibly you’re right overall, I haven’t been doing cc’s long enough to be sure. Re the ROO Alan has said he’ll accept a ROO up to 6% in a bull market, so I don’t think a NTM ROO of 4.2% is necessarily a red flag – I’ve had a lot more winners than losers with similar ROO’s.
SCSS is now SNBR – good luck with your double!
Justin,
something strange happened to my SCSS options buy back, probably due to the change to SNBR.
My order was canceled, and the calls reappeared as active again.
So no chance for double.
Mistyfied – Roni
Justin,
I just read an article at Yahoo where SNBR lost a lawsuit against Personal Confort yesterday.
So this explains the sharp drop in the stock.
Roni
Speaking of rolling options, if a stock’s price moves sharply and there is no strike price available in the week or month that you want to trade but it exists in another expiration, you can request that it be added by contacting the CBOE at:
[email protected]
Indicate the expiration and strike price that you would like added. They will research it and if acceptable, they will add it. I contacted them earlier today and within 5 minutes, they indicated that the two options (same strike, different weeks) that I requested will be added tomorrow.
I wrote a deep ITM call on YY (premium $7.30) only to watch the stock fall nearly 10 points. I bought back the option for $2 on Friday and had a restless weekend thinking about that big dip. The stock recovered a bit on Monday and I resold the option for $3. I am about break even right now. I don’t exactly have nerves of steel when it comes to watching stock values decline. This was my first real experience in dealing with a significant stock decline.
Hi Blair,
Please feel fortunate YY was your first experience with a stock that went down fast! If you stay in this game long enough you will have many :).
It usually inspires one or more of the following adjustments: reduce position size in any one stock, add lower Beta stocks, and/or add ETF’s to offset the volatility in the glamour stocks.
Your example is proof positive of the wisdom in selling ITM calls as part of our mix. You would have been worse off if you sold OTM and worse still if you were not an option seller at all. – Jay
Blair,
This has happened to me before. Stocks do fall and do recover back to their original price as well.
An alternate course for you would have been to follow Alan’s 20/10% strategy rule and possibly Hit a Double to almost double your income later on as follows:
Wait till premium for a BTC is 20% of 7.30 or $1.40.
Then wait it out as a long position to see if stock recovers to your original Purchase price, where you can Sell another option to Hit a Double. in premium on the same underlying.
If it does not recover to its original price, wait it out as a stock to see if it reaches at least your BEP. If you are not happy with the stock create an order to have it sell at your BEP plus an amount to compensate for your commission. I have found stocks suddenly rise for a short time from opening to close for some reason and the order will fill to make your BEP.
Since this is an up market that stock might come back since I notice it had some dips before but this last dip did break it previous low support.
When I joined Alan in May of 2016, it was Earnings Week (Not the best time for a newbie) my 2nd CC did go down 10% because I misinterpreted the Earning Report and I wrote the CC too early and did not wait till it settled after the ER. Had to bite the bullet since it refused to turn around after buying it back at the 20% premium point.
Mario
@Jay, @MarioG
Thank you both for your advice. It’s always good to hear the perspective and experience of others.
Hey Blair,
You managed that trade very well. No matter how good we get at stock picking it is a fact of trading we will have a few that pooh the bed for unforeseen reasons on occasion :)! – Jay
To all:
Next Ex-Dividend for DAN Dana, Inc. is 11/9/2017.
I picked it up as an ALERT on Fidelity’s Active Trader Pro Platform. See Image attached for interesting history information. Historically for the last 5 dividend dates, price rises on the average 3.9% before an ex-dividend date.
Next Dividend payment: $0.06 per share (0.81% / year)
Last Price: 10/31 1PM 30.3843
Verified at:
http://www.dividendinvestor.com
http://www.dividend.com
http://www.barchart.com
Mario
Premium members:
This week’s 8-page report of top-performing ETFs and analysis of ALL Select Sector Components has been uploaded to your premium site. The report also lists Top-performing ETFs with Weekly options as well as the implied volatility of all eligible candidates. For your convenience, here is the link to login to the premium site:
https://www.thebluecollarinvestor.com/member/login.php
NOT A PREMIUM MEMBER? Check out this link:
https://www.thebluecollarinvestor.com/membership.shtml
Alan and the BCI team
Roni – thanks for that, here’s one I just found:
http://www.tristateupdate.com/story/36738075/personal-comfort-again-defeats-serial-litigant-sleep-number-in-17-million-lawsuit
I managed to get 100% invested yesterday after getting some CONN 29’s with a ROO of 2.9% and DP of 5.8%. Chart is very bullish, currently in a ‘flag’ formation.
Justin
Justin,
nice. CONN is up today, @ 31.40 as I write.
I placed a new buy back on my SNBR calls @ 0.25 and got a fill. Now watching and thinking what to do next.
Roni
Appears to have been an over-reaction to the lawsuit – time will tell I guess…
Justin
Alan-
What is the “bought up value in closing option” in your above roll-up & out calculator example. How do you come to this?
Also, I did my first call premium options trade (having read your books). On 10.3.17, I sold the Oct20 MMM 215 Call for a premium of 1.80, when stock was trading at 214. My goal is to generate premium off MMM and hold the stock due to low cost basis. MMM was set to report earnings on 10.24. Stock sentiment was relatively bullish into earnings. Leading up to earnings, the premium (and stock price) surged and I eventually B-T-C at $4 on Oct. 19th (day before expiration) when the stock price spiked to 218. Glad I did, b/c the premium kept surging higher just before earnings. On earnings, which were excellent- stock gapped up. This led to a loss of 220 (400-180) on the premium, but I had a 466 gain in the stock (from 214 to 218), equating to a net gain of 246. To me, this is a loss b/c my plan was to never sell the stock anyway.
With earnings on 10.24, immediately rolling out & up would not have been prudent given earnings (and the right decision since the new premium continued surging into the strong earnings report.
My question is, what’s best way to manage this trade (and not get exercised) with a surging premium (and stock price) and stay in the game (rolling). Implied volatility seemed normal at time.
Would it have been better selling the call again shortly after earnings – after the stock gapped up? Thanks.
Mike,
This is my first blog response since returning from our presentation at the AAII national conference in Orlando late last night and you ask an extremely pertinent and important series of questions. My responses:
1: Bought-up” value: When we sell a call option we are agreeing that our shares cannot be worth more than the strike price sold under that contract obligation. If we buy back that option when it is in-the-money, the share value rises to current market value and that intrinsic value component is part of the premium we pay to close the original short call. As an example, if we sold a $50.00 call and the price is now $52.00 and the cost-to-close is $2.10, the “bought-up” value is $2.00 and the actual time-value cost-to-close is $0.10. In other words, a debit of $2.10 on the option side and a credit of $2.00 on the stock side.
2- The best way to manage the MMM trade is never to enter a covered call trade when there is an upcoming earnings report prior to contract expiration…problem solved. Allow the report to pass and then sell the call the day after the report once the price settles. Another approach would be to user Weeklys (when applicable) and not sell the Weekly the week of the earnings release.
Congratulations on your recent success.
Alan
Barry,
It would appear that EarningsWhispers is thoroughly unreliable. I’ve just discovered that THREE of my eight CC positions have had their ER dates switched to dates before expiry of the November contract (SINA, BZUN and WUBA.) And yes, I’d rechecked the dates right before I bought the stocks. Would you normally try and verify the date elsewhere?
Justin
Justin,
yes , this is a problem I have encountered several times too.
When EarningsWhispers shows the estimated date very close after expiry fridays, it can always happen. They have a “minus” simbol above the date, which means it is not confirmed, and a “check” symbol when confirmed.
So, this is one more thing we have to verify before placing a CC trade, and decide to take the risk or not.
Yahoo shows a range os dates, but the truth is, nobody knows.
Roni
Justin,
This is one of the most common questions that I get. As it turns out, ER dates can move. Until a company confirms the date (and issues a press release or notes it on their website), the published ER dates are best estimates based on commonly used industry algorithms. Until the ER date is confirmed by the company, I can have five different dates from five different sources. Enev after a date is announced by the company, dates can move due to company circumstances.
Historically, Earnings Whispers has been the most consistently accurate source that we have used over the almost 10 years we have been publishing our Premium Report.
As an example, the following “fine print” accompanies ER date data on Schwab’s site: “The date was gathered by Wall Street Horizon callers, but it is still considered tentative.”
Now, to the stocks that you mention: BZUN, SINA, and WUBA. As it turns out, they are all Chinese stocks. Historically, aside from the largest Chinese stocks, there have been transparency issues related to Chinese stocks.
Best,
Barry
Thanks Barry, yes I think from now on I’ll be omitting stocks reporting in the week following expiry as well! I’d forgotten they were all Chinese too – I’ve just discovered another one, YY, which of course is also Chinese…
Justin
Justin,
I just placed a notification on the Blog, re: YY. So far 4 of 4 were Chinese. Also, BZUN and WUBA were not stocks that passed our screening process.
As a result of your noticing the ER date issue, I’m going to attempt to identify the micro-cap and small-cap Chinese stocks in the report. I haven’t seen this behavior with large-cap Chinese stocks.
Best,
Barry
Alan, thanks for the explanation on “bought up value”.
Regarding MMM, earnings were set to come out 4 days AFTER contract expiration – not before (which I would not do thanks to your good education). Perhaps, as you refer to in the “weeklies”, i should not have entered the covered call given that MMM was reporting within the week, which was 4 days after.
Would an impending ex-div announcement (sometime that month)have a big impact too? Thanks.
Mike,
If the contract expiration date is after the earnings report date, the contract should be avoided whether Weekly or Monthly.
Ex-dates are significant if we don’t want shares sold as a result of early exercise. The most likely time for early exercise is the day prior to the ex-date. These issues can be resolved by selling the option the day of or after the ex-date or writing a 2-month option moving contract expiration far away from the ex-date.
Alan
Alan, My questions above are when the contract expires just BEFORE (not after) earnings (which in MMM’s case, their earnings were 4 days AFTER expiration) and the premium/stock totally surged into earnings in which I B-T-C at a loss on 10.19 b/c i didn’t want to sell low-cost basis stock.. Contract expiration was 10.20, earnings 10.24. thnx.
Mike,
I would have to see cost-to-close stats to comment on the MMM trade but in general, a contract is eligible if earnings is scheduled to be reported after contract expiration. The actual loss in closing should be measured in “time value cost-to-close”, not total premium cost-to-close if the strike is in-the-money. The rationale is detailed in my books and DVDs. I’m happy to respond in more detail if you provide the price of the stock at the time of expiration, the strike and the total premium cost-to-close.
Alan
Price of stock at expiration was 218, Strike: 215, and total premium cost-to-close:$4.
I initially sold the Oct20 MMM 215 for a premium of 1.80 on 10.3.17 when stock was trading at 214, b-t-c at $4 on Oct19th, when stock trading at 218. Earnings on 10.24.
Mike,
Here are the calculations:
Initial return on option (ROO): 180/21400 = 0.84%
Return with upside potential: ($180 + $100)/$21400 = 1.31%
Time value cost-to-close: $400 – $300 (share price now worth $218)/$21500 = 0.47%
Total return if closing entire position before 10/24:
($180 + $100 – $100)/$21400 = + 0.84%
It ends up a winning trade with no earnings report risk.
Alan
thanks Alan.
I M O – it’s a winning trade if i had just bought the stock (MMM) and my plans were to sell the stock. But again, this is stock (low cost basis) that i owned already and i had no plan on selling it. In other words, if i did nothing, and not sell the premium initially, and let stock appreciate (which would have done anyway), i would not have lost the B-T-C amount of 220 (400-180) on the premium.
I don’t know.. .maybe I’m looking at this wrong.
Anyway, thanks for your input.
Mike,
It’s a “winning” trade in the sense that you made money. Now, it is true that you would have generated higher returns had you been using other strategies but we can probably say that for any trade we make.
It is interesting that the option was exercised early and apparently not related to an ex-date. If there was any time value left on the option, then more than likely it was investor error that landed on your doorsteps. It’s happened to me 3 or 4 times in 25 years of selling options (50 – 100 contracts/month)…very rare.
Alan