
Covered call writing involves options calculations…there’s no getting around it! It’s been a while since we talked math. What’s with all the frowns? Mastering and understanding the calculations (The Ellman Calculator will do all the work) will enhance our bottom lines…more cash in our pockets. With that in mind, let’s set up a hypothetical portfolio of 5 securities with a cash available reserve of $50,000.
Since our system requires cash, stock and industry diversification, we will look to purchase 5 securities in 5 different industries and allocate approximately $10k per equity. I turned to a previous premium watch list for eligible securities and (randomly, these are not recommendations) selected 4 stocks and 1 exchange-traded fund from our premium reports. Here are the securities with industry and price:
- PVH- apparel: $74.63
- GSM- Metals: $24.50
- HAL- Energy: $56.97
- EBAY- Retail: $33.32
- ICF- Real Estate ETF: $76.28
I compute the number of shares to purchase by first dividing $50k by 5 (stocks) and allocating approximately $10k per equity. We must also be sure to leave a small balance for possible exit strategy execution. We then divide the price-per-share into $10k and round to the nearest “100″ (there are 100 shares per contract). This is called cash allocation. Our portfolio will look something like this:
- PVH: 100 shares
- GSM: 400 shares
- HAL: 200 shares
- EBAY: 300 shares
- ICF: 100 shares
This represents a total investment of $46,291 leaving about $3700 for possible exit strategy executions.
Next we turn to our options chains and look to the nearest strikes prices, both in, at, and out-of-the-money. We enter the information in the “multiple tab” of the Ellman Calculator”. Here are the statistics entered into the calculator at the beginning of the contract cycle:

Ellman Calculator
The beauty of this calculator is that it will assist us in making our investment decisions based on our market assessments and chart technicals. We must also factor in our personal risk tolerance (if low, favor in-the-money strikes). If we are bullish on the stock and overall market, we look to garner the highest ROO (return on our option) and upside potential (out-of-the-money strikes). If we are bearish or concerned in any way, we look to get the additional downside protection of an in-the-money strike. In the chart above, I highlighted in yellow the choices we would favor if we were bearish. We can generate a 2%, 1-month return with some excellent downside protection.
I also highlighted in green, some bullish choices we would consider where the return and potential return of share appreciation are greater but with little or no downside protection of the initial option profit (time value of the premium). Please remember that downside protection in the BCI methodology represents protection of the option profit, not the breakeven.
If we wanted to generate the greatest initial return, we would look to the selections where I placed the red arrows. The chart below demonstrates such initial returns:
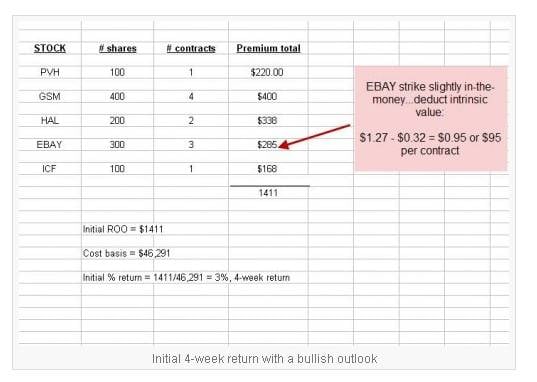
Initial covered call returns
Note that for EBAY the strike was slightly in-the-money so we deduct the intrinsic value from the premium before calculating our initial option return.
Once we have selected our stocks and sold our options and placed them in our portfolio manager (organized lists), we begin the process of managing these positions for possible exit strategy executions. This will not take a lot of our time. There is a learning curve to covered call writing but once mastered, it becomes second nature and a great way to invest and become financially independent for many Blue Collar Investors.
To learn more about our premium reports:
https://www.thebluecollarinvestor.com/membership/
For a FREE copy of the Basic Ellman Calculator click on the “free resources” link at the very top of each of our site web pages.
My Next Speaking Engagement:
March 21, 2013 6:00 pm – 9:00 pm
South Florida Options Trading Meetup
***Because of you, our recent webinar in conjunction with The Money Show was a smashing success with a huge attendance and wonderful feedback. Thanks to all of our members whom participated.
Market tone:
As our stock market reaches an all-time high good news regarding employment took center stage in the past week’s economic reports:
- According to the Labor Department, the unemployment rate declined to 7.7% in February, a post-recession low
- Non-farm payrolls showed 236,000 jobs added in February well above the 171,000 expected
- The average number of jobs added over the past 3 months was 191,000 which economists believe is adequate to result in meaningful decreases in the unemployment rate
- The ISM nonmanufacturing index (an indicator of overall service-sector trends, based on a survey of several hundred purchasing and supply executives in a variety of nonmanufacturing industries. A reading above 50 indicates that the nonmanufacturing economy is generally expanding; below 50, that it is generally declining) increased in February to 56, a 1-year high
- Core capital goods orders rose by 7.2% to a 45.6% annualized growth in the 3 months ended in January, the 2nd highest advance since 1992
- According to the Federal Reserve’s March Beige Book report the economy continued to advance from mid-January to early February driven to a great extent by home sales and construction
- The US trade deficit rose to $44.4 billion, higher than the $42.6 billion anticipated
- 4th quarter GDP rose only 0.1% due to a 1.9% decline in nonfarm business productivity
- Consumer credit (a report of the dollar value of consumer debt, including categories such as credit card use and store charge accounts (known as revolving debt) as well as longer-term loans for autos, education, recreation vehicles, etc. (known as nonrevolving debt). The level of consumer credit is considered a barometer of consumers’ financial health and an indicator of potential spending patterns) rose by $16.2 billion in January
For the week, the S&P 500 rose by 2.2%, for a year-to-date return of 9%, including dividends.
Summary:
IBD: Confirmed uptrend
BCI: This site continues to have a bullish outlook but remains conservative in its investment approach until the “sequester” issue has been addressed. Global, economic and political events can disrupt a bull market even temporarily and so caution is appropriate in the eyes of this investor. As a result, despite our bullish stance we are slightly favoring in-the-money strikes in our investment choices.
Your support and loyalty is greatly appreciated and never overlooked.
My best to all,
Alan ([email protected])


Premium Members,
The Weekly Report for 03-08-13 has been uploaded to the Premium Member website and is available for download.
Also, be sure to check out the latest BCI Training Videos and “Ask Alan” segments. You can view them at The Blue Collar YouTube Channel. For your convenience, the BCI YouTube Channel link is:
http://www.youtube.com/user/BlueCollarInvestor
Best,
Barry and The BCI Team
Alan,
When deciding on strike prices which factor is more important: chart technical analysis or overall market analysis? Thanks for all you do.
Gary
Gary,
Tough question because I consider BOTH important. Generally, overall market movement is the greatest influence on share prices but chart technicals cannot be ignored in my eyes. Since I consider myself a conservative investor, if either general market conditions or chart technicals are mixed to bearish, I will favor in-the-money strikes. This does not necessarily mean ALL ITM strikes but a greater percentage as I oftentimes will “ladder” my strikes.
Alan
Alan,
This week’s stock list has a significant number of choices. Do you find a relationship between the overall market and the number of stocks on the blue collar stock list? thanks a lot.
Bill
Bill,
ABSOLUTELY. We definitely have more eligible cc writing candidates when market conditions are favorable and that is because more stocks are technically sound. We are currently looking into using the premium running list as one of our market indicators.
Excellent point!
Alan
USING THE PREMIUM RUNNING LIST TO LOCATE STOCKS FOR IN-THE-MONEY STRIKES: Recent offsite Q&A:
Alan,
Thanks for helping average guy.
As suggested by BCI currently I have been looking at ITM covered calls but rarely find a strike price which offers any value above downside protection. for e.g. HCA is trading at 37.37. The april 30 call premium is 7.40.( @ mid point)
The profit will be 7.40-7.37 = 0.3 cents.
My question is how to refine my search for good ITM candidates.
Regards,
SK
My response:
This is a GREAT question. Obviously you could run all the calculations but when we have an extensive watch list as we have had recently that would take a bit of time. I would recommend looking at the “beta” column of the running list and run the calculations for all equities that have betas > 1.0. This will save some time as these are more likely to have enough implied volatility to get solid 1-month returns + downside protection. I selected some from the current watch list (randomly, these are NOT necessarily recommendations) and fed the option chain info into the multiple tab of the Ellman Calculator which is shown below (click on image to enlarge and use the back arrow to return to this blog):
Alan
Alan,
What is up with the quirk in the E Calculator? The supplement of the last post is an example where ABG stock price “$” clings to the number. That cell has a different formatting. Am I overlooking something?
ps. do you place many buy-write orders?
thanks,
mike
Mike,
The dollar sign??????????????Any excel experts out there?
In most of my material and in real life I stress legging in for a few reasons:
1- A much better way to teach this strategy to explain both aspects of the trade.
2- Most exit strategies involve using only one leg of the trade.
3- It allows use to leverage the “show or fill rule” when negotiating option prices.
That being said, there is nothing wrong with buy-write combination forms when initiating or closing a trade and it may even result in a lower commission in some cases depending on the brokerage. In my books and DVDs both appropaches are explained in detail.
Alan
i regret if I sounded fu$$y. i have just noticed that quirk doing calculations using The Elliman Calculator.
2, and 3 are very strategic reasons, thanks.
mike