
Covered call writing is a short-term strategy where we sell Weekly or Monthly options to generate cash flow. It is best to use this strategy in sheltered accounts to defer or eliminate tax consequences but that is not always possible. Generally, the income from covered call writing results in short-term capital gains (losses) but there are exceptions to this rule. This article will review a few scenarios regarding long and short-term capital gains relating to long-term holdings (stocks and exchange-traded funds held more than 1 year and 1 day). Let me premise my remarks by stating that I am not a tax expert and the information is based on discussions I’ve had with CPAs who developed the Schedule D of the Elite version of the Ellman calculator (available in the Blue Collar store and free to premium members). Please check with your tax advisor before taking any tax-related actions in your brokerage accounts.
A 1-month option is sold against a long-term holding and is bought back or expires worthless
The information is entered in the blue cells of Code D3 of the Elite version of the Ellman Calculator:

Sell Option/Buy Back Option
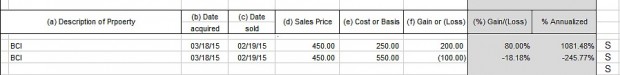
The options are sold for $450.00 per contract on 2/19/17. This is the sale date. Notice that the acquisition dates (3/18/17) are later than the sale dates. If the options expired worthless, the acquisition date would be the expiration date and the cost basis would be $0.00. In the top row, the option is bought back for $250.00 (resulting in a credit) and in the second row for $550.00 (resulting in a debit). Once the blue cells are populated, the white cells on the right side of the spreadsheet will become populated:

Code D3: Selling and Buying Back an Option
Code D3: Close-up View
Notice that the column to the far right (top blue arrow) shows “S” representing short-term capital gains (losses). These returns are stated as dollar amounts, percentiles and annualized percentiles.
A 1-month option is sold against a long-term holding and is exercised resulting in sale of the shares (short-term holding also shown)
The information is entered in the blue cells of Code D2 of the Elite version of the Ellman Calculator:

Code D2: Option Exercised on a Long-Term Holding
The top row reflects shares purchased on 3/18/15 for $45.00 per share representing a long-term holding. The second row reflects shares purchased on 12/19/16 for $69.50 per share resulting in a classification of a short-term holding. Both options were sold on 12/19/16 and were exercised on 1/20/17. Once the blue cells are populated, the white cells on the right side of the spreadsheet will show the calculations:

Option Exercise of Short and Long-Term Holdings
In both cases, the option premium is incorporated into the stock sale. The shares purchased in 2015 (brown row) will result in a long-term capital gain while those bought in 2016 (yellow row) will result in a short-term capital gain. These returns are stated as dollar amounts, percentiles and annualized percentiles.
Discussion
Covered call writing is generally a short-term strategy that will result in short-term capital gains (losses) when trading in non-sheltered accounts. One exception to this rule is when the option is exercised on shares held for more than 1 year and 1 day in which case the resulting profits (losses) are long-term as the option premiums are incorporated into the stock sale.
Next live event
American Association of Individual Investors
Washington DC Chapter
Saturday July 15, 2017
9 AM – 12:00 PM
“Using Stock Options to Buy Stocks at a Discount and to Bring Portfolio Returns to Higher Levels”
Co-presenter: Dr. Eric Wish, Finance Professor, University of Maryland
Market tone
Global stocks declined this week, constrained by rising bond yields. The yield on the US 10-year Treasury note rose 10 basis points on the week to 2.39%, while the price of West Texas Intermediate crude oil declined modestly to $44.50 a barrel from $45.40 a week ago. Volatility, as measured by the Chicago Board Options Exchange Volatility Index (VIX), rose to 11.19 from 10.9 last week. This week’s economic and international news of importance:
- The minutes of the June Federal Open Market Committee meeting show that some members want to begin shrinking the Fed’s nearly $4.5 trillion balance sheet as early as September
- The minutes of the European Central Bank’s June meeting show that officials discussed whether to drop the bank’s promise to increase the pace of its asset purchases if needed to stimulate economic growth. While they refrained from making the change, it is expected they will do so some time in the next few months
- Those small shifts in tone from the central banks helped send yields higher around the globe, particularly in Europe
- Nonfarm payrolls rose a stronger-than-expected 222,000 in June, beating estimates (174,000)
- Upward revisions to April and May payrolls added an additional 47,000 jobs to those previously reported
- Despite the solid employment gains, wage growth remains muted
- The unemployment rate rose 0.1% to 4.4% as jobseekers reentered the labor force
- Leaders of the G-20 countries gathered in Hamburg, Germany this week for a summit amid growing tensions over North Korea’s missile program. On Thursday, Russia blocked a UN Security Council resolution on that would have further isolated North Korea
THE WEEK AHEAD
Mon, July 10th
· China Consumer and wholesale inflation report
Wed, July 12th
· United Kingdom: Employment report
· Eurozone: Industrial production
· Canada: Bank of Canada rate-setting meeting
· United States: Yellen House Financial Services Committee testimony
Thu, July 13th
· United States: Yellen Senate Banking Committee testimony
Fri, July 14th
· United States: Retail sales/Consumer Price Index/industrial production
Summary
IBD: Uptrend under pressure
GMI: 2/6- Buy signal since market close of April 21, 2017
BCI: I am fully invested in the stock portion of my portfolio currently holding an equal number of in-the-money and out-of-the-money strikes. A good jobs report and a rebound in the tech sector on Friday were positives but my defensive portfolio mix remains the same.
WHAT THE BROAD MARKET INDICATORS (S&P 500 AND VIX) ARE TELLING US
The 6-month charts point to a neutral outlook. In the past six months, the S&P 500 was up 7% while the VIX (11.19) moved down by 2.5%.
Much success to all,
Alan and the BCI team


Alan,
I recently read that 90% of option contracts expire worthless. This makes me wonder why anyone would ever buy an option. Is this why you only sell options?
Thanks for all the information you provide to us retail investors.
Marsha
If it were true that 90% of all options expire worthless then it would present an arbitrage opportunity. But that’s not the case.
Contrary to what many web sites suggest, the vast majority of options do not expire worthless. The correct statistic is that 90% of options go unexercised which is very different than expiring worthless. It should also be noted that this says nothing about profitability.
Stats provided by the CBOE are that:
1) About 10% of options are exercised (gain or loss)
2) About 60% are closed before expiration
3) About 30% expire worthless
What is true is that the preponderance of options remaining open at expiration expire worthless
Very well stated by Spindr0 and it highlights how many myths there are out there that must be debunked. For more:
https://www.thebluecollarinvestor.com/percentage-of-options-expiring-worthless-debunking-a-myth/
Alan
Alan,
That’s a nice thorough explanation (your link) of the myth about 90% of options expiring worthless thereby giving a seller an advantage. I may have to plagiarize it for my next book (just kidding 🙂
For option tax info, see page 60 of the IRS Publication 550. Some of it is quite confusing but the buying and selling of puts and calls is pretty straightforward. A good source of tax info with translation is:
https://greentradertax.com/tax-treatment-for-trading-options/
Spindr0:
Excellent article at GreenTrades. Tests your knowledge of principles and option terminology.
I did review my broker 1099Bs in detail (first year with options). Used Turbotax Business. As i recall, for some of the written (sold STO) options that were exercised the option cost was merged into the underlying cost basis. If a dividend was received, they adjusted the cost basis of the underlying (I know this for sure) . As long as I ended up with right gain/loss I was satisfied.
I can drastically see how the picture gets complicated if you do collars and offsetting hedging or repair trades. How do you keep it all straight at the end of the year?
Mario G.
mario,
I don’t know about Turbotax but the majority of these general usage tax programs do not properly deal with the many issues that arise for investors and traders. It doesn’t matter if the accounting merges the numbers or not as long as the trade info doesn’t involve a wash sale. 2+2 = 1+3 so ending with +4 is fine even if it doesn’t meet the laborious methodology the gubbermint wants you to use to get to +4 ;->)
Pardon the long answer to your question. I scale in and out of positions. In 2008 and 2009 I went wild (profitably). In January of ’08 I spent weeks trying to properly reconcile the wash trades. I’m no stranger to math or spreadsheets but despite that, I gave up in frustration because it’s just a a boondoggle. For example, scaling in and out with 20 trades in one stock can turn into 50 lines on the 8949 form. Imagine the precision needed, without error, to prorate the wash sale carryover to each subsequent partial trade? I shoulda been an accountant!
The short answer? I use a program called Tradelog which handles all of this almost flawlessly. Almost, meaning you have to make a few inputs for situations like stock splits where the number of shares don’t match EOY. No biggie. They offer several subscription levels based on the number of trades made and the highest level is unlimited trdes. There’s a new owner but I assume nothing has changed. Gainskeeper is another investor tax accounting program. I have heard good things about it but I know nothing more than that.
Hey friends, happy weekend and happy July to all!
From a seasonality standpoint the first week of July did not live up to averages. Not sure if that means anything other than just stay cautious.
In my opinion in a market with this kind of daily volatility if you have a covered call stock buy in mind buy it on a down day dip. Then wait for it to bounce before selling your call. Don’t do it same ticket. – Jay
To all:
Back to the Broker commissions issue:
I have mentioned before I trade at Fidelity and Optionshouse.
Fidelity:
At Fidelity I enter my CC with a Buy/Write and Debit limit. If a position gaps up, I have explained that when I see a Time Value of 0.1% to 0.2% of my Cost Basis, I unwind the position with a reversing buy-write (BTC, Sell Underlying). In all cases, Fidelity considers this as 1 ticket and get charged the basic trading fee of $4.95 plus Option contract fee ($0.65) plus a small activity assessment fee.
Optionshouse:
For the same Buy-Write transactions, Optionshouse does not consider the trades as one ticket and I am getting charged $4.95 for the underlying and another $4.95 for the option plus the $0.50 per contract plus the activity assessment fees (on a sell).
This fee difference can amount to $2400 per year for me.
What is the practice at other Brokerage House?
At Fidelity and OptionsHouse:
When doing Rolls only or Option Contracts only, the fee for both Brokerages is just one ticket ($4.95).
Mario,
The best commission schedule depends on the nature of your trading.
If you trade larger blocks of shares, you’d be better off at a fixed fee broker like Tradeking or OptionsHouse @ $4.95 per trade.
If you trade small lots, you’re better off at a flat fee like Interactive Brokers who charges 50 cents per 100 shares and 70 cents per option contract (plus exchange fees) with a minimum ticket charge of $1. Even less if closing out 5 cent or less contracts. Assignment and exercise are free. Another advantage is that is that if you want to scale in and out of positions. At 50 cents per 100 shares, five trades of 200 shares is the same $5 commission as one trade of 1,000 shares.
A competitive newcomer is Tastytrade who charges $1 per contract for an opening trade, $5 for an opening stock trade (unlimited shares) and all closing trades have no commission but include clearing fees (10 cents per contract and $0.0008 per share).
The short answer? It depends.
Good morning S and Mario,
Hope you guys are having a nice weekend!
Mario, I am staying with Options House even though e-Trade has bought them. I have received assurance my grandfathered $3.95 rate for any size equity trade and no commission to buy back short interests below 10 cents value will still apply. You bring up an interesting point I did not realize at OH on buy/writes but I never do them same ticket since the market is not linear and I always figure I can get better overall pricing buying on down days and selling calls on up days. But that is just my opinion and tactic. It is easier to manage if you do it simultaneously.
S, TastyTrade is a tasty alternative if you pardon the terrible pun :). Tom Sosnoff is behind that. He designed Think or Swim, took it public then sold it to TD Ameritrade. I am hoping what he does drives others in the business to reduce rates and we all benefit.
You and Mario along with Geoff, Roni and others are real pros at this stuff even if you say modestly you are just retail investors!
But this is a great community where everyone is welcome to join the conversation. From the increasing number of posts I hope more folks feel less bashful every week. Come on in, the water is fine :).
The tax discussion makes my head spin. I only trade in my IRA’s. In cash accounts I just hold investments and when I get dividends that is easy to reconcile.
Alan and Barry close your ears for this :). I noticed the market has been having a series of up and down days, particularly in QQQ. Someone let the computers loose to do their thing :). I can never compete with them. But for fun I have been buying a couple one week out ITM calls on the down days and a couple ITM puts on the up days. I have a couple puts open at the $140 QQQ strike for Friday. It’s just trading for the heck of it with a pittance. But it has paid for nice dinners, a new grill, new patio furniture, etc..! Jay
Hey Jay,
Since you only trade in your IRA accounts, please move onto the next post (g).
If you sell a position in a non sheltered account for a loss and you buy them back within the 30 day window on either side of the sale date, you have a wash sale violation and you cannot deduct the loss. It is added to the new purchase price, creating a higher cost basis. You don’t lose the deduction. It’s just carried forward until the other trade is closed.
However, if you sell shares in a non-retirement account and you buy substantially identical shares in an IRA within 30 days on either side of that date (60 day window), it triggers the Wash Sale Rule and you cannot claim the tax losses for the sale and the basis in the IRA position is not increased. Don’t ya just love the IRS? Wash sale complications can be avoided by applying for MTM Professional Trader status but that’s only for the frequent flier big guys. The everyday Joe gets screwed.
As for the commission stuff, I think that tastytrade is affecting other brokers. A number of my friends and colleagues have negotiated lower commission rates by threatening to move their account elsewhere. If your account is large enough for them to care, it might save you a few bucks. The worst that can happen is that they say no.
Spin
Spin,
It is fantastic to have you here. I have learned a lot from you since you joined our community!
Options House gave me several direct phone calls after the e-Trade take over to assure me of commission schedules and a seamless transition to keep my business. I hope Tom Sosnoff at Tasty trade scares the s— out of the online discount brokerage business!
A long time ago in a galaxy far away I was a retail broker at Merrill Lynch. If you wanted to buy or sell something you had to call me or I had to call you, I would write an order ticket by hand and put it in a vacume tube like at today’s drive through bank. It would get whisked away to the trading floor. I would later get a trade confirm back to journal entry in my order book by hand on your account page.
Meanwhile the Civil War was raging and Lincoln was President. Just kidding. But I was at Merrill in the mid 80’s and that is how it was and felt compared to today. So keep investing in Tech! – Jay
I did not last long in that business. I moved on but will always remember the experiences, training and learning. And the commissions back then were outrageous! – Jay
Jay,
Thanks for the kind words. 30+ years ago when Al Gore invented the internet, I had the good luck to benefit from some experienced retail ‘optioneers’ who shared their knowledge freely. When I was on Prodigy in the early 90’s, one among many was Mark Wolfinger who I think was a floor trader (options), has written some books and currently runs a blog. So while it may sound a bit corny, maybe I’m just paying some of that forward.
Not only did I have a Merrill account back in the day but I got some great IPOs from them Boston Chicken. Callaway Golf. Callaway was a gem. IPO price of $20 and I sold at $37+ 15 minutes into trading. Only 200 shares but that’s a pay day! I was a bit of an IPO whore in the go-go internet 90’s. I remember the days you mentioned where you had to get your broker on the phone AND pay a horse sized commission to trade. Where than ran amok was Black Monday in ’87 when you couldn’t get through to your broker and couldn’t do anything with your positions. I had an account at Paine Webber and it felt like they had merged with Shearson. It was Shear Paine! (sorry for that). I had a covered call position on Bear Stearns that had expired ITM on Black Friday (expiration day) and due to the massive systemic disruption from the crash, they couldn’t tell me for 6 trading days if I had been assigned or not. Today’s young investors and traders have no clue how hard it was when you voted for Lincoln!
Spin.
Don’t shrug it off as an easy decision voting for Lincoln. Douglass made a lot of good points. I wrestled with that one, My horse was sick that week so we did not get to go vote many times in many places like we always did :)! – Jay
Jay,
In those daze (sic), did you submit your Merrill purchase and sale orders via the Pony Express?
Spin,
Thanks for getting the Lincoln joke 🙂
My significant other tells me my humor is an acquired taste few get at first 🙂 But you seemed to pick up on it quickly. The Pony Express was on strike over the price of oats back then so i was just s— out of luck any way you looked at it :)! – Jay
Jay,
In my experience, humor is an acquired taste for those who are a bit short on it. Those who get it, usually have it, particularly the kind where you have to connect the dots (and no, I’m not referring to those with crayons :->)
Alan,
I am reading your Encyclopedia and learning a lot. In the technical analysis chapter you favor the 20 and 100 day exponential moving averages. I have always read that the 50 and 200 day simple moving averages are best for stock analysis. Can you explain why the difference?
Thanks a lot.
Eric
Eric,
The 50 day and 200 day SMAs are MAs that are used by institutions and tend to fit buy and hold strategies. BCI uses the 20 day and 100 day EMAs because they are shorter term focused and are a better fit to covered call trading. The EMAs give greater weight to more recent pricing while SMAs give equal weight to all prices.
The 20 day EMA represents approximately a trading month while the 100 day EMA is bit longer than a quarter of trading. These time frames fit the BCI methodology more closely.
Best,
Barry
Barry,
What time frame or Multiple time frames should you use when looking at the chart with the 20/200 Ema averages. 1 month, 3 month? Do you consistently use the same time frame in your weekly report analysis? Is it subjective so different persons have reason to use other time frames??
It seems to give me different results depending on the setting.
Mario G.
I don’t mean to step on anyone’s toes but here goes anyway. Moving averages depict the past. They predict nothing. They help to identify trend as well as support and resistance. MAs are a lagging indicator. Simple MAs lend equal weight to all data so they lag more than EMAs which lend more weight to more recent data and are therefore more responsive to price change. The longer the period that you use in the MA (say 200 days), the later your signals will be -> In late, out late. The shorter the period used, the more timely the signal will be but the more whipsaws that you will experience. And as you noticed, if you change to length of the MA and/or the periodicity of it (# of days) it gives you different results.
MAs provide useful information but make sure that you understand what that information means. If you combine several MAs (such as the MACD), you’ll find that there are other complications such as potential false signals which must understood to avoid those traps. For a comprehensive understanding of MACD, read Gerald Appel’s book(s) – he’s the creator of MACD.
Spin,
You nailed it on the charts. They are lagging indicators. You can’t draw a chart until you have data and you can’t have data until it has happened. I have been on a Quixotic quest for a leading indicator for as long as I have followed the market.
I finally concluded the best one resides in our brains. It is called “intuition”. When intuition is fed by historic data it knows people behave in predictable ways and can often – not every time – see their next move coming :). – Jay
Jay,
I spent a lot of time in the early 90’s with some really bright people investigating TA. Here’s my two cents and at that rate, you may still be overpaying. No indicator is going to guarantee success. Many of these indicators are based on MAs so if you look at several of them so based, they may be giving you redundant information, reinforcing the same bias.
And then there’s the math. The silliest example is all of the ado about the Williams % Indicator which Larry Williiams has written several books about. It’s simply an inverted Stochastic.
If you delve into the math construction of each indicator, you’ll realize other things. For example, if the MACD turns up when below zero, it may or it may not be a valid buy signal but a turn up above zero has to be valid (and conversely above zero turning down). Whether it lasts and leads to anything is another story.
And then there’s the periodicity issue. Use a shorter term Stochastic and if above 80, it indicates overbought. Lengthen the number of days and it’s short of overbought, below 80. Now which signal (or lack thereof) is actionable?
Don’t get me wrong. I like Bollinger Bands. I like Point & Figure to remove the noise and depict short, medium and long term support and resistance. All indicators provide information but it’s the “mantuition” processing that figures it out. You cobble together a set of them into a system and if you diligently follow them, you start to achieve a more systematic approach to taking and exiting positions. But always remember that news trumps the best TA in the world. So make sure to practice good risk management when the sh*t hits the fan rather than being a deer in the headlights on the tracks at the mouth of the tunnel :->)
Spin.
The worst part about your posts is they come to an end. I could read them all day long :)! I stole that compliment from a musician who was paying tribute to Gordon Lightfoot. He hated when Gordon’s songs ended because there was something soothing in his every lyric: surely they could just go on forever :)?
For us retail hobbyists who don’t have command of every technical indicator, 5 big screen computers in our home office and the time or smarts to devote to this stuff we hate to just buy and hold. But but don’t want to be crushed again like in 08/09 either.
No one ever went broke taking profits or owning index funds above their 200 day moving average. So as a minimum use that as a line in the sand. SPY is 7% above it’s 200 day. A bullish sign. If you do anything sell strength this month and buy the weakness that almost always occurs in late August and September.
My significant other loves sales. She hunts them out for clothes. But not for stocks. She wants to buy clothes when they are cheap and stocks when they are expensive. She has the credit card but I have the mouse so we strike amicable truce :). – Jay
Jay,
If you’re mesmerized by my posts then you’re a glutton for punishment :).
I’m not an expert on anything and I don’t make any claim that my is the right way or the best way. There are many ways to skin the cat and anything I suggest is just what I have come to find to work and not work for me. If you do it long enough and pay attention and learn as best you can from your mistakes, it gets to be a bit of a routine. As for all of the indicators, they are indeed a line in the sand, aka a reference point. As for 08/09, I crushed it then but I’m not here to discuss that. All I’d suggest is that you devote equal attention to risk management. It makes no sense to work hard, save, invest, accumulate and then let the vagaries of Mr. Market rip it away. Some say that winter is coming. At some point it will arrive. Ask your significant other to help you find some appropriate sales if it comes :->)
Spin,
Mesmerized would not be the word I would choose. Impressed serves better :)! I very much enjoy your contributions here.
I am glad you joined us. I enjoy your every writing.
I bought a few ITM QQQ puts at the close today just on the hunch traders will take back the gains tomorrow. I am overall long July and only sold covered calls on GLD since I figured it might go down. So far so good. I sold a bunch of OTM cash secured puts on thing I like and those are turning into nice income trades.
This can be argued many ways. These next sentences will not give either fine strategy the justice they deserve. So please let me apologize in advance lest I step on anyone’s toes!
In my simplistic opinion covered calls are bearish though they certainly need not be when sold OTM with bullish room for the under lying and/or ladder your strikes managing the trades with exit strategies and buy back//rolls. Cash secured puts are bullish. Just be sure to sell them far enough out of the money that you would be OK buying at the sold strike.
I have 5 sold put contracts on QQQ at 136 for July expiry. I would be be perfectly happy adding 500 shares at that price. My hunch is I will not have to. I will just keep the income. Point is I am OK either way. Please never sell a cash secured put unless you feel that way. – Jay
Jay,
Don’t apologize for your opinion. Be open to the possibility that it may be wrong and if presented with information that suggests that it is, be willing to adjust accordingly. We know what we know but all of us do not know what we don’t know. You’ll know what that is when you stumble across it. And don’t worry about my toes – I have steel tipped boots (g).
Covered calls (CCs) and cash secured short puts (CSPs) with the same terms (strike and expiration) are synthetically equivalent. That means that they yield similar results. If anyone isn’t clear why this is so, ask away.
Since people tend to sell OTM calls, it’s considered a neutral to mildly bullish strategy (the same terms ITM put would be the synthetic). However, using a different strike price alters the risk profile. If one was somewhat bearish, one could sell a somewhat ITM call. If very bearish, I’d sell the stock but in line with this explanation, one would sell a deeper ITM call.
I’m not a big fan of CCs and CSPs because of their imbalanced R/R ratio. If you look at it as a binary choice of (A) or (B), then either position fares better to the downside than the outright share owner. If you think that you’d prefer a better R/R ratio then you have to consider (C) or (D) or … Such choices might be the Poor Man’s Covered Call, Collars, and Spreads. Collars are synthetically equivalent to Vertical Spreads (ask away if you wonder why) and they involve less risk, far less margin, a higher ROI but a lower total credit premium – there are always R/R trade offs choices involved.
There’s no ‘best strategy”. You find a stock that you like (or for that matter dislike if you like the short side), determine your outlook for it (hope?) as well as risk tolerance and then you select the option strategy that best fits that outlook and provides an acceptable R/R profile.
Good luck with your GLD position. I’m currently short one higher priced gold stock and long some of its Aug ATM puts as well as long three lower priced gold stocks. I don’t really care that much which direction it goes as long as it goes somewhere, like they did today (volatility). It’s a multiple legged Pairs Trade… Don’t ask :->)
Premium Members,
This week’s Weekly Stock Screen And Watch List has been uploaded to The Blue Collar Investor premium member site and is available for download in the “Reports” section. Look for the report dated 07/07/17.
Also, be sure to check out the latest BCI Training Videos and “Ask Alan” segments. You can view them at The Blue Collar YouTube Channel. For your
convenience, the link to the BCI YouTube Channel is:
http://www.youtube.com/user/BlueCollarInvestor
By the way, I’m happy to report that I survived the 2017 NJ Rugged Maniac Race…it was a 5K with 25 obstacles and more mud than the Amazon jungle. I’m still tasting mud!
Also, as a reminder, the report for next week will arrive on Monday. I will be with Alan at the Washington DC Area next weekend helping Alan with his seminar for AAII members.
Best,
Barry and The Blue Collar Investor Team
[email protected]
Congrats Barry! Are you anywhere in the video here?
https://www.youtube.com/watch?v=nv38eF2JXDQ
It’s rare to see a group of Americans these days where
the majority aren’t clinically obese – “your health is your
greatest wealth”.
Justin
Hey Justin,
The video is a promotional video. I’ve atteched a pic of me at the finish. That red t-shirt came down to my waist at the start of the race but the mud added a lot of weight and stretched it!
I think I was the oldest person to compete on Saturday…but I finished…without too much wear and tear. Net/net, it was a great event. now that I know what to expect, I’ll train differently for it next year.
Best,
Barry
Nice shot Barry – that could be your new profile pic! Hopefully you didn’t need to use public transport to get home… 🙂 Perhaps you
can drag Alan along next time – he is a former health professional
after all. Personally I take regular 5-6 hour hikes which are also
good for getting away from the city air for a while.
Justin
Technical analysis:
There is no one technical indicator that is so accurate we should hang our hats on it. Technical analysis is as much an art as it is a science. It should be viewed as a mosaic of multiple indicators painting a picture that will then represent one of several screen in determining whether a security represents an eligible underlying for our option-selling strategies.
In the BCI methodology, we use 20-d and 100-d exponential moving averages, MACD histogram, the stochastic oscillator and volume to paint the mosaic. These are the parameters where I have found the greatest success over the past two decades as it relates to these strategies. They certainly aren’t the only indicators that can lead to success and those who prefer others should employ them. If we get 100 chartists in a room and ask for preferences there is sure to be dozens of opinions with no right or wrong.
The takeaway here is that technical analysis is a critical part of our screening process and there are a multiplicity of parameters available to enhance our investment success.
Alan
Alan,
I’ve had consistent success with AMAT for the past 5 months (more than 2% per month) since it appeared on your list but in June it took a downturn but recently headed back up again. Is this a stock you would take a bullish position, defensive position or remove from my portfolio for the next contract?
Thanks,
Art
Art,
Based on emails I have received from members, you are not alone in having this security in your portfolio for the past several months.
It’s too early to make a decision regarding this stock moving forward from the July contracts. Let’s see what the chart looks like as expiration of the July contracts approach. Most importantly though, we must keep an eye on the projected 8/17 earnings report. This stock does have Weekly options which can be used to circumnavigate around the report.
Keep up the good work.
Alan
Alan,
I continue to back-test and live trade CCs to help master the skills to succeed.
I have a question about your 12/18/15 (yes, 2015) weekly update.
In the weekly update section you state, “Cautiously bullish but remaining defensive selling 50% ITM strikes and deeper OTM puts until clarity with market reaxction to fed rate hike.”
Do you mean 50% ITM and deeper OTM put? or 50% ITM and deeper OTM call?
I have a copy our your book, Selling Cash-Secured Puts and I will look there too for the answer.
Thanks,
John
John,
When I take a defensive posture in my portfolios, I use a higher percentage of ITM call strikes and deeper OTM puts. In the former, intrinsic value protects time value of the premiums and in the latter, the breakeven is at a lower price.
Alan
John,
Let me clarify further Alan’s response to you in regards to your question on Cautiosly Bullish with 50% ITM and deeper OTM puts. I am sure he will remark if I am incorrect in any way.
I do have his two books Classic Encyclopedia and the Cash Secured books.
With regards to 50% I interpret that to mean his division of positions is:
A, 50% ITM calls or deeper OTM Puts (any combination of thsse two to make the 50% of your account)
*** A1. ITM calls have downside protection from the purchase price to the Strike.
*** A2. OTM Puts have downside protection as well from the Price of the Underlying stock (you don’t purchase the stock when you sell the option, but you know the price when you made the Cash Secured Put trade). By deeper he means he selects a lower strike so the downside to the strike is larger. This is cautious because the stock has to fall further before your ROO% is affected. Of course when you do that, there is less ROO% gain but that is OK since we are being cautious. The ROO% would normally be 2-4% but when going deeper may be 1-2%.
The break even point is the Strike – the Premium.
B. 50% OTM call
*** B1. Half of his trades are OTM Calls because he is still bullish. The OTM calls have in addition to the initial ROO% at trade time and Upside potential to the Strike when the stock hopefully rises during the cycle. The total gain for an OTM call is greater than the ITM call and you get that gain by sacrificing the Downside Protection, which does not exist with an OTM Call. .
Hope this helps.
Mario G.
In a different venue today I discussed the market with other friends. I was fully disclosed: I said I was long, have an S&P target of 2500 in mind in the coming weeks but am worried about the late summer and early fall due to seasonality patterns.
That group is not keen on options. I am not keen on Missionary work. So, like the Beatles, I “Let it be” :)!
I have made mistakes in the past preaching options to reluctant friends. You have to let them come to you when ready :)!
But I hope those friends and I do not suffer group think because we are all bullish the market for July! – Jay
Alan or Barry,
Re MDSO, how often is it that earningswhispers.com gets it wrong like that with the earnings date, changing from July 26 to July 18 and thus going from after the monthly contract expiry to just before?
Currently it’s 8.3% above my $75 strike price so I figure I’m best off hanging on and riding out the E.R.
Justin
Reporting sites occasionally get the date wrong. Sometimes it’s because the company changed the earnings announcement date.
Justin,
This issue comes up from time to time. We use a number of sites to determine ER dates. Historically, EarningsWhispers.com has been the most consistantly accurate. Their site also indicates when an ER date is confirmed. When this occurs, we indicate the confirmation by bolding the date in red on the Weekly Report.
I would estimate that EarningsWhispers is over 95% accurate in their reporting. When preparing the report each week, we review the ER date for every stock on the list (both in the white section as well as the pink section) and provide the most current date. For the times when EarningsWhispers shows an inconsistent date, we use the following sources to attempt to find the best estimate of the ER date:
– CBOE
– Yahoo
– NASDAQ
– Schwab research
– FinViz
– Company website news and PR page
– Phone call to company CFO
Since the ER date “rule” is foundational to the BCI methodology, we make every possible effort to get the most accurate information. Historically, there have been times when a company changes the ER date and that change does not appear in our primary sources.
I hope this answers your question. Please get back to me if you would like to discuss this further.
Best,
Barry
[email protected]
Thanks Spin and Barry – obviously from your reply Barry it would be fairly rare for the combo of wrong date and wrong side of contract expiry. There’s obviously some experienced traders posting here – would anyone think about doing some sort of hedging trade in this situation?
Justin
Justin,
Two more reliable web sites for earnings are Zacks and Briefing.com
https://www.zacks.com/earnings/earnings-calendar
http://hosting.briefing.com/cschwab/Calendars/EarningsCalendar5Weeks.htm
Ask for the hedging question, there are a variety of ways to hedge and they have different costs and degree of protection (covered calls, long puts, collars, etc.). So it depends on what you have in mind. Earlier today John asked about the 12/19/15 article and by coincidence, it was a hedging article (Collars). I’d walk you through some of it but you’d have to spell out more details to do that.
Spin
Hey Justin,
I am not sure whether this analogy will be helpful but a long time ago when I was in the US Army in land navigation training they taught us to go back to the last place where we knew where we were if we felt a bit lost and start over.
I do not follow MDSO but it sounds like it has been a good stock. They moved the goal post on you with the earnings date. But your $75 covered call will likely be a successful trade regardless. I obviously don’t know your basis, how that is taxed and all of that stuff. So if we just reduce this to basics and back track it if you knew the ER was coming out in this July expiry would you have still held the stock and just waited to cover it?
If so you are bullish the stock. Has any of your research since changed that opinion?. If not and since you only have a bit over $6 a share at today’s close of intrinsic value and a little bit of time value to buy back I would buy back your $75 calls on any weakness between now and the 18th, hold it through earnings and go from there. Regardless I hope it works for you either way. There are certainly tougher jams to be in :)!
You could certainly buy some calls for next Friday to hedge the ones you sold. But if you like the stock and have no reason to suspect a downsize earnings surprise I think just spending the money to go back to an uncovered equity position and wait out the ER is best. – Jay
Jay,
“When I was in the US Army in land navigation training they taught us to go back to the last place where we knew where we were if we felt a bit lost and start over.”
Did you walk in circles a lot? :->)
MDSO is a high implied volatility stock so buying the short call back early still costs some decent time premium. And any kind of put protection will also cost. The intrinsic value provides about 6+ dollars of hedging. If there’s concern that the stock could fall more than that, take whatever gain you have by closing the position. Get out of Dodge City.
I’m a bit confused by everyone’s concern with the EA. If one felt that the stock was going to rise significantly from it then you wouldn’t want the encumbrance of the short call. But if you’re writing covered calls (an income strategy), that’s not relevant. And I don’t follow why you’d “buy some calls for next Friday to hedge the ones you sold.” That might work for the upside opportunity loss but it does nothing for the imbalanced downside risk that a covered call writer faces. Color me confused…
Spin,
I still walk in circles all the time 🙂
My suggestions to Justin were based on the fact he got some bad info from his stock about when they would report earnings and is concerned about having a covered call in place when those earnings come out on the 18th.
I should have been more clear since, you are right, the off handed suggestion Justin buy some calls only compounds his downside if his stock tanks after earnings. The idea was that if he did not want to unwind his covered call before earnings, knows it will be called at current price levels but would like to at least get a bump if his stock has a good earnings event then buying some calls was an idea.
My core suggestion was to either let the trade stand or buy the call back on any opportunity if the stock shows weakness before earnings.
It sounded like Justin’s main concern was he is holding a covered call with an earnings report through no fault of his own since they jerked him around a bit on the dates.
Your point on the ER/EA events is well taken. But since they can create volatility many covered call writers avoid them so as not to limit their upside on good news. When things go down we all wish we had sold covered calls for the protection :). – Jay
Jay,
PS: Regarding your time in the army, thank you for your service! I have the utmost respect for veterans, even if they are covered call sellers :->)
I appreciate your kind sentiment Spin. I would do it all over again. ROTC paid for college and the friends I made serving are the ones I stay closest with today. The experience I got helped me immensely in industry. I was fortunate to have been in during peaceful years.But many friends who made careers of it served multiple deployments. Those are the guys I tip my hat to! – Jay
Thanks Jay, it’s not a big deal – only 200 shares and 2 contracts, so it’s more of an intellectual exercise than anything. My primary reasons for the MDSO CC was that it had a bullish chart, was on the BCI list, and was offering a 3.1% monthly return with 4.3% downside protection of that profit. Also I didn’t have to worry about the ER since that wasn’t until after the contract expiry 😛
I don’t have any great insights into MDSO itself so the aim was to divest myself of it at the end of the July contract. Thus I was thinking that maybe hedging the entire CC position by buying a put option on maybe the 75’s or 80’s might be the way to go (if the price is right) in late trade Monday (seems MDSO’s ER is at 6:10 a.m. Tuesday.) Or of course I may be able to buy back the options at a decent price late Monday, so it will be interesting to see what’s available then.
Justin
Thanks Justin, our notes just crossed, I had not read yours before I replied to Spin. Hopefully all of this makes collective sense when read as a conversation :)?
Glad it is a small position however you decide to manage it. I think “Trade small and trade often” is a great motto :)! – Jay
Looks like we were all typing our posts at the same time!
Jay and Spin, my big concern is the same one that Alan has often pointed out, that my upside is limited (3.1% in this case) while my downside is huge – I note that MDSO fell nearly 25% after a bad ER in 2016 for instance, which isn’t such an unusual occurrence in stocks generally. So I have to try and calculate the odds and possible size of a big fall and what that’ll cost me to decide if my best bet is to just hold and ride out the ER – as Spin points out I have a substantial cushion currently which could well mean that my smartest play is to do nothing. I should have better info of course late on Monday so I’ll wait until at least then.
“Trade small and trade often” – isn’t that the TastyTrade motto Jay? 🙂 Actually I’m just trading relatively small since I’m only in the early stages of ramping up the amount of capital I’m committing to CC’s, and intend to commit a lot more as my experience (and hopefully profits) grow.
Justin
Justin,
Covered call writing is a bird in the hand income approach. In return for ceding the upside, you receive a call premium that is yours to keep, regardless f what happens with the underlying. That premium lowers your cost basis as well as your standard deviation. It works well in neutral to mildly bullish/bearish markets but very poorly in a a bear. Use them if you’re looking for income. Avoid them if looking for growth, unless you sell deep OTM low delta calls (perhaps ). They’ll also give you more SWAN if you start scaling up your position size as you progress and accumulate more.
Spin
Hi Justin,
the experts have given the answer and debated your MDSO question, but I would like to add my tip.
This happened to me many times.
Just a few days ago I got the same situation with PYPL and SWKS.
The BCI guidelines are clear. Earnigs reports are a huge risk.
So, take your profit and get out of MDSO.
Use the cash to enter a new trade on a better ticker.
You may regret the missed opportunity on MDSO, but you will avoid a possible big loss (Which is much worse).
Btw that’s what I did with my PYPL trade. I am still holding my SWKS shares, with my finger on the trigger, and will not take it through earnings. (I had already bought back the CC for 20% of the premium when the stock dropped sharply in the first half of the option cycle, and was hoping for a double, when they changed the ER date).
We must trust the BCI methodology. It works fine if you do.
Roni
Spin,
Absolutely, I’m in the CC’s for income, not growth 🙂 Btw what is this SWAN you mention?
Roni,
Interesting you say the ER moves happen to you often, since I was assuming they were a rarity. However PYPL looks ok with a date of July 26? And SWKS actually looks ok too – their ER isn’t until after COB next Thurs, and already there appears to be very little time value left in the options, unlike MDSO.
Justin
Justin,
Sorry about that. Sometimes when I speak the pitter patter, I incorrectly assume that everyone knows WTH I’m taliking about, sometimes even me as well :->) . So my bad. SWAN = Sleep Well At Night
MDSO options are expensive because
1) Normally, they have about twice the implied volatility than SWKS options, and
2) The nearest SWKS that expires after the ER has inflated about 50% whereas for MDSO, they have doubled so loosely speaking, MDSO has about 4X the time premium that SWKS does. Good for sellers, bad for buyers, unless doing both.
For those concerned with ER-s, you might consider collaring the stock for the ER so that you manage the risk, rather than bouncing in and out of positions. Now this might be getting a bit too deep into the weeds but if you’re selling weekly options, if you make the leap into collaring, then you might consider diagonalizing it at no cost. The ER inflates the earliest expiration after the ER the most. That means that relatively speaking, the following week is cheaper. Post EA, if the stock craters, you have some loss down to the long protective put strike but you are protected below that. If it rockets up, you are assigned and you book your profit. If it goes nowhere, next week’s long put can be kept for protection or you might be able to cash it in for some salvage value, enhancing your yield. You have to work the numbers to see if this is appealing or not.
Thanks Spin for clearing that up, now I see that if I want to SWAN, I should trade like a CHICKEN 🙂 Which is good because all my CC trades for this month were ITM, apart from CTRL which was slightly OTM. I’d probably do better at this whole Swan thing though if the US market didn’t open at 11:30 pm my time – sometimes I just stay up late for a while, other times I get up for an hour or two in the middle of the night to keep tabs on things. Actually right now I’d love all my contracts to just expire,
since they’re showing me my max. possible profit of 3.7%.
Re MDSO weeklies, they don’t appear to have any so I guess my choices are still hold on, buy back or buy puts – thanks for that though as it could be useful info in similar future situations.
Justin
Justin,
Instead of trading like a CHICKEN, you should pretend that you are at the zoo and buy SHEEP and sell DEER. And as for the market opening at 11:30 PM time, you could solve that by setting your clock 10 hours ahead so that you could be trading at the same time we do :->)
MDSO does not offer weeklies. You can Google the complete list if need be.
Here’s an inaccurate guesstimate of the diagonal suggestion for AKAM which has an ER on 7/25. I say inaccurate because the quotes at this time of the AM are last trade so the B/A is not reflected. AKAM closed at $50.08. Randomly picking some strikes, if I wanted an approximately 5% collar, I’d sell the 7/28 $53 call for $1.44 and use the proceeds to buy a put for close to that amount. What’s available?
7/28 $53.0c $1.44
7/28 47.5p $ 1.43
8/04 47.5p $ 1.51
8/11 47.5p $ 1.53
8/18 47.5p $ 1.66
8/25 47.5p $ 1.69
If you do the collar with both legs for 7/28 (one cent credit), everything expires that day. If you go out a week at a time, each successive collar costs 7, 9, 22 and 25 cents. There are a myriad of possibilities but let’s just look at one. You sell the 7/28 $53c for $1.44 and you buy the 8/25 $47.5p for $1.69 (a debit of 25 cents). If AKAM finishes b/t the strikes, the call expires worthless and you own the $47.5 put for 25 cents which expires 4 weeks later. If there is any salvage value, you can cash it in to get back part of that 25 cent debit or you can hold onto it and be protected for another month. yes, you gave up that call premium but in return, you still had the opportunity to be assigned at $53 without the chance of AKAM dropping 10 points and taking more than $3 away from you.
Again, real time won’t look this pretty when you factor in B/A spreads so you may have to shift the put strike down 50 cents to get close to no cost for the collar. The important point is that you can take advantage of the ER induced inflation of near term premium in your positioning and this also demonstrates the flexibility that options give you.
OK, mike drop before being thrown off stage :->)
I’m rather wary of these weeklies Spin – I looked at a bunch before and found minimal OI and lots of big spreads; also I read some complaints somewhere that the market makers were taking advantage of the traders somehow or other, I don’t remember how. So I’ve decided to keep it simple at least for the time being and stay with the CC’s for now – how are the weeklies treating you?
Justin
Justin,
Let me frame my answer in the context of a covered call writer.
Shorter term options offer a higher ROI and decay faster but they offer less premium and therefore less downside protection. So the question is, does a near term weekly offer enough of each? If not, you go out a week at a time until you find one that provides enough premium, ROI and downside protection to suit you. That price could be a weekly, it could be a monthly. The sweet spot for time decay is 30-45 days so going out further than that provides less theta (time decay) and a lower ROI. It’s not a question of one being better than the other but which one is best for your fear and greed (risk tolerance and profit objective).
Conventional wisdom suggests avoiding options with low OI and wide B/A spreads. I see at it differently. Writing a CC is a transactional event where the strike price plus premium provides an acceptable sale price. If you don’t want to sell at that price pick a higher strike. If you don’t want to sell your stock at all, don’t monkey around with CCs.
If the bid of the call that you are willing to sell offers an acceptable premium, does it matter to you if the spread is 5 cents wide or 50 cent wide? Does it matter if the OI is 2 or 100? Either way you contract for an acceptable sale price. The only way the B/A spread an OI is going to bite you is if something changes and you want to cover the short call. So my question is, if the current bid is acceptable, are you going to avoid selling the call because you might change your mind? If yes, then avoid wide B/A spreads and low OI. If it’s a buy and hold unless assigned position, sell that call.
Let’s project this to weekies. If the bid of any weekly (or monthly) call is an acceptable sell price, how is the market maker taking advantage of you? It’s a contractual transaction at the (acceptable) bid and it doesn’t matter if the MM or another person is the counter party to the trade. You got your price.
Justin,
about PYPL, you got me baffeled:
When I looked it up last week EW showed July 20, or my eyes confused the 6 with a 0, which is not impossible because my eyesight is pretty bad after trombose, glaucoma, and cataract.
Getting old is tough. 🙂
Roni
I can see your point Spin – I haven’t analysed enough weeklies to be sure one way or another. I do recall that when it was a wide spread that the bid was never close to an acceptable price though so I lost interest since I was finding plenty of good trades on the monthlies.
Anyway great to see another good night on the market and I’m off on a day hike now 🙂
Alan / others:
Here are some Bid – Spread Questions:
Condition1:
Stock Option has a Bid – Ask for $1.00 / !.30 (Mark or Midway 1.15:
The Bid is the highest Buyer and the Ask is the lowest seller from the Market’s point of view.
Question 1: If I Play the Spread and Sell to Open 1 Contract STO Limit 1.15 (All or None set to None, the default) (I am the seller now), Send the Trade, See it in the Order window, Wait 1 minute and see no execution. why do I not see the Ask price displayed as 1.15 on my computer screen per the Limit Order Display Rule? Is it because I am a small potato or is there a latency that eventually take into effect?
Comment1:
Classic Encyclopedia Page 223-227 (Show or Fill Rule or Limit Order Display Rule or Exchange Act Rule 11Ac1-4: Per this rule the Market Maker must display my offer by changing the ASK price to 1.15.since I am now the lowest seller.
Question2: Am I correct in stating if you are placing a Covered Call Limit order or a rolling Limit order that the Limit Order Display Rule does not apply since you cannot parse what the Asking price is for each component (Stock, Option)?
20 Contract Obligation:
I also understand from what I have read (if not out of date!) that one thing that affects your execution is the obligation of the money maker to fulfill up to 20 contracts at that asking price if at least one contract is fulfilled. This means the following:
A. The money maker, in order to avoid fulfilling this rule and lose some profit (He will have to sell 19 other contract at the lower asking price), will fulfill my single contract offer and is then not forced to display it per the Limit Order Display Rule.
B. If I had originally placed an order for 15 contract, he is obligated to fulfill that order in full and not partially, because of the 20 contract rule at a displayed price.
Mario G.
Mario,
There’s latency if you were placing the trade with Jay and his vacuum delivery to the guy on the horse who rides over to the exchange to place it. :->)
Seriously, If you are splitting the B/A with your order, price should be reflected. It doesn’t always happen and why, I don’t know. It may be a broker software issue or maybe the computer gerbils aren’t awake yet but the order size has no relevance. The system is designed to facilitate the little guy. There’s a lot of price spoofing by HFT guys but that doesn’t apply in your scenario since you have become the best offer.
I’m not sure what you mean by parsing what the Asking price is for each component. When placing spread orders, the market maker is under no obligation to fill your order if your execution price is not available from current price. The two respective legs have a bid and and ask so price is apparent. A combo order spread also has a B/A quote. Since a spread can be bought or sold, the quote will be A1-B2 (buy) and A2-B1 (sell). Rut roh, confusing math time.
For example, the July 20p is $1.00 x $1.25 and the July 19p is $0.25 x $0.35. There are two spread prices so
A2-B1 is $1.25 – $0.25 or $1.00
A1-B2 is $1.00 – $0.35 or $0.65
and the combo spread order will be quoted as $$0.65 x $1.00
You can then split that B/A and place your spread order anywhere b/t $0/65 and $1.00. With more liquid options, you’ll often get better fills b/t the B/A though sometimes, you won’t, despite the liquidity. I’ve never been able to figure that one out.
I hope that this makes sense and I hope that I was understood what you were asking. If I didn’t, move on to the next reply :->)
Mario,
I have been leveraging the Show or Fill Rule for years and my limit order is always published if the trade is not executed as long as the AON box is not checked. I enter for 10 contracts or less. I also move slightly in favor of the market-maker once the “mark” (midpoint) is identified…$1.10 in your example. With adequate option liquidity, your trade will be executed more often than not. This rule was developed to protect all of us “small potatoes”
Using combination forms will weaken our “Show or Fill leverage” compared to legging-in but may add commission savings with some brokers.
I would try executing 10 contracts or less per trade. I believe you are more likely to get successful trade execution compared to 20 contracts. This is the guideline I have been using successfully…let us know.
Alan
Alan
Just re your last point – if for instance you wanted to sell five contracts, do you think you’d improve your chances of a fill by
selling them one at a time? (With Interactive Brokers for instance the commission is trivial so that needn’t be a deterrent.)
Justin
Justin,
I would do all 5 at one time. My experience has been (for 10 contracts or less and adequate liquidity) that there will be a high degree of execution success as long as the limit order is placed slightly on the market-maker side of the mark.
Alan
The only deterrent would be placing the spread order as AON because you could miss a fill if less than 5 were available at your price.
IB will give you a partial fill of 1 or more contracts any time a matching price becomes available. And even though IB’s commissions are trivial, when you place an order that provides liquidity, you often get liquidity rebates (commissions are lower). I can’t provide any proof but in nearly 20 years at IB, I have found that single contracts/combos get filled at a higher commission charge (their normal fee) whereas with larger orders, some of the partial fills may have a lower charge. A multiple fill means say you place an order to buy 8 spreads and you get fills of +1, + 3, +2, +2 (total of 8) at a different component prices but all have the same spread cost.
Trading experiences – July 12-14, 2017:
The last 3 days I really exercised the knowledge I have received from Alan and from actual trading for 15 months. Out of my 20 current positions with 11 Stocks , 4 started as OTM, 13 were ITM
As of 7/7:
As of last Friday 7/7/17 my 4 account Portfolio at 2 Brokerages was 95.2% invested and YTD I am at 8.2% and 16.4 annualized. This was despite I was down $7000 from my Account value high point for the year which occurred on 6/23.
20% rule execuled:
Because of the recent downturn in some Leisure stocks (HLT-hotel) and (MGM-casino), technical stock ATVI-software, and the ETF QQQ-Nasdaq ETF. Between 7/3 and 7/7 last week, all these stocks crossed the 20% call value premium rule (20% of STO premium of option). In one account, the BTC premiums ranged from $42.00 (2 contracts) to $140.00 (7 contracts of MGM at $0.20 per share).
It’s interesting to calculate the Price decline of the Underlying from the Purchase date or Price of last Roll of the 4 stocks when they hit the 20% Rule: MGM Strike 33 (8%), MGM Strike 32 4,8%, QQQ 3.3%, ATVI 6.3%. Varies I am sure because of the volatility of the stock. Per Alan’s rules, you use the 20% rule irrespective of the OTM or ITM purchase type. ATVI was the only OTM stock and its drop was in the middle of the range.
To execute the 20% rule, I automated the process with a BTC GTC order for the Option leg only as I saw the price dropping. This was Week 3 of a 5 week cycle so the 20% rule is in effect (Changes to 10% in 4th Week or 5 week cycle).
For the limit order, I even took into account commission effect on the trade if contracts were small and the stock was not consolidating at the 20% price level – since a $6.00 (Base plus contract) charge on 100 shares is $0.06 or $6 expense while on 700 shares is around $0.01. That is significant when later you want to trade an STO order with a smaller time value (decay) than your original purchase.
After filling the BTC orders, I then waited to “Hit a Double”, the goal of which is to wait till the price of the Stock price recovers to at or near the original price and then placing a new STO order to get a second round of income.
Reserve:
I found, when doing my documentation, that there is a reserve put in your cash to cover the BTC, Interesting how your Account value remains the same but your Cash available to Trade is reduced by the reserve. Fidelity and Optionshosue call this “Committed to Open Orders”. Optionshouse calls the two Cash Available to Trade, and the reserver, Cash on Deposit. The amount reserved includes the commission, too, but not the management assessment fee.
Summary of Trades 7/12 Wed – 7/14 Friday.
A: 7/12 1 – Multicontract Unwind and (GLW) with Buy Write Sell order loss of 0.21% loss or $42.63 out of the 1036.56, 5.1% net gain in the position This was followed with a search on Week 4 of 5 of where to spend the New Money released. See detail below.
B-B1: 7/12 Hit Double on QQQ (100 shares strike 140.5 )(3 positions). Typical trade: 7/3 BTC loss was 0.41/share, 7/12 STO gain was 1.34 /share for net “hit double” gain of $93.31 or 0.66% in position. Final net gain is 308.76 or 2.2% Gain. 3 Positions filled on an automated existing STO limit order 3 minutes before closing time Wed. when QQQ hit a last price of 140.7.
B-B2: 7/12 Hit Double on ATVI (400 shares strike 60) (2 positions). This was an original 5/19/17 OTM trade with a ROO Cost basis of 54.59 and Strike 60. Expired Worthless and Rolled last cycle. BTC 20% Rule loss was 0.31 or – 0.56%. STO gain was 0.9706 or 1.8% for net Hit Double gain of 1.24 of 2.3%. Net final position gain 2353.12 or ROO 10.8%. This position will be retired next cycle since Earning report is on 8/3.
C. 7/14 Hit Double on MGM Strike 32 with gain 0.54% after including BTC loss.
.********************
Detail of GLW Mid-Contract Unwind:
GLW-Corning – Multi-Contract Unwind-Week 4 of 5:
The stock gapped up further and I saw an opportunity for a Mid-Contract unwind with a loss of less than 0.2% after commission to use the money for new positions. For a typical calculation I did the following:
1. GLW Current Covered call info: GLW 700 shares with Option 7 Contracts 29 Call Exp 7/21. Originally purchase 5/3, Rolled 6/16, Strike 29, ROO% Cost Basis 29, Current Gain of 1036.56 or ROO 5.1%. (1036.56 / (29*700)=5.1%).
2. To unwind GLW with 0.1 to 0.2% loss in including commission I did the following:. Commission about $10 for Unwind or $0.014 / share ($10.00 / 700) shares (actual was – Fidelity $10.40 – 4.95 plus Fee 0.5, and for the option 4.65 plus fee 0.30). For the time value, 0.1% loss is a time value of .029 (Cost basis * .001). The total is an allowable time value of .043 (.014 +.029). To guarantee this time value I set a buy-write Sell order with a credit limit of 28.95 (Strike – Time Value). (Remember I posted earlier a proof that the Price of the stock does not matter if you want a certain time value, that is equivalent to the Current price of the stock – Premium paid. This is only true for ITM calls.).
Actual final trade was at credit limit of 28.94 which is 0.21% loss (.06 / 29). Actual share price was 30.79 and option price of 1.85. The difference is 28.94, which correlates with the Credit Limit.
On an investment of $20,300 (29 x 700, ROO CostBasis) that is $42.63 loss out of the current gain of $1036.56, which reduces the ROO% from 5.1% to 4.9%.
Ending the Story:
With the New Money released with my unwind of 2 GLW positions (500 15.3K, 700 shares or 27.5K ), I searched far and wide for a Stock that looked favorable, ITM, BEP good, lower volatility in charts, and a reasonable ROO%. Looked at latest Premium Report, first for Positive, then Mixed Securities. No luck. Checked Last Weeks Premium report. No luck.
Checked last cycle stocks. Found ATHM with an ER of 8/9 which gapped up on 6/9 released for new money. This chart and BEP points looked good. Strike 45 Exp 7/21. Ended filling two order with Time value of 0.47 (1.04% ROO% and debit limit of 44.54 (45 – 0.47 Strike – Time Value). Added additional income of $291.4 (.47×500) and $329 (0.47×700) to two accounts before commission.
Mario G.
Here is a correction for my Post of “Trading Experiences”..
Paragraph B-B2 for ATVI Hit Double trade is corrected below.
B-B2: 7/12 Hit Double on ATVI (400 shares strike 60) (2 positions). This was an original 5/19/17 OTM trade with Purchase price of 54.59, ROO Cost basis of 54.59 and Strike 60. Expired Worthless and Rolled last cycle. BTC 20% Rule loss was 0.31 or -0.56% (0.31/ 54.59).. STO gain was 0.9706 or 1.8% for net Hit Double gain of 0.6602 or 1.24%. Using the Last Price for 7/14 of 60.75 with Strike 60 (Strike limited), net final position gain is $3117.12 or an ROO of 14.28%. This position will be assigned away at the end of the 7/21 cycle since Earning report is on 8/3.
Check for Gain and BreakEven Point::
Break Even:
As a check, for the above position, the Breakeven point is 52.207 per share after adding up all the options costs of $953.92 or 2.3848 per share. 54.592 Purchase price – 2.3848 Options = 52.207.
Gain Calculation:
ROO Cost Basis is 54.592 = Purchase price for OTM trade.
Gain is 2 components. BEP to Purchase Price from Option income. and B. Upside potential from Purchase price to Strike
A. Option Cost: (1 – (52.207 Breakeven / 54.592) Cost basis) = 4.3688%
B. Upside Potential: (60 / 54.592) -1 = 14.275%
Total ROO%Gain = A + B = 14.75% which was stated earlier.
Gain from the above is 54.952 Cost Basis * 400 Shares * 0.1475 (ROO%) = $3117.which agrees with gain stated earlier.
Mario G.
.
Spindr –
I was able to check out from the Broward County Library (Florida) the book by McMillan “Study Guide for Options as a Strategic Investment” Will comment on it after I do some reading.
The library in this area is a valuable free source for books. Great feature is you can keep checking out the same book as long as nobody else requests it. Been doing that for many years for various certifications and course requirements..
Mario G.
Mario,
I have no clue what the study guide offers versus the book but I look forward to your comments. I picked up a few copies of the 3rd edition late last year for $3.59 apiece from Thrift Books as stocking stuffers. It kinda ruined the stockings :->)
I read the 4th edition and didn’t buy the 5th since at this point, I’m not looking to expand into the latest new exotic new products, etc. I’ know enough to be dangerous and there’s no need to exacerbate that. :->)
Spin