Technical analysis is a key component to our stock selection process as well as our buy-sell decisions. One of the first choices we need to make is the format of the price chart. Sometimes that decision is difficult if presented with several outstanding options. For example, you’re offered a choice of two tickets to one of two Yankee games: versus the Red Sox or the METS. Both are great opportunities but since your wife’s family is from Boston, you go with the METS (just a little humor). In a similar fashion, when choosing between a bar or candlestick chart, there is no poor selection. In my books, I use bar charts, as I slightly favor the appearance of these charts. I know that there are many BCIs who prefer candlesticks and I certainly respect that preference. The one chart that I would ask you not to use is the line chart which provides the least amount of information. I will briefly define the line chart and explore in more detail the other two.
Line chart:
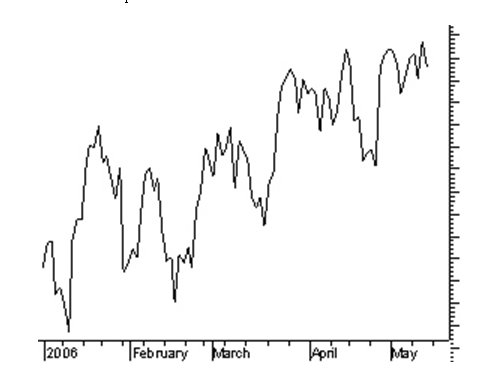
This is a very basic chart created by connecting a series of closing prices of a particular security with a line.
Here is an example of a line chart:

Line chart
Candlestick Chart:
This chart is created by displaying the high, low, open and close for a security each day over a certain time frame. Let’s view two candlestick lines:

Candlestick lines
Let’s take a closer look at a candlestick chart:

The following information is derived from these lines:
•The middle portion (red arrows) is called the body and represents the opening and closing prices that day
•If the body is in black or red, the stock closed lower than its open
•If the body is white or green, it closed higher than its open
•The lines above and below the body are called shadows (upper and lower) and represent the session’s high and low prices (blue arrows)
•Note: A weekly candlestick is based on Monday’s open, the weekly high-low range and Friday’s close
•The candlestick to your left (white) closed higher than the open
•The candlestick to your right (black) closed lower than the open.
So….white or green is bullish and black or red is bearish
Bar Chart (my favorite):
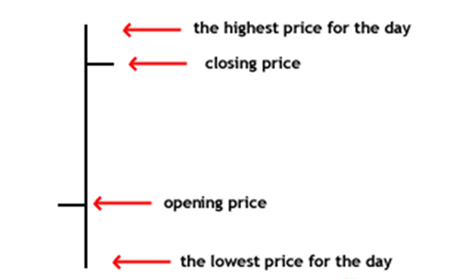
Like the candlestick chart, this price chart consists of session high and lows as well as the opening and closing prices. It is also referred to as the O-H-L-C bar.
Here is an example of a bar from such a chart:

OHLC bar
As you can see, the information is similar. To establish the relationship between the opening and closing prices on the Bar Chart, we look at the horizontal lines to the right and left of the vertical. In candlestick charts, we look for the color difference of the body of the candlestick. Most sites will also color code the OHLC bars red or black:
•Red: Depicts a lower close than the previous day’s close
•Black: Depicts a higher close than the previous day’s close.
Common Features:
•Display high, low, open and close prices
•Neither chart reflects the sequence of events between the open and close
•Provide much more information than the line chart
How they differ:
•In candlestick charts, the relationship between open and close is depicted by the color of the body, whereas with bar charts that relationship is shown by horizontal lines projecting from the vertical.
•The bar chart places greater emphasis on the closing price of the stock in relation to the PRIOR periods close. The candlestick version places the highest importance of the close as it relates to the open of the SAME day. This is the main reason I prefer the bar chart but the difference is negligible.
Chart Comparison:
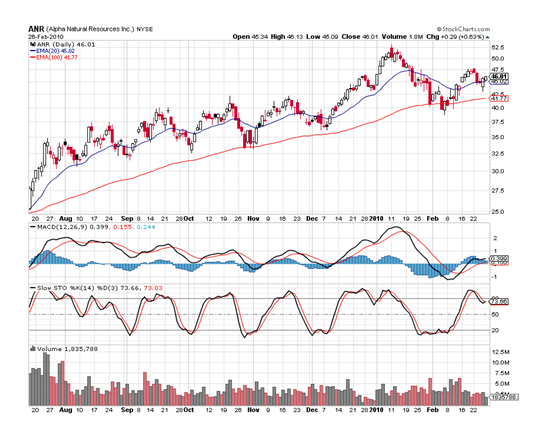
Since so many BCIs use the www.stockcharts.com site, let’s view both chart patterns as created from this site:
ANR- Candlestick

Candlestick chart of ANR
ANR- Bar Chart

Bar chart for ANR
From our premium watch list:
Here is a bar chart of FLT, a stock on our premium “running list” for 14 weeks. Note how the bars remain at or above the 20-d ema as cash flows into our accounts:

Bar chart for FLT
Conclusion:
Both the candlestick and bar charts offer much more information than the line charts. Some chartists prefer the color feature of the candlestick bodies while others prefer the emphasis on closing price comparison with the previous period offered by the bar charts. You can’t go wrong with either one. My advice is to select the chart you like and use it consistently so reading a technical chart will take only a few seconds.
Cashing in on Covered Calls: #1 on Amazon.com for 5 years:
I can’t tell you how grateful I am to you for making my first book, Cashing in on Covered Calls, number 1 on Amazon.com for covered call writing since its publication 5 years ago. Thanks also for keeping my other two books in the second and third slots! I am truly humbled. In conjunction with this anniversary, we are also making available a new product: a yearly subscription to our premium membership. Many of you have requested this and we have listened. You subscribe for 12 months and get one month FREE. From now through the end of January all those who subscribe to the yearly membership will also receive a FREE E-book version of Cashing in on Covered Calls. The product is currently available in the Blue Collar store.
High School and College Students:
I am in the process of completing a project that has been on my mind for years. I am writing a book for you. I feel that it is the most important undertaking for the Blue Collar Investor to date. I expect publication within the next 2-3 months.
Market tone:
Fed Chairman Ben Bernanke linked short-term interest rates to specific levels of unemployment, an impressive decision in the eyes of this investor. Rates, he stated, will not be increased until unemployment falls below 6.5%, as long as the long-term outlook for inflation remains at the 2% level. This lends credibility to the promise of low rates. This week’s economic reports:
- The Fed also announced that it will continue to purchase $45 billion in treasury securities per month and $40 billion per month in mortgage-backed securities to hold down long-term interest rates and stimulate growth
- The Fed chairman also expressed concern regarding the damage the “fiscal cliff” issue can cause to our economy. This is the main reason BCI has been taking such a conservative stance in our investment decisions. Let’s get with it, Congress!!!
- After 3 months of rising CPI, the consumer price index fell 0.3% in November, better than the 0.2% expected by economists
- Industrial production rose by 1.1% in November, much better than the 0.3% anticipated
- The producer price index (PPI- A measure of the average change over time in the selling prices of a fixed basket of goods by stage of production, industry, and commodity. It is considered a leading indicator for consumer inflation. The “core” PPI excludes food and energy prices—which account for roughly one-quarter of the broad PPI and tend to fluctuate widely—providing a truer reflection of inflationary trends) dropped by 0.8% in November, more than the expected decline of 0.4% mainly due to energy prices
- The trade deficit increased in October by $1.9 billion. However, over the past year the deficit fell by $3.5 billion as exports were up 1% and imports down by 0.8%
For the week, the S&P 500 dropped by 0.3% for a year-to-date return of 15%, including dividends.
Summary:
IBD: Market in confirmed uptrend
BCI: After Chairman Bernanke’s comments regarding short-term interest rates, this site remains bullish on the long-term outlook for both our economy and the stock market. We are waiting to see the outcome of Congress’ response to the “fiscal cliff” issues. As a result, we continue to favor in-the-money strikes, low-beta stocks and ETFs in our portfolios.
Happy and successful investing,
Alan ([email protected])


Alan,
I am a new subscriber to BCI. Really enjoying you articles and your explanation of all phases of covered call writing and trading in general. One question about charts. Which time frame do you use? I know it’s somewhere in all this sites info, I just haven’t seen it yet.
Thanks in advance, Ronnie
Ronnie,
It’s great to have you as a new premium member!
I like to view a technical chart spanning 8-12 months. Here is a breakdown of the time frames I use:
Moving averages: 20-d and 100-d EMAs
MACD Histogram: 12-d EMA and 26-d EMA with a 9-d EMA trigger
Stochastic Oscillator: 14-d trading range with a 3-d SMA trigger
For a more detailed explanation of setting up a technical chart see page 85 of “cashing in on Covered Calls” or pages 71-74 of “Encyclopedia…”
Alan
Premium Members,
The Weekly Report for 12-14-12 has been uploaded to the Premium Member website and is available for download.
Also, be sure to check out the latest BCI Training Videos and “Ask Alan” segments. You can view them at The Blue Collar YouTube Channel. For your convenience, the BCI YouTube Channel link is:
http://www.youtube.com/user/BlueCollarInvestor
Best,
Barry and The BCI Team
Alan,
Do you still recommend Vanguard funds to build up enough cash to sell covered call options? Thanks.
Matthew