Several studies have been undertaken to determine the effectiveness of the covered call writing strategy. I believe that it is important to evaluate the parameters that are used as well as how they are employed in these evaluations to assess the accuracy of the findings. In 2002, BXM was developed by the CBOE (Chicago Board Options Exchange) in cooperation with Standard & Poor’s. This is a benchmark index that tracks the performance of a hypothetical covered call strategy on the S&P 500 index. Data on this index can be accessed as far back as 1986. The parameters for this index are as follows:
- Buy an S&P 500 index portfolio
- Sell 1-month slightly out-of-the-money calls (SPX) options
- Hold until expiration Friday and then cash-settled
- Then a new 1-month, slightly out-of-the-money call is sold
Two major studies performed on the BXM concluded that BXM returns similar compound annual percentage returns as the S&P 500 index but with much less volatility:
BXM study by Callan and Associates
This was an 18-year study that determined that BXM returned annual percentages of 11.77% compared to the S&P 500 returns of 11.67%. However, BXM did so with a standard deviation (volatility) of 9.29% compared to the 13.89% of the S&P 500, one third less.
BXM study by Ibbotson Associates
This 16-year study concluded that BXM returns 12.30% per year compared to 12.20% of the S&P 500 also with two thirds the volatility.
Advantages of using BXM to traditional covered call writing
- Less time management required
- Less cash required
- Instant diversification
Returns in the long run are quite similar to that of the S&P 500 but in bear markets BXM will outperform. Here is a 5-year chart of BXM compared to the S&P 500 from 2008 through June-2013 which included the recession of 2008:
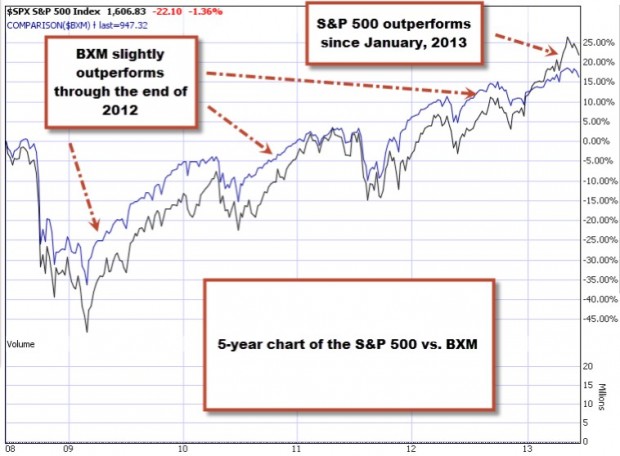
BXM vs. S&P 500: 5-year chart
Although this time frame was an aberration as it included one of the worst recessions in US history, it is clear that BXM (blue) slightly outperformed the S&P 500 (black) for the first 4 years but not so far in 2013. Generally speaking, in the long run, the returns will be similar.
Why the BCI system generates greater returns
- We are not required to hold every stock in the index. We can select the best performers
- We can avoid the risk of earnings reports
- We can utilize different strike prices, not only slightly out-of-the-money strikes
- We can initiate exit strategies, not simply wait for expiration Friday
Conclusion
Most studies undertaken to evaluate the covered call writing strategy do not take advantage of all the opportunities that exist to elevate returns. BXM will mirror the returns of the S&P but with much less volatility. The BCI system will elevate the returns of BXM by implementing fundamental, technical and common sense parameters. Which approach is best for you is something only you can determine. Once educated, the right choice will be an easy one to make.
Market tone:
When Ben Bernanke, the Federal reserve Chairman, announced plans to “moderate the pace” of its bond-buying program, the global markets reacted negatively. He said the program may end in mid-2014. That aside, the economy continues to improve as shown in the latest economic reports:
- The Fed may end its $85 billion a month bond buying program if unemployment drops under 7% next year
- The federal funds rate will remain near zero until unemployment dips below 6.5%
- US consumer prices increased by 0.1% in May as inflation remains under control
- Core CPI (excludes food and energy) rose by 0.2%
- Minutes from the May FOMC meeting reflected a positive overview of the US economy as a result of a strong housing market, and increases in household spending and business investment
- Sales of existing homes rose by 4.2% in May, the fastest pace since the fall of 2009 when the federal tax credit program was available
- The median single-family home price was up 15.8% from a year ago to $208,700, the best increase since October, 2005
- There is a 5.1 month supply of homes on the market better than the 6.5 month figure from a year ago
- New home construction increased by 6.8% in May as housing as a whole was up 29% in May from one year ago
- The Conference Board’s index of leading economic indicators moved up 0.1% in May
For the week, the S&P 500 declined by 2.1%, for a year-to-date return of 13%, including dividends.
In the past month the VIX is up about 42% and the S&P 500 is down about 5%:

VIX accelerating in the past month
Summary:
IBD: Market in correction
BCI: This site remains bullish on the overall economy but because of the market over-reaction to Chairman Bernanke’s comments will take a defensive posture for the July contracts and use predominantly in-the-money strikes.
Much success to all,
Alan (alan@thebluecollarinvestor.com)
Premium Members,
The Weekly Report for 06-21-13 has been uploaded to the Premium Member website and is available for download.
Also, be sure to check out the latest BCI Training Videos and “Ask Alan” segments. You can view them at The Blue Collar YouTube Channel. For your convenience, the BCI YouTube Channel link is:
http://www.youtube.com/user/BlueCollarInvestor
Best,
Barry and The BCI Team
Alan,
Can you suggest the best places to get a list of option price quotes? In your books you seem to favor Yahoo.
Thank you.
Tom
Tom,
I use the Yahoo site (www.finance.yahoo.com) in my books and DVDs because it is a reliable free site. There are many others. Other choices:
1- Your brokerage compoany will have access to option quotes
2- http://www.cboe.com (quotes and data)
Alan
Hi Alan,
I am a newbie to Options Trading and my research into a conservative initial approach has led me to covered calls which in turn has led me to your great website.
I am going through the self-education phase and I am enjoying your website and your beginners videos greatly – Thank You !
It is my intention to lear more about the BCI methodology and probably to subscribe to your service.
I have a question for you regarding the question from Paul re MLNX stock option call with an $8.00 price.
I understand your explanation that this represents almost all Implied Volatility and that from the Seller’s viewpoint there is a higher risk of stock downside associated with the seemingly too good to be true price.
What I am struggling to understand is the “other side of the coin” – ie. the market or buyer’s perspective: Why would anyone be prepared to pay $8.00 for a stock option which in my mind (and very limited knowledge at this stage) represents also a high degree of risk to the buyer ?
Is it just that it is the belief/expectation of a number of buyers, for whatever reasons, that the stock will go up by that amount.
If you have a few moments for a brief reply it would be greatly appreciated.
Kind regards,
Bill
Bill,
I believe that it is a valuable exercise to view the option trade from the other side from time to time to get a different perspective and understanding of options trading.
In this case, the high IV of the options means that the market is anticipating a large price movement prior to expiration and the reason centers around the earnings report. As you can see on the chart below the price has moved dramatically over $20 after the last 2 reports (see the $ signs). This price change can occur in either direction.
For purposes of responding to your question, let’s assume the price increased by $20 instead of declining as it did in the past 2 reports. Let’s first do the math as a stock buyer:
Buy @ $100 and sell @ $120 for a 20% profit
Now as an option buyer:
Buy the $105 call @ $8 and strike ends up $15 in-the-money for a minimum value of $15 (allotting no time value to the premium):
Profit = 15 – 8/8 = 87.5%
More than quadruple the return for the option buyer (compared to the stock buyer) IF the trade worked out the way he (she) hoped it would.
CLICK ON IMAGE TO ENLARGE AND USE THE BACK ARROW TO RETURN TO BLOG:
Premium members:
This week’s 6-page report of top-performing ETFs and analysis of ALL Select Sector Components has been uploaded to your premium site. The report also lists Top-performing ETFs with Weekly options.
For your convenience, here is the link to login to the premium site:
https://www.thebluecollarinvestor.com/member/login.php
NOT A PREMIUM MEMBER? Check out this link:
https://www.thebluecollarinvestor.com/membership.shtml
Alan and the BCI team