
Volatility is a key consideration for both stock selection and option-selling decisions. Despite its relevance to our covered call writing and put-selling selections, volatility does have its limitations and we must fully understand how we can best take advantage of the information gleaned from volatility statistics.
Types of volatility
Historical volatility: The annualized standard deviation of actual past stock prices. Even if two stocks start and end at the same price over a period of one year, they can have very different historical volatilities as reflected in the chart below:

Historical Volatility of Two Stocks
Note that both stocks begin and end the year priced at $100.00 per share but the “blue” stock was much more volatile over that time frame. This demonstrates that historical volatility is not based on a directional trend but rather on the amount that the price oscillates.
Our Premium Member Stock Reports give historical volatility information as it relates to the S&P 500 in our “running list” as shown in the screenshot below:
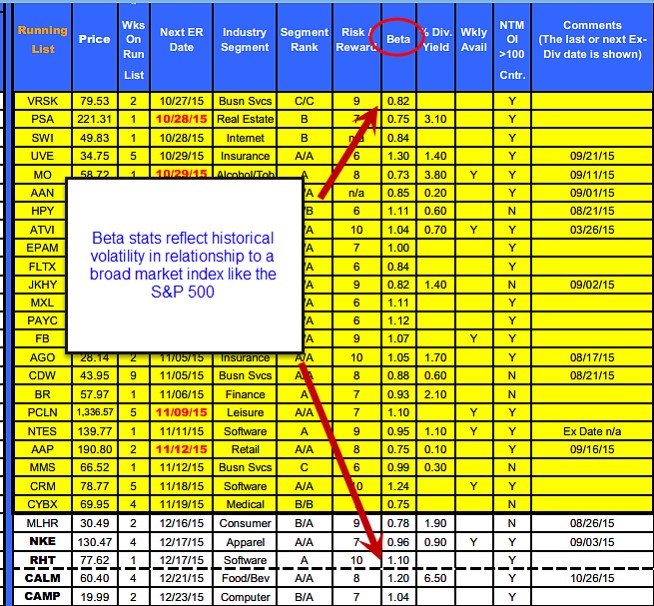
Beta stats from our Premium Stock Reports
Implied volatility: This is the market’s forecast of the stock’s annualized standard deviation volatility based on price changes in the option. This is more important to short-term option-sellers than is historical volatility because it is forward-looking. Implied volatility will impact the time value component of an option premium only and has no effect on intrinsic value. Implied volatility is expressed as a percentage of the share price, indicating a one standard deviation move over a twelve-month time frame. Let me explain. Let’s say a stock is trading at $50.00 and has an implied volatility (again based on option pricing) of 20%. This means we can anticipate a price fluctuation 0f $10.00 (20% of $50.00) in either direction or a price range from $40.00 to $60.00. The fact that this is an annualized statistic based on one standard deviation means that the range is anticipated over a twelve month time frame and is accurate 68% of the time. This can be better visualized using a normal distribution curve:

Normal Distribution Curve for One Standard Deviation
Note the following:
- Share price is expected to fall between $40.00 and $60.00 68% of the time over a one year time frame
- 16% of the time, share price will be lower than $40.00
- 16% of the time, share price will be greater than $60.00
How is implied volatility calculated?
An option pricing model like Black Scholes is used and the following information is required:
- Stock price
- Strike price
- Expiration date
- Risk-free interest rate
- Dividends (if applicable)
- Option price
Converting implied volatility stats to shorter term options
Since we rarely sell one-year expiration options we must add one more component to our equation in predicting future price movement based on implied volatility and that is to multiply by the square root of the number of days to expiration divided by 365:
[$50.00 x 20% x SR (Days to Expiration/365)]
Limitations of implied volatility when determining future stock prices
- Does not predict direction
- Depends on market assessment (option prices) which may or may not be accurate
- Based on theoretical calculations from an option-pricing model
- Annualized stats must be converted to the time frame of the option contract
Implied volatility stats are listed on pages 7 and 8 of our Premium Member ETF Reports.
Discussion
Understanding and utilizing volatility statistics are absolutely critical when trading stocks and stock options (exchange-traded funds as well). For short-term option-selling, implied volatility is more relevant than historical volatility. As helpful and useful as these data stats are, we must understand and factor in the limitations they possess so we can best utilize them in our day-to-day investment decisions.
BCI referenced in option article by Jason Levy
http://www.dailysludge.com/selling-puts/
Next live appearance
American Association of Individual Investors National Conference
Bally’s Hotel
Las Vegas, Nevada
November 7th – November 9th
Sunday November 8th @ 8:30 AM – 9:45 AM (Alan’s seminar)
Exhibit Hall # 313
***Event is sold out
Market tone
Global stocks moved higher due to strong US economic data, strong corporate earnings, China’s rate cut and the expectation of further stimulus from the European Central Bank. Alphabet (Google), Microsoft, Amazon, McDonald’s and General Motors beat earnings estimates, although IBM, Morgan Stanley and disappointed. This week’s reports:
- US home resales increased 4.7% in September to an annual rate of 5.5 million units, the second-highest monthly sales pace since February 2007
- The Federal Housing Finance Agency House Price Index (FHFA HPI) rose a seasonally adjusted 0.3% in August, up 5.5% from a year earlier on the strengthening job market and shrinking inventories
- The National Association of Home Builders housing market index rose to a 10-year high of 64 in October
- New home construction starts rose 6.5% in September to an annualized rate of 1.21 million, above consensus and the second-highest level in eight years
- The Bloomberg Consumer Comfort Index fell from 44.5 in September to 42 in October
- Initial jobless claims increased 3,000 to 259,000 for the week ending October 17th, remaining near a 42-year low
- Continuing claims rose 6,000 to 2.17 million for the week ending October 10th
For the week, the S&P 500 rose by 2.07% for a year to date return of 0.79%.
Summary
IBD: Confirmed uptrend
GMI: 6/6- Buy signal since market close of October 19, 2015
BCI: Cautiously bullish using an equal number of in-the-money and out-of-the-money strikes. There are many encouraging signals including the S&P 500 moving above its 50-d and 200-d moving averages and moving into positive territory year-to-date. However, recent volatility and weakness with retail and energy stocks are keeping me fro0m taking more aggressive positions. I remain fully invested.
Wishing you the best in investing,
Alan ([email protected])


Alan,
What is the time frame used for the beta figures shown in this article?
Thanks for the information.
Sal
Sal,
We use a 1-year time frame in our premium report beta stats. Some vendors like Google Finance and Yahoo Finance use 5-year time frames. Also, some resources use other benchmarks like the NYSE Index. We use the S&P 500 as a benchmark and a 1-year time frame. I feel these are the most relevant to short-term option selling. The differences in benchmark and time frames used are the reasons beta figures may vary from one vendor to another.
Alan
Premium members,
This week’s Premium Stock Report will be delayed several hours due to a problem last night with the IBD site. Part of the BCI screening process involves information gleaned from the IBD site and so my team lost about 8 hours due to this temporary glitch. Everything is running properly now and my team will be working non-stop to get the report concluded as early as possible. More than likely we are looking at Sunday, later in the day but we will make every effort to expedite.
Alan
Premium Members,
This week’s Weekly Stock Screen And Watch List has been uploaded to The Blue Collar Investor Premium Member site and is available for download in the “Reports” section. Look for the report dated 10/23/15.
Also, be sure to check out the latest BCI Training Videos and “Ask Alan” segments. You can view them at The Blue Collar YouTube Channel. For your convenience, the link to the BCI YouTube Channel is:
http://www.youtube.com/user/BlueCollarInvestor
Since we are in Earnings Season, be sure to read Alan’s article,
“Constructing Your Covered Call Portfolio During Earnings Season”. You can access it at:
https://www.thebluecollarinvestor.com/constructing-your-covered-call-portfolio-during-earnings-season/
Best,
Barry and The BCI Team
Alan,
I am wondering how there are comments posted on Saturday morning on your article when I do not receive them (the article) until Sunday morning at about 10:00 a.m. I might also mention that I am a premium member. Only asking out of curiosity.
Roland,
We use a professional service to send out notifications of the newsletter. We ask them to send it out at 10 AM ET on Sunday and I must post the article prior to that time. Posting time will vary based on my personal and business commitments. The comments you see from Saturday are from members who check our blog on a regular basis.
Alan
Hi Roland,
many times Alan posts the article on Saturday.
You can find it on the first page after you log in.
Scroll all the way down, almost at the bottom.
Good luck – Roni
Thanks to all for the information
Running list stocks in the news: ATVI:
Activision Blizzard is a key member of the video game market and demand for its products remain strong. The company recently announced plans to create a new eSports division to enter the growing popularity of eSports Leagues.
The stock has appreciated over 70% this year and is still going strong as analysts are raising estimates for both the next quarter and the following year. The upcoming holiday season is also a plus for this company.
ATVI has beaten earnings estimates in 3 of the last 4 quarters with one “meet”. It boasts a 150% average “beat” over the past 4 quarters and hasn’t missed since late 2010.
Our Premium Stock report shows a projected earnings report release date of 11/3/2015, a member of the software industry currently ranked “A”, a Scouter rating of 10, a beta of 1.05, a % dividend yield of 0.70, Weeklys available, adequate open interest for near-the-money strikes and a previous ex-dividend date of 3/26/2015.
Alan
Thanks for tip Alan.
Bought ATVI at 34.91 and sold ATVI 10/30/2015 35.00Cs for 0.38.
Aiming at 1% gain after comission.
Roni
Roni,
When I highlight a stock like this, it is always a company with great fundamentals, strong technicals and an interesting bullish story. I leave it to our members to determine if it is appropriate for their specific portfolios. It is not what some would call a recommendation per se although in many cases (but not always) these stocks are in my personal portfolios.
Thanks for your contributions to our blog and the BCI community.
Alan
Yes Alan,
no matter how this trade turns out, I am always trying to do the right trade, and your tips are super welcome.
Thanks again – Roni
Hey Roni,
Thanks for your great example of how to grab a quick 1% in a week!
There is an old axiom in options trading: “Buy time don’t sell it”. So if you buy options you want to give yourself the most time to be right. When you sell them you want to give your buyer the least time to be right.
That logic supports the weekly trade you made. And it is a good one!
I still think monthly options sales work in most markets. Maybe not this one which is bouncing all over the place! – Jay
Hi Jay,
I love the axiom you mentioned.
1% ROO in one week, is 52% annualized, and Activision is a solid bet.
My preferred options are the monthly options too, but in this case, the earnings report due Nov 3, rules them out.
So, if my shares are not called away today, I will sell them next monday or tuesday before the bell, with gain or loss.
To me the most important is low risk.
Have a nice weekend – Roni
How do you handle low number or fractional shares that accumulate in your account (e.g. after dividends are declared)?
Jeff,
Most brokerages will sell of fractional shares at the end of a trading day based on end of day pricing. Check with your broker to see your fractional shares are managed.
Alan
Hi Alan I do want to get back in to asking some more questions. The 3 things to ask you are:-
1. If I have a stock and during the weeks the price has gone higher but not enough to do a MCU on it, but then in last week the price starts falling with a risk it may expire OTM and at a loss, then isn’t it a good idea to close the position out before this actually happens?(while price is falling back down to buy price?)
2. Not too sure if I should need to close my position in any stock that has just had an analyst downgrade on it?
3. And is it best for me when buying a stock to try and do so when the S&P500 is at a support level?(or not too worried?)
Thank you very much.
Adrian,
1- Every situation needs to be evaluated on its own merit but I certainly agree that there are instances when a stock is declining in value during the final week of a contract that closing may be the best choice. Measure the time value cost to close versus the amount of share loss to generate a similar loss. For example, let’s you sold a $60.00 call and share price moved to $65.00 mid-contract and then dropped to $62.00 in the last week. Checking the cost to close you find an “ask” quote of $2.50. Therefore, the cost to close is $0.50 because your shares will be worth $62.00, not $60.00. To lose $0.50 without closing, your shares must drop to $59.50. So based on market assessment and chart technicals, we make our decision.
2- To me, a single analyst downgrade is meaningless although it may cause a temporary dip in share price. I would not eliminate a stock due to a single analyst downgrade.
3- I use the chart of the S&P 500 as one of several criteria for market assessment. From there I determine strike selection and tend to be most bullish when market assessment is also bullish. Unless we are in extreme bear market conditions (remember 2008?) I will not be dissuaded from buying a stock but rather be quite selective as to which stock and which option.
Alan
Yo Adrian,
(Sorry for the Rocky riff, could not resist!)
For as much as we have benefited from your on going Q&A with Alan I would be edified to know what you are doing with it. Any trades you might share with our community? Thanks, – Jay
Hey Allan,
On your running list, how many stocks are on the list that are priced in the 20-30 dollar price range?
Thanks
Troy
Troy,
Most quality stocks are priced above $40.00 per share although there are always some priced under $30.00. In our most recent reports there were 9 stocks and 3 ETFs priced under $30.00.
Alan
Thanks Alan for the update of my backoffice, and I think your system and service is great so was likely to be still be going through it in years to come.
Will soon email next lot of questions on calculations; – there’s something with about two I’ve found that doesn’t quite seem right but I could be wrong.
And Jay, sorry I can’t share any trades because I’m only papertrading until I learn more from alan. It’s pretty useful to learn from other peoples trades.(the thing I usually look for is the date the trades are put on and then you can see how the charts looked on that day- not everyone does this though.)
Thanks Adrian,
I admire your discipline staying with the paper trading until you have confidence enough for the real thing.I wish I had done more of that – it let’s you learn a lot of lessons the easy way! – Jay
I have RAD (Rite Aid) call options for a strike price of 10.00 expiring in Jan 2017. With the announcement about Walgreens offering 9.00 a share, how will these options be affected ? I’m assuming the options will be worthless by then since the 10.00 will not be reached, unless there’s a bidding war from another company.
John,
You need to follow the news closely on this one as there may be some anti-trust litigation before any potential deal is consummated. If and when it is, option contracts will be adjusted according to the final buyout contract. You can access contract adjustments of this nature at the following link:
http://www.cboe.com/tradtool/contracts.aspx
It is far too premature to predict the moneyness of your January options at this point in time.
Alan
Premium members:
This week’s 8-page report of top-performing ETFs and analysis of ALL Select Sector Components has been uploaded to your premium site. The report also lists Top-performing ETFs with Weekly options. Recently, both our stock and ETF reports have had an increasing number of eligible candidates and historically that has been a sign of a healthier and strengthening market.
For your convenience, here is the link to login to the premium site:
https://www.thebluecollarinvestor.com/member/login.php
NOT A PREMIUM MEMBER? Check out this link:
https://www.thebluecollarinvestor.com/membership.shtml
Alan and the BCI team
Alan,
I read an article this week about IRA and 401K changes for 2016.
Thankfully it only discussed contribution levels and said nothing about options trading elimination.
Do your sources know yet whether this is a dead issue? – Jay
Jay,
I have no additional information since the last time I posted on this site. My sources feel that if there are any changes, they will impact brokers in terms of fees allowed and stricter fiduciary responsibilities. They feel that retail investors will still be permitted to write calls in self-directed IRAs.
Alan
Thanks for the always prompt and informative reply, Alan,
This is a hot button issue for me since I trade every variety of options in my self directed IRA. If “Big Government” were to take that away I might join the Tea Party :).
Though I suppose they are now the “Freedom Coalition”. Someone please put a sock in Rand Paul’s mouth so he does not spoil a decent market! – Jay
CALM EX-DATE:
The ex-dividend date for CALM was October 26th. This resulted in a $0.98 share price decline because of the upcoming dividend distribution. For those of us who own this stock, we will see $98.00 per contract added to our cash account or additional shares purchased with this cash depending on how we have our accounts set up. The distribution date is November 12th.
Alan
Hi I have been browsing and rereading your books, bci membership and youtube video. I came across a situation that I would like your advice about. Buying the 100 shares of stock and selling covered call is easy to earn but my problem is after the month expires and the stock has declined lets say 6%. I still like the stock and since I played atm my loss is just around 2%. My question will be since the stock will not be covered and expire, for the next month what covered call value should I invest in. Or how do I pick my option thanks
John,
Option selection is based on current information as to share price, market assessment and return goal. For example, let’s assume you bought a stock for $68.00 and sold the $70.00 call for $2.50 and then the share price dropped to $64.00 by expiration. Please remember that there may be exit strategy opportunities along the way but we’ll pass over that since it isn’t germane to your question.
Let’s also assume you have a goal of 2-4% for time value initial returns. Favor in-the-money strikes, if bearish and out-of-the-money strikes if bullish then check the options chain to see which of the strikes meet your goals, market assessment and personal risk tolerance. The multiple tab of the Ellman Calculator was designed to assist with these calculations.
Alan
Hello Alan,
Today I did a covered call on IPGP (market price $80.90). When selling the call the prices were bid $3.00 ask $3.40. I placed a limit order for $3.15. My broker rejected the order with the message that the limit order has to be in $0.10 increments. No problem, I changed the price to $3.20 (go for the gusto first). The order was immediately filled at $3.15. If the order can be filled at $0.05 increments, why can’t an order be placed at those same increments.
Thank you.
Fred,
Retail investors are bound by the increments set by the exchanges for options trading and that is the reason the increments set in brokerage accounts are 0.05 (options under $3.00) or 0.10 (options over $3.00). Some are even set lower for extremely liquid securities. Once the bid is entered, competing market-makers and options exchanges spar to take the other side of our offer to sell. We get the highest of those bidders and that can be between the $0.5 and $0.10 increments.
Congratulations on leveraging the Show or Fill Rule to generate an additional $15.00 per contract…you’re a true Blue Collar Investor!
Alan
What I don’t get from this trade is that with a limit order of 3.20 how it got filled at 3.15. When selling it should get filled at your limit price or higher. So a limit at 3.10 that gets filled at 3.15 makes sense but not from 3.20.
Nate,
You’re right. When I responded I was focused on the increment aspect. So the way the question was framed has an inherent error with the stats. Perhaps he mistakenly set a market order. I suspect that Fred did mean $3.10 as the second limit order…hopefully we’ll hear back from Fred.
Alan
Fred,
Every time I read a great question like yours and the informative reply from Alan I become a better options trader. I thank you both!
I am not familiar with IPGP but congrats on managing a nice trade.
The add I hope is helpful here is never take the default settings on price from your broker program at face value. Enter your own down to the penny.
Always start at the mark and work up in your favor. You will be surprised at how often you get filled. Then you will wish you had been more greedy :). Never buy or sell anything for market price. Set your price and let the market come to you. It almost always will. – Jay
Alan,
Finished reading your book and did 1st call.
One Nov AGN@310 $9.80
My next step is Buy to cover @ $1.90 I remember of the 20% rule.
Benson
Benson,
Glad I sparked an interest in pursuing this strategy.
Respectfully, I would ask you to check the news of this highly-sensitive news-driven security as well as the upcoming November 3rd earnings report. One of the key rules in the BCI methodology is never to sell a call if the company has an upcoming earnings report prior to contract expiration…too risky. If you agree, the call can be bought back prior to November 3rd, hopefully at a profit.
Alan
Alan,
I just noticed AGN earning report date this morning when I checked Yahoo although most of the companies with NA. Thank you for the warning.
If you avoid the option for earning report, you avoid the security as well in the IRA account?
Have a great weekend!
Benson
Benson,
Generally yes but for full transparency there are rare times I will hold a stock through an ER and write the call after the report passes. I will do this for companies that historically give muted guidance and tend to beat consensus. My goal here is to benefit from a positive report and then write the call. AAPL and CSCO are examples of such securities I did this for many years ago. THIS IS NOT PART OF THE BCI METHODOLOGY because it is so difficult to quantify and is based on “gut and experience” and I want all aspects of the BCI methodology to be as scientific as possible.
Alan