
Covered call writing is applicable only in neutral to slightly bullish market environments”. We’ve heard this proclamation time and time again and so it has become accepted as fact to a majority of option-sellers. In this article, we will examine the reasons for the allegation and investigate a completely new viewpoint as to when covered call writing can be implemented to our advantage.
Reasons why many believe covered call writing is useful only in neutral to slightly bullish markets
Profit & Loss Graph
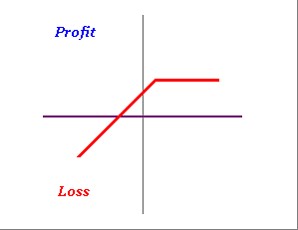
Conventional Profit & Loss Graph for Covered Call Writing
This chart shows limited upside potential with unlimited downside risk, seemingly perfect for neutral to slightly bullish markets only. Let’s say we buy a stock for $29.00 and sell the $30.00 call option for $0.75. Our maximum profit is $1.75, $0.75 on the option side and $1.00 on the stock side. Our breakeven is $28.25 ($29.00 – $0.75). The graph tells us that we can generate $1.75 in profit but lose $28.25 per share, not a pretty picture on first glance. Furthermore, if the stock price moves past the strike by more than $0.75, we “start losing money” Let’s say the price moves to $33.00, $4.00 higher than purchase price. We could have made $4.00 profit but only generated an earnings of $1.75…we “lost” $2.25 the thinking goes.
When to use covered call writing: An alternative perspective
In my humble opinion, covered call writing is appropriate in all but the most extreme market conditions. This means that it is appropriate in more than 95% of all market environments, probably more. The reason is that the strategy can be tailored to specific market conditions. Most covered call writers, buy a stock, sell a slightly out-of-the-money strike and wait for results. That IS the above graph. That IS NOT the Blue Collar way. Let’s dismantle the old way of thinking.
Limited upside potential
This is true however in bull market environments we can raise the level of the strike price and allow for additional share appreciation. It is true, this would mean a lower premium on the option side but would absolutely enhance the opportunity for greater returns by adjusting the strike price.
Unlimited downside risk
This is wrong on three fronts:
- The premium itself represents a degree of downside protection
- We can use in-the-money strikes in bear and volatile markets to gain additional downside protection in the form of intrinsic value. This additional protection is paid for by the option-buyer, not by us.
- There is an absurd assumption here that no action will be taken if share price declines…ridiculous. Every strategy we use to invest our hard-earned money must have a position management component in the form of exit strategies. These are stressed and detailed in my books and DVDs
Here’s what the profit & loss graph should look like:

Profit & Loss Graph with Exit Strategy Components
We start losing money when share price moves past the strike by more than the option premium
Every strategy should have its goals and exit plans. For example, we may set a goal of 2% – 4% per month for initial returns in hopes of achieving even higher returns in neutral to bull markets when selling out-of-the-money strikes. Let’s go back to our example of buying a stock for $29.00 and selling the $30.00 call for $0.75 only to see share value move to $33.00. Here’s my new-perspective take: We generated $1.75 in profit on a cost basis on $29.00 for a 1-month return of 6.03%. We have achieved our goals for the strategy we have selected. At this point, we may decide to roll the option or allow assignment. That’s part of our position management arsenal. From a philosophical and financial viewpoint we succeeded dramatically. It makes no sense to say that if we used a different strategy we could have made more money. We succeeded, we didn’t fail.
Discussion
There is no one strategy that is right for every investor. When making a decision, however, we must understand all the nuances, pros and cons, of each approach. For covered call writing, we can adjust the investing parameters to meet most market environments, mitigate losses and enhance gains. The fact that we are exposed to statements regarding these strategies over and over again does not mean that they should be fully embraced and never challenged.
May live events
May 10th
Caesar’s Palace- Las Vegas
Two seminars plus a book signing
May 14th
Baltimore, Maryland
Global stocks declined this week due to signs of sluggish global economic growth. The Chicago Board Options Exchange Volatility Index (VIX) fell on the week to 14.72 from 16.26. Crude prices dropped to $44.35 from $46.22 a week ago, and global Brent crude prices fell to $45.03 from $48.11. This week’s reports and international news of interest:
- The US Department of Labor released a disappointing employment report on Friday. Nonfarm payrolls rose 160,000, falling short of the 200,000 consensus
- Downward revisions to the prior two months’ data trimmed a further 19,000 jobs
- The unemployment rate held steady at 5.0% while the participation rate dropped to 62.8% from 63.0%
- The one positive note in the report was a 2.4% rise in average hourly earnings on an annual rate
- Futures markets are now pricing in a 4% chance of a Fed rate hike next month
- Crude oil production near Fort McMurray, Alberta, Canada, has been severely disrupted and nearly 90,000 inhabitants have been evacuated as a result of massive wildfires in the region. It is unclear how long production will be shut in or how big an impact this will have on the Canadian economy
- Puerto Rico’s Government Development Bank defaulted on $422 million in municipal bonds this week, setting the stage for a larger default on 1 July, when nearly $2 billion in general obligation bonds come due
- J.P. Morgan’s composite global manufacturing purchasing managers’ index, US manufacturing expanded less vigorously in April, as did manufacturing activity in China, the United Kingdom and Japan
- The Australian central bank unexpectedly cut policy rates this week to 1.75% from 2.0%. The policy rate now stands at the lowest on record The Australian dollar fell sharply in the wake of the announcement.
- The EC reduced its 2016 GDP forecast to 1.6% from 1.7% and cut its inflation outlook to just 0.2%, well below the 0.5% February forecast. Also this week, the European Central Bank’s monthly bulletin indicated that economic risks remain tilted to the downside
THE WEEK AHEAD
- China reports trade data and foreign exchange reserves on Monday, May 9th
- Eurogroup finance ministers meet on Monday, May 9th
- China releases consumer and producer price data on Tuesday, May 10th
- US retail sales figures are reported on Friday, May 13th
- China reports retail sales figures on Saturday, May 14th
Summary
IBD: Uptrend under pressure
GMI: 2/6- Sell signal since market close of May 4th
BCI: Neutral selling an equal number of in-the-money and out-of-the-money strikes. Recent economic data has been leaning bearish and recent earnings season was unimpressive.
WHAT THE BROAD MARKET INDICATORS (S&P 500 AND VIX) ARE TELLING US
Alan ([email protected])


Alan,
Following up on last week’s Q&A:…do I have this right?
30 Oct 2015:
Stock price: $62
23 Feb 2016
Stock price: $54.75
Sold $58 call for $2.10
Stock price now $62
Cost to close: $6
Share maximum value: $58 due to option obligation
Buying back option: Debit of $6
Share value now moves up to $62 from $58
Net loss: $0.40 per share; not $6
Alan, thank you so much for taking the time you have “invested” in my quandry…
Catherine,
It would be wrong to evaluate covered call returns from October, 2015 because the option sale took place in February, 2016. But if you did:
Commissions aside:
Stock was bought and sold at $62…a wash.
Option was sold at $2.10 and bought back @ $6 for a net debit of $3.90 per share
Now, based on the day the option was sold:
Share value was $54.75 and stock sold at $62 = +7.25
Option debit = (-)3.90
Net credit = $3.35
The chance of early exercise at this point in time is nearly zero based on the buy-to-close premium of $6. The option holder can buy the shares for $58 and sell at market for $62 for a net credit of $4. The holder can also sell the option for $6…which would we select a credit of $4 or a credit of $6? Early exercise leaves $2 of time value on the table.
Alan
Premium Members,
This week’s Weekly Stock Screen And Watch List has been uploaded to The Blue Collar Investor Premium Member website and is available for download in the “Reports” section. Look for the report dated 05/06/16.
Be sure to check out the latest BCI Training Videos and “Ask Alan” segments. You can view them at The Blue Collar Investor YouTube Channel. For your convenience, the link to The Blue Collar Investor YouTube Channel is:
http://www.youtube.com/user/BlueCollarInvestor
Since we are in “Earnings Season”, be sure to read Alan’s article, “Constructing Your Covered Call Portfolio During Earnings Season”. You can access it at:
https://www.thebluecollarinvestor.com/constructing-your-covered-call-portfolio-during-earnings season/
Best,
Barry and The Blue Collar Investor Team
Thank you Alan,
I agree with you 100%.
When I buy a stock for 29.00, if I can sell the one month 30.00 call for .75, my ROO is 2.65% which is great.
If the stock goes up to 33.00 I feel wonderful, because I can make 1.75 and my ROI is 6%, which is phenomenal.
The money left on the table is irrelevant.
I only wish I could accomplish such trades each month, at least 7 times out of 10.
My biggest problem is hanging onto a loosing trade until it’s too late, and my loss is too big….. sniff, sniff…..
Roni,
Setting a limit order immediately after entering a covered call trade forces us to buy back the option at the appropriate time. For example, if we sold an option for $2, we can immediately place a buy-to-close order at $0.40 (20%). If the limit order is not executed, we can change to BTC order at $0.20 midway through the contract. If the short position is closed, we can wait to “hit a double”, roll down or sell the stock based on the criteria shown in my books and DVDs.
Now wipe away those tears…
Alan
Thanks again Alan,
I always follow the 20%/10% religiously, but I’m very slow to decide the next step.
Here is a live example :
I bought 100 PANW shares on 05/02 @ 150.00 and sold the 05/20 150.00 call for 5.00.
Next, I bought it back for 0.85 on 05/04, nice gain of 425.00 in 2 days, but, what now ?
PANW goes further down to 135.00 last Friday, my paper loss is 1,025.00, and I hesitate. Finally I did nothing, and risked to lose more.
Today PANW is up to 138.65 as I write, and I must decide:
Wait to hit a double ?
Roll down to mitigate losses ?
Close the position and use proceeds to enter a better trade ?
That’s what I mean is my biggest problem but I know it could be much worse if I had not sold the covered call, which mitigates the loss if I decide to close the position now.
Roni,
I say hold your PANW shares longer while uncovered. Already making a recovery move off support today. It’s the darling stock of a darling sector – Cyber Security – it just got ahead of itself and suffered some profit taking.
I can’t imagine anyone a year from now kicking themselves for owning 100 shares of PANW :).
If you want to band aid your cost basis with calls don’t do it for less than your original strike of $150 at purchase price. This is a volatile stock with a good story. You don’t want to roll down unless you think something other than normal profit taking and seasonality is going on with it. – Jay
Feels real good to have your support Jay.
I apreciate it.
Cheers – Roni
Roni,
Thanks for your always fine and fun comments! This is another great blog by Alan. Anyone new to covered calls or anyone once jaded on them like I was should read it a couple times.
I started selling covered calls in 2013. I used growth stocks and found myself with the nice “problem” of many going up past my OTM strike most months in that bull year. Yet I was under performing a hot index by either “losing” the extra appreciation or paying to keep it by rolling up and out. And I still felt the pain minus the premium of poor performers.
The mistake I made then was to question the strategy instead of my expectations for it and my knowledge of all it’s tactical variations. Fortunately I studied it more instead of quitting.
I do many things differently now. I take positions in even lots of 200 shares so I can start with flexibility each month. Do I want to write against none, half or all of this position? If on all do I split the strikes between ITM, ATM or OTM? If on half I am on the fence and usually sell near the money as a hedge.
I also watch ex-div and earnings dates making certain I use weekly steer arounds if writing. If I skip writing that month I am very bullish on the stock. Then I manage any covered positions with exit strategies.
Had I done those things in 2013 I am certain my returns would have been better. May still not have beaten that run away index but my chances would have been greater.
I am glad I did not let my initial frustration with the strategy prevent me from studying it more deeply. The conventional “wisdom” about covered calls is they cut your winners short while your losers fall.
I’ve had that debate with friends. Plus I felt that way in 2013. But what I found is there are many ways to make options selling an all season sport if one invests study time into the game. – Jay
Jay,
your coments always give me hope.
Trading the stock market is always fun, and really very interesting.
I feel that I’m learning from you guys and from my mistakes, and I know that it will be much more fun when I improve my timing and achieve consistent gains.
Roni
Premium Members,
The Weekly Report has been revised and uploaded to the Premium Member website. The “NTM” column was updated. Look for the report “Weekly Stock Screen And Watch List 05/06/16-RevA.
Best,
Barry and The Blue Collar Investor Team
Enjoying learning from and using the service.
I recently did a buy/write on a Bold Running List stock. By the end of the 2nd week, (of 5 weeks to expiration) the option met the 20% guideline, so I bought to close the position. Fundamentals and technicals still looked favorable, though quite not as good as when I originally wrote. Based on that, I thought it likely the stock would rebound, so I wrote a new, slightly out of the money call option, at a lower strike price of course. Was that a mistake, too aggressive, considering the stock had decreased in market price so quickly and the general market was less favorable than two weeks prior? Would a more seasoned BCI have sold the stock there and moved to another? Not asking for a specific stock analysis, but general guidelines in similar situations.
Thanks much.
Jim
Jim,
Assuming no egregious news coming out about the company (may consider selling the stock) and also assuming the stock was not dramatically under-performing the overall market (S&P 500) and with 3 weeks remaining to expiration I would consider:
1- Waiting a few more days for a stock rebound to sell the same strike (“hit a double”)
2- If during week 3 of a 5-week contract the stock does not rebound, rolling down as you did or selling the stock is in play
3- In choice #2, if the stock is significantly under-performing the market, I lean to selling the stock
Alan
Alan, I am first confirming previous Qu.3 and Qu.4 where you say “Comparing the momentum of the S&P500 to a particular security can be useful as well as an additional small component to our decision-making process”. – My understanding is that this could be in relation to the ‘stocks RSI’ compared to the ‘S&P500’s RSI’ figure to determine which one is performing better. Hope this is what you mean.
And to Qu.4, where the “cash available” as you describe is the value of the stock just sold to then be used for the next replacement stock, hope that is also correct too.
If I am wrong for my confirmations above then can you suggest to me otherwise(?)
There are 5 questions I need to get through this time just to finish off these topics.
1. Now I want to bring you back to an answer I have for the MCU. When you say you want at least an extra 1% on the new stock mid-contract from the MCU(above the closed out return), then do you mean 0.50% for the remaining 2 weeks (making 1% for the whole month), or 1% for the last 2 weeks (that makes 2% for the whole month)?
2. Isn’t it true that the total return from a MCU and then the new stock return should always be more than what my initial maximum return is if having sold an OTM strike?,- and if I figure out I can’t get more using a MCU then I shouldn’t go ahead with this strategy?
And now to ask you well basically about outperforming the market.
3. Would you find that your end monthly return is harder to beat the S&P500 when the market has risen a lot, compared to the market falling a lot, whereby your monthly return may be easier to beat S&P500?(for instance market down 4% for the month and your return is say -2%, but market up 4% yet here return maybe just 2.5%?)
This is what I have noticed- perhaps due to the strike price capping the gains. Would like to know if you experience this and should we all expect this too?
4. Should I try to outperform the S&P500 each year by a minimum percentage(like 3%, 5% or so),- and if so then by how much percent you think?
5. And last one of this lot;- so it is my guess that it would be harder to outperform the market each year if for 6-months I was just with stocks, while the other 6-months were all with ETF’s would it not?(or even a mix of both each month?)
I will soon just for my own record email you about the stocks cost-basis for in different trading situations.
I’ll give you a break for now to break this monotony, but I must say I am very grateful for all this knowledge I’m gaining. Feeling quite a bit more confident in this strategy then when I first came upon it several years ago. Thank you
Adrian,
Comparing to S&P 500: A better choice of words (on my part) would have been “price-performance”
Replacement stock: Yes, that’s right.
1- I look for 1% over and above the profit generated from my initial position.
2-Correct. The purpose of the MCU exit strategy is to generate higher than a maximum return. If that cannot be achieved, let’s not spend the small amount of time value that remains or the broker commissions.
Will get back you are 3,4 and 5.
Alan
Adrian,
3- Normal to bull market environments are ideal for us. In many cases we generate 2 income streams for our trades, one from option premium and the other from share appreciation from current market value to the out-of-the-money strike. You are referencing scenarios when share appreciation is greater than those 2 income streams combined. It happens and this is, in fact, the main disadvantage of covered call writing but overall (in my humble opinion) the advantages far outweigh the disadvantages. Now, if we had a “raging” bull market and all positions are appreciating exponentially, then just buy the shares or write way out-of-the-money strikes. But that’s not the norm so we continue to hit singles and doubles in most market environments. Maximizing our trade returns is a positive!
4- I have beaten the S&P 500 every year for over 2 decades. The amount depends on our personal risk tolerance and how we invest. More aggressive investors will have loftier goals. For this reason, I can’t give a specific percentage but I will say that in most years we should beat the market or we have not mastered all 3 required skills (stock selection, option selection and position management).
5- I would disagree with this hypothetical. We should out-perform the market whether we use stocks, ETFs or a combination of both.
Alan
Alan,
when rolling down or hitting a double do you concern yourself with the return percentage of the second premium? How do you determine a decent second premium? Some times I find myself rolling down only to make slightly more than the cost to buy back the option. (E.g. buy @.25 sell @.40) Any guidline to that?
Nate,
It’s really all about the time remaining in the contract. It’s important to remember that Theta causes time value to erode to zero by expiration for all options. If we find little or no differences between time values it may be because we waited too long to act before time value had reared its ugly head and wiped away most of the time value for all strikes.
For looking to hit a double, it’s also about the time. We give the stock a few days or maybe even a week to recover as long as we are in the first half of a contract. I always like to generate a net options credit when “hitting a double” If share price continues to decline, there’s always rolling down.
Now I created a screenshot below to clarify rolling down:
We’ll make an assumption that HD was trading at $140.00 when the covered call was initiated. Also assuming a 2%, 1-month return, we generate $280/contract from the initial option sale. Now today the stock is trading at $137.51 or down $2.41. If we rolled down we would generate an additional option credit of $87/contract ($2.14 – $1.27) for a total option credit of $3.67. Our current stock price position is down $2.49 leaving us with a current net profit of $3.67 – $2.49. Rolling down solidified our winning position.
CLICK ON IMAGE TO ENLARGE & USE BACK ARROW TO RETRN TO BLOG
Alan
Members,
I just returned from hosting 2 seminars and a book signing in Las Vegas. Really great to meet so many BCI members. The image below is of the master’s class I taught…great group. I’ll be catching up with emails during the week but then heading to Baltimore this weekend for another presentation.
CLICK ON IMAGE TO ENLARGE & USE BACK ARROW TO RETRN TO BLOG
Alan
Thanks Alan I have seen the answers and they were how I expected them to be.
I will presume that your answer of ‘1% over and above the profit generated'(Qu.1), was meaning for the remaining 2 week timeframe(so based on a 2% for the month), I am sure that’s right? Thanks
Adrian,
Yes correct, stats based on initial returns.
Alan