
Covered call writing generates monthly (or weekly) cash flow but it also reduces our cost basis. The latter result is the reason why covered call writing increases our chances of a successful trade more so than simply owning the stock. Historical data tells us that in the long haul the stock market increases in value. In the short term…who knows? There are too many moving parts to accurately predict near-term stock movement consistently. The BCI methodology is based on a 3-pronged screening process and a requirement to master 3 skills:
- Stock selection
- Option selection
- Position management
Meeting these system requirements will not guarantee a successful trade in the near-term but it will throw the odds dramatically in our favor. This means that despite all our efforts, share price can move lower and into a losing position. So, is covered call writing an appropriate strategy for recovering these losses by reducing our cost basis? This article was inspired by Jacob K who shared his trade with me on February 8, 2017.
Jacobs trade and dilemma
- Buy 40,000 shares of Blackberry (BBRY) at a cost basis of $9.40
- Stock currently trading at $7.25
- Unrealized share loss = $86,000.00
- Looking for a low-risk way to reduce cost basis to mitigate losses
Factors to consider
1- Is this part of a portfolio overwriting strategy where we want to hold these shares for the long haul despite price movement?
In this case we immediately turn to covered call writing that is tailored to this specific goal. We use only out-of-the-money strikes and circumnavigate around earnings reports as well as ex-dividend dates. If the strikes sold are in-the-money as expiration Friday approaches, we roll the options. See chapter 14 in both versions of the Complete Encyclopedia for more details on this strategy.
2- What if the stock is not necessarily a long-term hold?
This is where many retail investors fall into a trap including yours truly back in the day. The dangerous thinking here is that the $86,00.00 loss is not “realized” until we sell…so don’t sell. We know that share value will always come back just like WorldCom, Bear-Stearns, Enron, and Tyco…oops, were those bad examples? Let’s look at the chart of BBRY as of 2/10/2017:
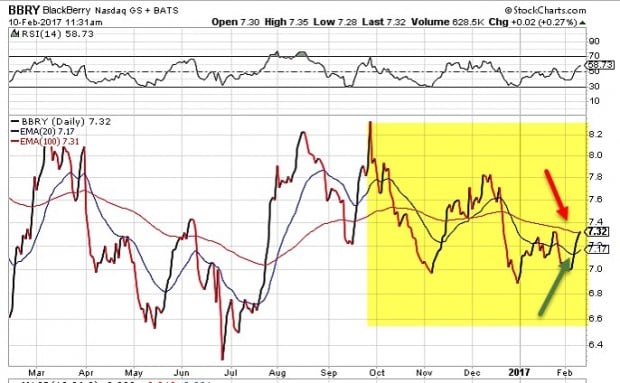
BBRY: 1-year Chart as of 2/10/2017
Note that the longer-term 100-d EMA (red arrow) is above the shorter-term 20-d EMA (blue arrow), a bearish short-term technical signal. Now, there are other factors to consider so this may still be a security we want to keep in our portfolio but it will make us all better investors if we give ourselves the flexibility of selling losers when appropriate (pardon the sarcastic Enron etc. references…I like to humor myself when I write these articles). The takeaway here is to remember that it is the cash we care about, not the stock that it is invested in.
3- Is there concern regarding assignment risk?
When we write a covered call (400 contracts in this case) there is always a chance of early assignment. That’s where two of the three required skills come into play…option selection and position management. We select out-of-the-money strikes that meet our monthly goals, circumnavigate around earnings dates and ex-dividend dates when applicable. BBRY does not distribute dividends as of the writing of this article. Should share price move above the (originally) out-of-the-money strike, we must roll the option prior to 4 PM ET on expiration Friday.
Discussion
New Blue Hour webinar uploaded to your premium member site
Blue Hour # 6 has been added to the member site. It is titled “Bear Market Strategies” One of the advantages of option-selling is that it can be crafted to succeed in most market environments. This webinar addresses how to set up and manage our covered call writing and put-selling portfolios in bear and volatile market conditions.
Login to the member site and scroll down on the left side as shown here to access this and all other webinars:
Location of Blue Hour Webinars
Next live events
- Dallas Texas: October 5, 2017
- Palm Beach Gardens Florida: October 10, 2017: Information to follow
Market tone
Global stocks moved up slightly this week, with major US indices once again setting new highs. The price of West Texas Intermediate crude oil rose over $3 a barrel to $49.65. Volatility, as measured by the Chicago Board Options Exchange Volatility Index (VIX), rose to 10.29 from 9.9 a week ago. This week’s economic and international news of importance:
- US economic growth increased in the 2nd quarter, rising 2.6%, up from the first quarter’s 1.2% pace
- Modest growth averaging around 2% looks to be likely again in 2017. This should keep the US Federal Reserve on a gradual rate-hiking path
- The Fed indicated it is ready to begin trimming its balance sheet
- The Fed held rates steady while acknowledging that inflation is running below its 2% target.
- The International Monetary Fund maintained its forecast for 3.5% growth in gross domestic product this year. The fund lowered its outlook for US growth to 2.1% from a previous reading of 2.3% while raising its outlook for the eurozone and Japan. It downgraded its outlook for UK growth
- Now that the health care bill has been defeated, Senate leaders hope to move on to tax reform and to passing a spending bill in order to avoid a government shutdown at the end of September
- President Trump reiterated his desire to slash the US corporate tax rate to 15% from 35% while lowering the tax burden on the middle class
- Congressional leaders and administration officials agreed to table the border-adjustment tax that would have taxed US imports
- Credit rating agency Moody’s has upgraded its outlook on the Chinese banking system to stable from negative
- According to Thomson Reuters, with 48% of the members of the S&P 500 Index reporting, second-quarter earnings are expected to rise 10.7% versus Q2 2016
- Revenues are expected to climb 4.9Forthe week, the S&P 500 rose by 0.54% for a year-to-date return of 10.44%
For the week, the S&P 500 moved down by 0.02% for a year-to-date return of 10.42%
THE WEEK AHEAD
Mon, July 31st
- Japan Industrial production
- China Non-manufacturing purchasing managers’ index
- Eurozone Unemployment report, consumer price index
Tue, August 1st
- Global Manufacturing purchasing managers’ indices
- Eurozone Q2 preliminary gross domestic product
- Personal income, spending, personal consumption expenditures
Thu, August 3rd
- Global Non-manufacturing purchasing managers indices
- Eurozone Retail sales
- United Kingdom Bank of England rate-setting meeting
Fri, August 4th
- Employment report
Summary
IBD: Market in confirmed uptrend
GMI: 5/6- Buy signal since market close of July 13, 2017
BCI: I am currently favoring out-of-the-money strikes 3-to-2.
WHAT THE BROAD MARKET INDICATORS (S&P 500 AND VIX) ARE TELLING US
The 6-month charts point to a mildly bullish outlook. In the past six months, the S&P 500 was up 8% while the VIX (10.29) moved down by 13%.
Much success to all,
Alan and the BCI team


Alan,
Most of the stocks that I have been purchasing have weeklys – rather than buying all at once at the start of the contract cycle, I have been buying 1-2 stocks per week (mostly sticking to the IBD Big Cap 20) and then writing a call. I have been doing this over the past month so each week I have a call(s) expiring, and buy a new stock. Is there any downside to this approach?
Also, I would love to see a future video on portfolio management.
thanks
Jay M
Jay,
If this approach to covered call writing meets your trading style and you are consistently beating the S&P 500, then it is appropriate for you and all others with similar goals and results.
The advantages include having the opportunity to re-evaluate positions on a weekly, rather than a monthly basis, PERHAPS the possibility to generate higher annualized returns, and the ability to easily circumnavigate around earnings reports and ex-dividend dates.
Disadvantages include less opportunity for our position management techniques, rolling considerations on a weekly rather than a monthly basis, a smaller pool of stock to select from, lower option liquidity and larger bid-ask spreads in many cases and quadruple the number and amount of trading commissions.
I have had the greatest success over the past 2+ decades selling monthly options that expire on the same date (1-month expirations). This does not make me right or wrong. We must find the strategy and approach that meets our trading style, return goals and personal risk tolerance.
Alan
Just to clarify, I always write the call option 3-4 weeks out – not just for that week. Therefore I have been able to use your exit strategies. I guess the best way to phrase it would be to say I stagger my purchases each week – but always write a call with a 3-4 week expiration.
Jay M,
Hey, a quick P.S.:
Another thing I like about what you are doing is the weekly IBD Big Cap 20 is not stagnant – just as the Premium List here is not either. So if you are at the end of a multi week cycle or in an exit strategy situation and see something that is new or looks attractive that week you can roll out of the old and into the new.
That IBD list fits between the Premium and Blue Chip lists here with occasional over lap. Plus all the Big Cap 20 will have weeklies with decent liquidity.
Interesting idea for those of us who use covered calls as a go to strategy, have the little extra time it would take and do not mind trading every week instead of regular expiry to regular expiry with usually just exit strategies in between. Thanks again. – Jay
Jay,
I see…you are using a hybrid approach using stocks that are part of the expanded weekly option program, all 1-month out but staggered. I see pros and cons as with all strategies. The question becomes will the extra time and effort (rolling decisions every week, for example) be justified by higher returns? You may want to set up 2 portfolios, one with traditional monthlys, all expiring on the same date and the other with this hybrid approach.
I admire the fact that you are thinking outside the box and would appreciate if you keep us in the loop regarding your results.
Alan
As a matter of interest is there a list of the IBD 20 somewhere?
Justin.
The IBD Big Cap 20 is published/updated Tuesdays if you are an IBD subscriber. Barry and I discussed this list a while back and he now consults it along with the IBD 50. – Jay
Thanks Jay! Btw your strategy of buying a stock and then selling a call or put depending on whether it moves up or down sounds intriguing – has Alan given you an opinion on that yet?
Justin
Jay M;
One slight negative to this approach is that there could be less volume and higher bid-ask spreads with the weeklies as opposed to the monthlies.
Best;
Terry
Jay M,
Last I knew, there were about 350+ stocks with weekly options and they tend to be the “big boys” so you should have a decent sized pool to choose from. I suspect that when selecting them to offer weeklys, the OIC/OCC etc. wanted a diversified sector representation and since some sectors don’t have any “big boys”, there are some that are very illiquid with very wide B/A spreads. Large cap stocks like KO, MCD, XOM, etc. have tight spreads and decent open interest.
Using weekly options 3-4 weeks out and staggering them has advantages and disadvantages.
ADVANTAGES
1) You have the potential to generate a higher ROI since you are usually collecting more premium per day (less so if implied volatility is low)
2) Because you are staggered, you don’t have to deal with every position on the same expiration
3) Time premium is related to the square root of time remaining and it really falls off the table during the last week so you might be able to catch the majority of the premium in the first 2 weeks of a 3 week expiration and then roll.
4) Easier to avoid earnings reports
DISADVANTAGES
1) Lower premium means less downside protection
2) More frequent trading means more frictional costs (B/A spread and commissions). If you have a lot of positions, you’ll need a very deep discount broker.
Of all of these, I think that the main achievement is the staggering, especially if you have a lot of positions. As for the rest of them, you can easily determine how effective your approach is by comparing it to a standard one month write at the same strike on the same issues. That’s just numbers :->)
Spin
Jay M,
I like your approach. Thanks for sharing, please let us know how it fares vs. the S&P with a few months run time.
Seems if you are putting the same amount in the market in any given month on about 8 positions with ongoing weekly entry dates but still trading monthly not weekly duration options you will have more management and exit strategy time to spend but commissions should not be much different. And you get a kind of “dollar cost averaging” effect on your purchases as the market moves week to week.
I wish you well with it! – Jay
OOPS, my reply and P.S. are out of time sequence here. Sorry 🙂
Premium Members,
This week’s Weekly Stock Screen And Watch List has been uploaded to The Blue Collar Investor Premium Member site and is available for download in the “Reports” section. Look for the report dated 07/28/17.
Also, be sure to check out the latest BCI Training Videos and “Ask Alan” segments. You can view them at The Blue Collar YouTube Channel. For your convenience, the link to the BCI YouTube Channel is:
http://www.youtube.com/user/BlueCollarInvestor
Since we are in Earnings Season, be sure to read Alan’s article,
“Constructing Your Covered Call Portfolio During Earnings Season”. You can
access it at:
https://www.thebluecollarinvestor.com/constructing-your-covered-call-portfolio-during-earnings-season/
Premium Members note, a new Blue Hour webinar has been uploaded…
Blue Hour # 6 has been added to the member site. It is titled “Bear Market Strategies”. One of the advantages of option-selling is that it can be crafted to succeed in most market environments. This webinar addresses how to set up and manage our covered call writing and put-selling portfolios in bear and volatile market conditions.
Login to the member site and scroll down on the left side.
Best,
Barry ([email protected]) and The BCI Team
Alan and Barry,
I just watched the blue hour video on bear markets. Thanks for this clear explanation how to use these strategies when market forces are against us. I now feel that have more control of my investments based on market conditions. Keep up the good work.
Marsha
Marsha,
Thanks very much…Alan
In your book you mentioned that the IBD 50 list is your first source for selecting a stock.
But, a quick check, shows that the following stocks you recommended in your last Weekly Stock Screen And Watch List 07/28/17, do not appear in the IBD 50 list.
How can I trust those stocks to sell a cover call?
Thank you for answering my question.
Denis
Denis,
Prior to 2010, the IBD 50 was actually the IBD 100. At that time, it was easy to locate a substantial watch list from that resource. In my Complete Encyclopedia (classic version, page 32) I mention that other resources like IBD’s CANSLIM can also be used. Once the list was streamlined in 2010, we started compiling our own list of stocks that at one time were great option-selling candidates. That file now has over 3000 stocks in it and my team screens that list along with the IBD 50 each week for our members. Hence you see IBD 50 and “other” stocks listed. The screening process is precisely the same for every stock we evaluate (IBD SmartSelect, technical analysis etc.).
You can be confident that all stocks have passed the rigorous BCI screening process and should be treated equally whether from the IBD 50 or from our “other” database (usually an overlap).
Alan
Denis,
In addition to Alan’s comments, we also use IBD Big Cap 20. When a stock first appears on our list, it will have come from:
– IBD 50
– IBD Big Cap 20
– “Other”
As for the IBD lists, they change regularly. However, once a stock makes the list, it is rescreened every week until it fails for three (3) weeks in a row…at which time it is removed and detailed in the “Stocks Removed…”.
If a stock continues to pass our screening but does not appear on one of the lists mentioned above, I indicate it with “PRW” or “Passed Recent Weeks”. So there can be four sources for a stock in any given week, They are:
– IBD 50
– IBD Big Cap 20
– Other
– PRW
I hope that this answers your question. If not, please get back to me.
Best,
Barry
Alan, just watched the latest Blue Hour and loved everything about it. Obviously the content was exceptional even by your standards. I have to say you and Barry are elevating your game all the time in production. I am a sucker for beach sounds and sea birds.
I have a feeling your bear market subject matter may be timely….at least for the summer. I found it very helpful.
Speaking of summer I hope you are enjoying yours.
Great work!
Regards,
Ron
Ron,
Much appreciated. Kudos to my team for the quality of these productions.
Alan
Great to see all the comments so quickly even before the Opening Bell!
Barry – FYI – Had to leave a comment because the Subscribe Link to the Blog was coming back with (Always worked before):
Not Found
The requested URL /comment-subscriptions was not found on this server.
Mario,
We haven’t heard any other subscribers having this issue. So, I sent you a copoy of the weekly report to your email address.
Best,
Barry
Jay M:
Thanks for bringing up the Weekly trading issue.
Running Weekly Options seems like a very heavy work load if you have a large portfolio and want to stay 90%invested . If you are just trading 2 positions weekly that is probably ok.
Hmm, Maybe I should just try to trade 1 position weekly to see the actual process in operation.
How successful have you been with it so far? Hitting your targets? If you can get 2-3% monthly with decent volatility, what do you see on a weekly basis?
Analysis – 20,000 Investment at ROO 2.5% per month or 0.625% on a weekly basis:
Monthly:
* Investment: $20,000
* Gain; $500.00
* Yield as percent of Total investment = ROO%: 2.5%
* Based on $12 Commission impact per monthly trading cycle::
** 0.06% of Investment
** 2.4% of your actual again
Weekly:
* Investment: $20,000
* Gain: $125.00
* Yield as percent of Total investment = ROO%: 2.5%
* Based on $12 Commission impact per weekly trading cycle:
** 0.06% of Investment (12 / 20000)
** 9.6% your actual gain (12 / 125)
Normalizing the weekly results on a monthly basis for comparison purposes:
* Investment average: $20,000
* Gain of weekly adjusted per month: $500 (4 x 125)
* Commission of weekly on a monthly basis:
** Commission: $48
** 0.24% of Investment (48 / 20000) (Compares to .06% for monthly traders)
** 9.6% of actual gain (48 / 500) (Compares to 2.4% to monthly traders)
Conclusions:
An initial conclusion is that you should strive to get a very low commission broker with weekly trading.
Another observation is to make sure you select stocks so you can trade more than 100 shares to lower the effects of the commission.
Mario G.
Mario,
I’ll be using one of your past trades as a learning tool in the next blog article. Thanks for sharing.
Alan
Mario, you are right, at this pace this blog may be at over 100 posts by Friday and set a new record :)!
Jay M, thanks for getting this party started :).
I think some of our friends may be over complicating your tactic. But please correct me if I over simplify it or get it wrong. You are not saying you are a weekly over writer. You are saying you buy on a rolling weekly basis then cover for about a month out on each position. That means you are buying and either closing or rolling something every week. That takes a knowledgeable covered call writer to do but you are doing the same thing many others do monthly just staggering your dates.
I really like the idea. A far fetched analogy is it is like laddering CD’s or bonds.
I may start a similar program with a small amount of QQQ this week. And speaking of the new week, a great one to all. – Jay
Jay/Justin,
If one is staggering one month writes rather than writing all of them for the same monthly expiration, the only advantage is distributing the time involved over 4 weeks instead of being concentrated in one week. In terms of return, I think it will be insignificant, one way or the other.
The concept of selling calls after a rise and selling puts after a plop is like a day at the zoo: Buy sheep and sell deer!
Spin
Thanks Spin,
Happy Monday and I hope you had a nice weekend.
I like the Zoo. You rarely see an unhappy person there :).
I am Tech heavy and got clobbered again today, With Trump imploding the Blue Hour about bear markets was timely. – Jay
Jay,
Weekends are nice buy I always look forward to Monday morning since I’m not cut out for watching soap operas and popping Bon-Bons all day 🙂
If you decide to visit the bear at the zoo, consider hibernation (reduce/eliminate long positions). If you want to play with the bear, either find a good collar or find a way to own negative delta (long puts, short stock, bear spreads, long inverse ETFs, etc.). If you’re long much delta, the bear will enjoy the meal (you).
Spin
Spin,
Cool Whip goes great on Bon-Bons. Please give that a try while watching “Days of our Lives” 🙂
I know you and others get my jokes!
The market is scary. But that always means opportunity…-Jay
Jay,
You made a some jokes??
(vacant Valley Boy stare 🙂
Spin,
Valley Boys would not have your wit but thanks for the funny reply – Jay
Jay,
I’m trying ‘The Jay Way’ with STLD – bought the stock Monday @ $35.03 and giving it a chance to choose a direction before selling a call or put. It’s been consolidating the last eight months during a long term uptrend so it still looks healthy technically if anyone’s looking for trade ideas.
Since time value is deteriorating quickly at this stage, do you normally try to get your options written early in the first week when using this method?
Justin
Hi Justin,
your STLD trade looks very interesting to me.
You could sell the STLD 08/18/2017 35.00C right now for 0.80, ROO = 2.3%, and only 11 trading days remaining.
The big time value decay starts next monday, so you ought to be in great shape.
I suggest you don’t wait any longer.
Roni
Roni,
Yes the clock is ticking down, though based on STLD’s price history there must be a good chance of at least an intraday spike soon. Actually I’d have been going much better this contract period if I’d applied Jay’s idea of waiting until the next day on all my positions, though if they expired today I’d still be doing ok (pic attached):
Justin
Justin,
your STLD trade idea got me tempted, but I was fully invested.
So I decided this morning to sell my 300 ADI shares, which had gapped down last week.
My loss was 948.00, mitigated by 420.00 from 3 calls (sold for 180.00 each, and bought back last week @ 0.40).
Total loss = 528.00
I then used the cash to buy 800 STLD shares @ 35.16, and sell 8 STLD 08/18/2017 C for 0.90 = net ROO 0.74 = 2.16 %.
If all goes well, by expiration, I hope to make 592.00, minus aprox. 30.00 comissions = 562.00, and recover my loss from the ADI trade.
Roni
Off to a decent start then Roni! – I’ve decided to hold off until Monday as STLD looks like it might be starting to run again, and US Steel (X) could help inspire it as well, being up 2.5% Friday.
Justin
Premium Members:
This week’s Weekly Stock Screen And Watch List has been revised and uploaded to The Blue Collar Investor premium member site and is available in the “Reports” section. Look for the report dated 07/28/17-RevA.
The revision and update was due updated Risk/Reward data. As a result of the update, only one stock, PETS, changed from “Passing” to “Failing” this week.
Best,
Barry and the BCI Team
[email protected]
Allan
I bought two of your excellent books
I have two questions to ask you
The first question relates to how much premium Will be collected by investors selling covered calls in the future Don’t you think that as more and more people sell covered calls the premium that we can collection Will be far less ?
I asked the same question to the manager of the website who replied to me that it will not be a problem because even if that does happens option prices would decline thereby enticing more people to buy options pushing prices back up but i would like to have your take on this ?
Second question and probably more far-fetched I just finishing reading an article about automation replacing financial traders in the future do you think this is a likely scenario ?
Thanks again
Thomas
Thomas,
My responses:
1- I do believe that the use of options will continue to increase in popularity, especially in these low-interest rate environments. I view this only as a positive. As option liquidity increases, bid-ask spreads will decrease and it will become much easier to leverage the “Show or Fill Rule” to negotiate better option prices. Every trade has a buyer and a seller and premium will be dictated by the volatility of the underlying security and the time to expiration…those factors will not change.
In addition to these factors, enhanced option liquidity is causing broker commissions to be reduced as competition for our business heats up and will become more intense moving forward. I do believe that eventually, commissions will move to zero and brokers will profit from the bid-ask spreads.
2- I also agree that automated trading will increase moving forward. This will probably hurt financial advisors to some extent but will not hurt us. The talented and ethical advisors should still thrive. Software programs that dictate investment choices are only as good as the algorithms inherent in those programs. In my view, they can never be as productive as pro-active decisions based on current information and then the ensuing management we know to be critical to our success. Increased auto-investing will give us an edge, in my view.
To sum up: In my humble opinion, I view both concerns as positives for those of us who use the power of education to self-invest in a pro-active manner.
Alan
Alan,
You mentioned volatility and time to expiration as premium factors. Since we are using one month expirations how do we decide on the best volatilities to look for?
Thanks,
Marsha
Marsha,
The appropriate implied volatilities (IV) of our underlyings will vary from investor to investor depending on trading goals and personal risk tolerance. It is not necessary to look up IVs but rather view the percentile returns for the near-the-money strikes we are considering. As an example, for my return goals and personal risk tolerance, I target 2-4% for my 1-month initial time value returns. In my mother’s (even more conservative) covered call portfolio I target 1-2%. In strong bull markets, I will go a bit higher, up to 6% in some cases.
The IV is inherent in these percentile returns and will keep us within the framework of our risk tolerance and target goals.
Alan
Alan and Spindr0,
Thanks for your responses. I do use the fundamental, technical and common sense analysis for stock selection described in Alan’s books. From there, I use strike selection based on market analysis and chart technicals. This is where volatility plays a role in my investments. In my opinion, the biggest piece of this puzzle are the exit strategies which I never before considered until I found the Blue Collar Investor. Keep up the good work.
Marsha
Marsha,
Volatility analysis is complex and is necessary for more complex option strategies. And while implied volatility and premium are directly correlated, as a covered call seller, you should not be trying to look for the “best volatility”.
In general, selling a covered call is a neutral to bullish strategy. Your focus should should be on two factors. First, do your due diligence and select a fundamentally sound stock with good future prospects that you are willing to own.
For the option, look for a call with a strike price and premium that provides an acceptable sale price, an acceptable ROI, as well as sufficient downside protection. If you find that call, sell it. Boom! You’re done. It doesn’t matter whether than IV is higher or lower than normal IV levels. The transactional prices met your goal.
Selecting a stock for a covered call based only on implied volatility is not a substitute for these two very important steps.
Thomas,
There are many reasons for buying and selling options (long speculators, spreads, collars, straddles, strangles, hedging long or short equity, etc.) and covered call selling accounts for only a small amount of that volume. Options have been trading since 1973 (?) and since then. option volume has increased multi-fold across the board which means that the volume distribution across all strategies has increased as well. More people selling covered calls is not going drive premiums down.
Standard deviation (historical volatility) is backward looking. While it may be somewhat of a factor or starting point in the pricing of options today, implied volatility is more important since it is forward looking. Today’s auction determines the IV and how fat option premiums are.
As an aside, one might say that the price of the underlying increases an option’s price but that does not relate to option premium being higher/lower in terms of fatter or not (rlative to previous levels). Huh, you wondered (g)? Option premium is linear when all variables are fixed except price. If XYZ is $25 and the Sep $25 call is 40 cents, then if ABC is $50, the premium for its Sep $50 call will be 80 cents (same IV, same time remaining until expiration, no dividends affecting option premium). So while it is higher, it is exactly double, aka linear. Higher but not fatter.
Now if there is something on the horizon that induces increased buying (or selling) of options (pending ER or clinical trials release, expected resolution of a lawsuit, etc.) then the auction drives the IV and price of the options up (the Sept $25 call might rise to 50, 60, 90 cents or even higher). When the news is released, premiums tend to revert to prior levels.
Soto some extent, your web site manager is right. Isolated buying or selling may temporarily drive price away from current IV levels and the auction will tend to send it back there. But that’s not the prime driver of price. . We are currently at.near historic lows for the VIX (10+) with low IV for the options of most stocks. That’s the new normal. If this trend continues, the new normal will be lower and all premiums will be lower (not because there are more covered call sellers). And then there are bear markets: the VIX was 45+ in 1987, 40+ in 2000 and 60+ in 2008. Volatility changes and so will premiums.
Sorry this got so long in the tooth. the short answer is that the big picture will drive option premiums, not covered call sellers.
Spin
Hey everyone. I will try to explain the “Jay Way” a little better. My portfolio consists of 12 stocks – all with corresponding covered calls. When I began (week 1), I bought 3 stocks and immediately wrote calls on each (4 weeks in duration). Week 2, I purchased 3 more stocks and wrote calls on them (again 4 weeks in duration). I repeated the process each week. By the end of the month I had filled out my portfolio – then at the end of the 4 weeks, my first set of contracts are expiring and I continue the process. So I am not trading weekly per se, I just don’t confine myself to the contract cycle. Rather than buy all 12 stocks at the start of the cycle, I stagger my purchases so each week I am buying. The monthly commissions are the same whether I bought all 12 at once or staggered the purchases. To me it’s akin to ‘dollar cost’ averaging.
I screen the IBD50, IBD Big Cap 20, and the Value Line Investment Survey. My purchases must pass all of Alan’s guidelines (ER, technical analysis, smart select, etc) and have a Value Line safety rank of 3 or better. Once the purchase is made, I use Google Calendar to record the option expiration, ex-dividend date, ER, etc. I enter the transaction into the Adjusted Cost Base website for tax purposes. I really like the site because at the end of the year I can print a PDF that neatly outlines all my gains/losses for tax purposes and saves a ton of time. My broker’s website allows me to easily monitor my positions for potential exit strategies. The entire process only takes a few minutes and is not time consuming at all.
My returns so far have been around 2.5% – 3% per month, after commissions.
Hey Jay M,
Am old friend in my lost youth was, and may still be, a fantastic water skier. When I drove the boat he told me “Boring driving makes great skiing. Pick a point out there and go straight for it”
Funny how, decades later, that sounds like good investing advice!
Congrats on your excellent results. Since I am on record here saying I leg in and never buy/write same ticket your method has resonance with me.
Wishing you continued success, – Jay
Premium members:
This week’s 8-page report of top-performing ETFs and analysis of ALL Select Sector Components has been uploaded to your premium site. The report also lists Top-performing ETFs with Weekly options as well as the implied volatility of all eligible candidates. For your convenience, here is the link to login to the premium site:
https://www.thebluecollarinvestor.com/member/login.php
NOT A PREMIUM MEMBER? Check out this link:
https://www.thebluecollarinvestor.com/membership.shtml
Alan and the BCI team
Not very good premiums on the Spyder etfs.
Andrew, I have noticed that too. In this low VIX/IV environment you have to write on top of things or ITM to make it worth your while. And then if there is any gas left in this bull’s tank you will miss it. It’s a tough time to cover for premium but nothing lasts forever. – Jay
Executed 20% Rule on XBI and EWY – Batter’s up for “Hit the Double”.
Mario G.
Mario,
I have some XBI and EWY also. Because of the politics of the day regarding both Healthcare and Korea I did not cover them. In hindsight I should have at least covered half of each position. I try to buy at least 200 shares of every pick so I have that option or can ladder strikes and even expiry dates some times.
Thanks for your always informative update below. It is after market close Friday as I write this. I hope everyone had a good week. We shall see you on the next thread! – Jay
Hello Dr Ellman,
As you have pointed out, earnings reports can do a lot of damage. For example this week MELI missed estimates and got hammered. Likewise NTRI seemed to have exceeded expectations and still got hammered.
Would you consider either of such situations to now be a timely prospect for a put sale?
Thank you,
John
John,
I am firmly structured as to which securities I “allow” into my portfolio. They must pass the rigorous BCI screening process. Getting hammered after an earnings report does not necessarily eliminate these stocks from consideration but would make it difficult to pass our technical screens until recovery begins. Let’s see if they appear in the upcoming premium stock report.
Alan
8/4/17:
Another stock UCTT today met the 20% Rules (20% of Premium met) to buy back the Option leg. I automated it with a GTC order placed the day before.
Here is an update with statistics on the 3 stocks which hit the 20% Rule Threshold
Contract cycle expiring 8/18/17:
EWY:
7/21/17 Underlying Purchase Price when rolled on Exp. Friday: 71.37
8/3/17 Underlying price when 20% Rule (20% of Premium) was filled: 68.67.
Underlying Percent down: 3.78% (1-(68.67/71.37))
XBI:
7/27/17 Underlying Purchase Price: 80.3069
8/3/17 Underlying price when 20% Rule (20% of Premium) was filled: 76.82.
Underlying Percent down: 4.34%
UCTT
7/31/17 Underlying Purchase Price: 23.48
8/4/17 Underlying price when 20% Rule (20% of Premium) was filled: 20.79.
Underlying Percent down: 11.46%
****************
Here is what I posted last cycle (Expiration Friday 7/21) regarding 3 stocks that also crossed the 20% Rule threshold:
It’s interesting to calculate the Price decline of the Underlying from the Purchase date or Price of last Roll of the 4 stocks when they hit the 20% Rule: MGM Strike 33 (8%), MGM Strike 32 4,8%, QQQ 3.3%, ATVI 6.3%. Varies I am sure because of the volatility of the stock. Per Alan’s rules, you use the 20% rule irrespective of the OTM or ITM purchase type. ATVI was the only OTM stock and its drop was in the middle of the range.
************************
Analysis and conclusions:
Summarizing, here are the threshold percentages for the 6 stocks discussed:
3.78%, 4.34%, 11.46%, 4.8%, 3.3%, 6.3%
Average of the above: 5.66%
Of the 6 stocks, only one (6.3%) was an OTM Covered Call.
If one assumes that following ROO% (measured to the Strike) and adds an additional 0.05% to the Breakeven point (I have calculated the 0.05% average on several positions (OTM or ITM):
ROO% 2% position:
ROO% 2%, Breakeven +0.05% Total: 2.05%, then on average, there is a 3.61% loss (5.66-2.05) in the position when the 20% Rule is invoked and the stock is 3.66% below the strike.
ROO% 2.5% position:
ROO% 2.5%, Breakeven 0.05%, Total 2.55%. Average loss is 3.11% (5.66-2.55) and the the stock is 3.16% below the strike.
With a Covered Call, the investor executing the 20% Rule per the BCI Methodology holds on to the position if it has a mixed or positive tone or is just responding to general market or news events. One then waits for the stock to hopefully recover to its original purchase price and Sell another option (Hit the Double) for additional income in the same cycle (with some loss of time delay).
CSPut 3% Exit Comparison (Page 137 – Alan’s Selling Cash Secured Puts):
Comparing to a CSPut (Cash Secured Put) where it is recommended to Unwind the position if the Stock Price exceeds 3% below the strike, the numbers are very similar (3.16%, 3.66%) at the 20% Covered Call Rule threshold.
Mario G.