One of the BCI guidelines for selling covered call and cash-secured put options is that we require a bid-ask spread of $0.30 or less and/or an open interest of 100 contracts or more. Typically, options with large open interest will also be associated with smaller spreads. This makes it easier to close short positions at a reasonable price. There are times when we check option chains and find securities that have robust open interest but wide spreads. One of the reasons for such a discrepancy is the decreased trading volume that takes place in after-hours trading. This article will highlight such an event using a real-life example with Viper Energy Partners LP (NASDAQ: VNOM).
What is after-hours trading?
This is trading that occurs outside normal market hours (9:30 AM – 4 PM ET). Trading takes place through an electronic communication network (ECN) which allows buyers and sellers to match up trades (the highest “bid” price is matched with the lowest “ask” price). Trading volume is significantly lower after hours so bid-ask spreads are much wider. The wider spread is not a reflection of any change in the value of the underlying security but simply a matter of lower option trading volume.
Real-life example with VNOM: After-hours on May 18, 2018 prior to the June contracts
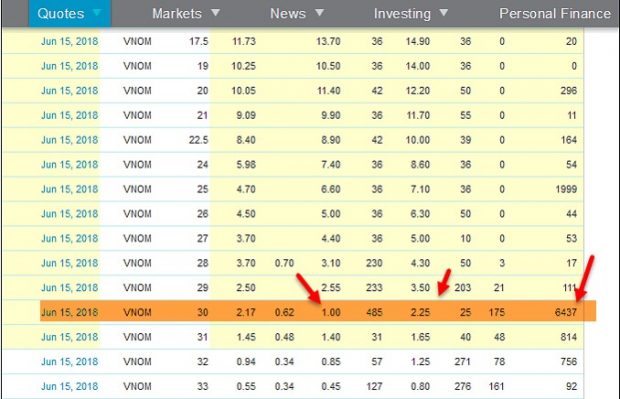
VNOM After-Hours Option Chain
Note the wide spread of $1.25 ($2.25 – $1.00) despite huge open interest (6437 contracts).
Real-life example with VNOM: Market-hours on May 22nd, 2018 during the June contracts
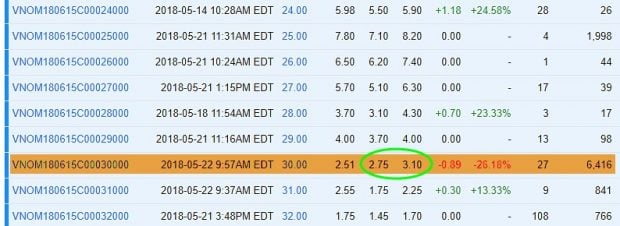
VNOM Option Chain During Regular Market Hours
Note the more typical spread of $0.35 ($2.75 – $3.10).
Discussion
When an option chain shows a wide bid-ask spread despite substantial open interest, it may be a result of lower trading volume that occurs in after-hours trading. Final trading decisions must be made with information confirmed during standard trading hours.
Upcoming events
November 2018:
The Blue Hour Webinar # 12: When to Roll our Covered Call Options
***Premium site…premium members only
February 7th – 10th, 2019
Orlando Money Show
Omni Orlando Resort @ Champions Gate
February 7th – 10th 2019
Speaking schedule:
1. Getting Started with Stock Options: Creating Monthly Cash Flow with Covered Call Writing
February 8, 2019, 3:10 pm – 3:40 pm
2. Getting Started with Stock Options: How to Select the Best Options in Bull and Bear markets
February 9, 2019, 2:00 pm – 2:45 pm
Market tone
This week’s economic news of importance:
- Personal income Sept. 0.2% (0.4% expected)
- Consumer spending Sept. 0.4% (as expected)
- Core inflation Sept. 0.2% (0.1% expected)
- Case-Shiller home price index Aug. 5.8% (67.0% last)
- Consumer confidence index Oct. 137.9 (136.4 expected)
- ADP employment Oct. 227,000 (218,000 last)
- Weekly jobless claims 10/27 214,000 (212,000 expected)
- Productivity Q3 2.2% (2.3% expected)
- Markit manufacturing PMI Oct. 55.7 (55.9 last)
- ISM manufacturing index 57.7% (58.7% expected)
- Construction spending Sept. 0.0% (0.2% expected)
- Nonfarm payrolls Oct. 250,000 (202,000 expected)
- Unemployment rate Oct. 3.7% (as expected)
- Average hourly earnings Oct. 0.2% (0.1% expected)
- Trade deficit Sept. -54.0 billion (-$53.6 billion expected)
- Factory orders Sept. 0.7% (0.5% expected)
THE WEEK AHEAD
Mon Nov. 5th
- Markit services PMI Oct.
- ISM nonmanufacturing index Oct.
Tue Nov. 6th
- Job openings Sept.
Wed Nov. 7th
- Consumer credit Sept.
Thu November 8th
- Weekly jobless claims 11/3
- FOMC announcement
Fri November 9th
- Producer price index Oct.
- Consumer sentiment Nov.
- Wholesale inventories Sept.
For the week, the S&P 500 moved up by 2.42%% for a year-to-date return of 1.85%
Summary
IBD: Market in correction
GMI: 0/6- Bearish signal since market close of October 8, 2018
BCI: Selling only in-the-money strikes until market recovery is confirmed. Remain confident in long-term health of the stock market.
WHAT THE BROAD MARKET INDICATORS (S&P 500 AND VIX) ARE TELLING US
The 6-month charts point to a bearish-to-neutral tone. In the past six months, the S&P 500 was up 5% while the VIX (19.61) moved up by 23%.
Wishing you much success,
Alan and the BCI team
Alan:
I have a question on what appear to be unusual characteristics
Of the options chain for the ETF Ticker = MJ, which was one of the ETF outlined in the last report on ETFs you posted to the website.
From Fidelity the option dates were listed as thus:
There is Nov 16 expiration, a Dec 21 expiration, a Jan 18 , 2019 expiration , then a April 18, 2018 expiration, a January 17, 2020 expiration and then a January 15, 2021 expiration. My question is: There appears to be a monthly set of options in 2018, then in 2019 only a January 2019 and April 2019 dates are listed and then further on only the January 2020 and January 2021 which suggests that they are LEAPS.
My question is: As time progresses do the monthly option dates for 2019 and 2020 become available on a rolling basis or will they never appear?
Sorry to be a bother.
Best regards,
Ed
Hi Ed,
Since MJ is the lead ETF in the Cannabis area I expect to see rapid expansion in it’s options offerings.
That said, I’m certain you know these funds are volatile and the components they hold are even more so – as anyone who follows the TLRY story has seen. Thus, in my opinion, I prefer them as small speculative ideas. But MJ may be established enough now to be a good cc/csp candidate?
In my experience, however, when I use those strategies on high flying, high premium, high volatility tickers it has not worked as well as using the more stable stuff while letting the ” Wild Things” in my account run free! – Jay
Ed,
Jay brings out an important point regarding the risk of various underlying securities. This risk can be quantified by viewing the “implied volatility” (IV) of the options in question. This is precisely the reason the BCI team provides IV stats for the eligible ETFs in our weekly premium member ETF Reports (pages 7 – 8) of these files).
This week’s report shows an IV for MJ of 66.18, the highest IV of all eligible candidates. The current range of IVs in the latest report starts at 7.23 and runs through 66.18 with the S&P standing at 20.11 (as of report publication date…Wednesday evening).
The advantage of high IV is higher premium returns. The disadvantage is greater risk to the downside. Each member must decide based on personal risk tolerance. One size does not fit all.
Thanks to Jay for focusing in on this critical point.
Alan
Thanks for the always kind words and prompt follow up, Alan.
It strikes me there are at least two ways to diversify a covered call – or any – stock portfolio: by sector and by implied volatility (IV).
For what it is worth for newer friends, things that are part of XLP, XLI, XLE, XLF or XLU, for example, are going to be lower IV and can be a base so one can stretch a bit in, say, biotech, semiconductors, new tech and MJ where the IV and the premiums are higher.
I doubt it is ever a good idea to just chase high premium all the time. Fun as that may be it will catch up with you :)! But having a beta/IV mix makes sense to me. – Jay
Ed.
For a good explanation of how stock are defined in the market with Jan, Feb, or March option expiration cycles and how new option months are added as time progresses, and where to find more information (Investopedia, CBOE), search the blog for the following keywords:
“cycles & month codes”
Include the quotes when you type in the above so the exact phrase is found.
The results will show a response that I wrote (mariog) dated May 12, 2018. Hope this helps.
Mario
Ed,
Yes, new option expiration dates will appear as others expire. Options are assigned to January, February or March expiration cycles depending on the underlying security. Each stock or ETF will have at least the current contract month and the next contract month plus 2 more depending on the cycle to which it has been assigned.
As options have become so popular, Weekly and LEAPS expirations have been added to many of these securities. If there is a demand for the product, they will be created, simple as that.
Here are links to articles that I published in the past relating to this topic:
https://www.thebluecollarinvestor.com/covered-call-writing-and-stock-option-expiration-cycles/
https://www.thebluecollarinvestor.com/weekly-options-standard-and-expanded-expirations/
Alan
Premium Members,
This week’s Weekly Stock Screen And Watch List has been uploaded to The Blue Collar Investor Premium Member site and is available for download in the “Reports” section. Look for the report dated 11/02/18.
Also, be sure to check out the latest BCI Training Videos and “Ask Alan” segments. You can view them at The Blue Collar YouTube Channel. For your convenience, the link to the BCI YouTube Channel is:
http://www.youtube.com/user/BlueCollarInvestor
Since we are in Earnings Season, be sure to read Alan’s article, “Constructing Your Covered Call Portfolio During Earnings Season”. You can access it at:
https://www.thebluecollarinvestor.com/constructing-your-covered-call-portfolio-during-earnings-season/
Best,
Barry and The BCI Team
barry@thebluecollarinvestor.com
Hi Allen.
During bear or bearish sentiment markets and you say you are selling in the money strikes. What do you base the strike on? A certain number of strikes below the current stock price, a certain percentage below the current stock price so it’s a set percentage of downside risk or a strike below the current that still provides you with a 2-4 percent return regardless of any downside protection percentage?
Thanks in advance,
Joe
Joe,
Here’s how I structure my in-the-money (ITM) strike selections:
1. Establish an initial time value return goal range. In my case, it’s 2% – 4% for Monthly options.
2. Check the option chain for ITM strikes that offer returns within the established range.
3. Select closer to the 2% return when additional protection is required (deeper ITM) and closer to the 4% return when market assessment is only slightly bearish (closer to at-the-money strikes but still ITM).
Once the position is established, we can then set limit orders to close the short calls using our 20%/10% guidelines.
Alan
Alan, hello. I’m a new member of BCI. I’m struggling with the “what now tab” in your elite calculator. It is related to the results that I’m getting on a Rollout and Up that I’m currently considering. The input data is the following:
Purchase 200 shares of SQ for $ 90.00
Sold a $76.00 Nov 9th Covered call for $2.02 The current price of the Stock is $77.76 I’m considering rolling out to Dec 07 $76.00 call for $ 7.30 The option buyback for the strike price of $76.00 on Nov 9th is $5.40. This is as of today 11/04/2018
Now my situation is that the calculator is giving me the comparative basis in the stock is $15,200. As I indicated I bought the 200 shares for $ 90.00 per share. How can it be the cost comparison is only $ 15,200 While I paid $18,000.
I verified the input date on the highlighted blue area and they look ok. Can you please help me on this.
I Appreciate your prompt response.
PS. I bought some books and videos following your recommendations. I’m looking forward to received them and learning a lot.
Americo
Americo,
The issue is with the numbers entered. The “Stock Price” we enter is the price of the security at the time the trade was entered, not at some past date. For example, if we purchased SQ in 2015 when it was priced at $12.00, we wouldn’t enter $12.00 as the stock price when entering a covered call trade 3 years later.
That said, we know premium consists of time value (TV) + intrinsic value (IV, when using ITM strikes). Using your $90.00 purchase price, the premium for the $76.00 call would be $14.00 + some time value component, not $2.02.
Enter the price of SQ when you executed the initial covered call trade and all calculations will then make sense.
Alan
For the week ahead, I would add the US Elections on Tuesday as important. Rather than Blue or Red, we are Green … for money.
Terry
Here in Sunny Florida I have 12 constitutional amendments and 12 local county questions in addition to the individual races. Been researching those issues – pros and cons. All that will keep me busy for a while on voting day.. I do not like early voting. No long lines in our voting place.
Mario
Hi Mario,
Back when we had only marginally different candidates on the local and state levels I too didn’t care for early voting as the closing days of the campaign usually drew sharper distinctions between the candidates. That seems no longer necessary.
I now believe early voting brings more people to the polls and not just this year. I also believe that once a person starts voting they will become over time a better informed voter.
I think we actually have a higher voting rate than that usually stated. Many people are registered in more than one state. I don’t know of anyone who goes to, or contacts, the registrar to have their name deleted from the rolls. Likewise when people die survivors don’t tend to think about having them deleted.
Early, and especially weekend voting, helps some people whose jobs make it difficult for them to spend several hours on election day.
I have voted in every election, local, state and federal since 1960. I vote for the candidate who I believe will best serve the interests of the country as a whole. I want the country to grow and become a better place for my descendants. I want them to have the opportunity of life, liberty and the pursuit of happiness.
This country has given me fantastic opportunities to listen to the beat of a different drummer. With all my failures I have had a great life. I truly believe I could not have accomplished what I have in any other country on the face of the earth. I will always remember that I grew up in a three room house with no plumbing or electricity. I didn’t resent it. Hell, I thought everyone lived like that until I was 10 years old.
I respect you for taking the time to study all the amendments and voting for all the local offices too.
Keep up the good work.
Hoyt
Hey Hoyt,
Well said as always. Plus thanks, Mario, for your post:sounds like things are busy on your ballot this go-round!
Hoyt, I was 2 years old when you cast your first vote. And I could not express my feelings about this country better than you did if I wrote a pile of drafts :). I felt that way when I was growing up, when I was an Army Officer and still do.
Yet if I could change one thing about today it would be the tone. We have partisans attacking each other not visionaries leading. Maybe I am just a dreamer and it has always been this way? Maybe the sound is just so turned up now on the vitriol, prejudice and intolerance one can not simply ignore or deny it any more? I don’t know.
Terry phrased it well that we are on the green team here :)! I have been building my cash position since September in anticipation of a market moving run down to tomorrow. That in itself is sad. I will place a directional election trade near the close with a small amount of money just for “fun”. I will determine it when I see foreshadows in the cash market tomorrow.
It is abundantly clear to me I am part of the problem. I care less about the outcome tomorrow than I do about getting it right in my trading. Shame on me. I may as well be at the horse track betting the ponies. – Jay
Hey Jay,
Don’t be too hard on yourself. You are probably not exactly right about not caring as much about the outcome as getting it right in your trading. We, us investor/traders, are survivors. We need to make a profit when the opportunity presents itself.
History has shown us that after an initial downturn the market does better on average under Democrats. I made most of my money under Bill Clinton’s presidency. Lost the most under George W. Did very,very well under Obama. Made a ton in 2017 under Trump. Flat in 2018 after a lot of very hard work.
We will have a recession and a recovery. In my opinion how soon and how deep will depend on trade. We have been here before.Trade wars started the Great Depression. not the 1929 stock market crash. Tight money, raising interest rates, made it deeper and longer. “Those who do not learn the lessons of history are doomed to repeat them.” That is the actual real quote.
I like your idea of a “fun” trade tomorrow. As a trader I do short term trades. Not as short as some you do. I am no longer that nimble. But I will make some bets for December
I am seriously considering hanging it up after December anyway.
I don’t know what will bring us together as a nation.The seminal event in my lifetime that did that was 9/11. It lasted until the second Iraq invasion. That invasion divided or exposed the divisions that already existed.
We had a guy on the ground, Scott Ritter, who tried to tell us there were no weapons of mass destruction. But once a decision to go to war is made, facts be damned. CIA never confirmed WMDs but could not stand up and say that they had not confirmed it when the administration said they had.
Anyway that’s ancient history. The $64,000.00 question now is what will bring us together now. Hopefully it will not be something as tragic as 9/11 or Pearl Harbor.
Enough darkness. Let’s see if we can make some money.
Take care,
Hoyt
Thanks Hoyt,
I always enjoy your perspective on things.
There is so much implied volatility in options premium right now using a straddle for tonight is too expensive needing too much of a move to work so I may just buy a SPY option for Friday one direction or the other – probably the call – at about the 50 delta for my “fun” election trade.
I’ll wait until the close (SPY runs until 4:15) since I suspect the market will go down this afternoon as traders close positions for election night and calls get cheaper. My two cents! – Jay
Hoyt,
A quick follow up: since I was wrong about the market going down this afternoon for my election trade I bought one SPX (no typo, not SPY) put contract for tomorrow’s expiration just in case whatever happens tonight causes a sell off.
We shall see. I hope whichever candidates folks here support all do well.
I found it delightfully ironic that in an interview out today Trump said he regrets his tone so far and would soften it. On the Job Training perhaps :)?- Jay
Hi Jay,
Replying mid thread because unable to reply to your last comment.
I purchased calls on Amazon expiring this Friday.
It will be very interesting with Trump and House. Word is that the Dem who will be heading Oversight intends to subpoena Trump’s tax returns. I think that’s a mistake. Absent that I actually believe Trump and Pelosi will work out an infrastructure deal. This will add to deficit and inflation causing Fed to accelerate rate increases.
2019 will be a bad year for the stock market.
I am not sure what to do. My largest positions are AMZN, GLW, and BAC. Owned these since 2009. Obviously AMZN is most vulnerable.
Great pick on SPX. Congrats.
Hoyt
Hey Hoyt,
My election trade did not work but I have made it back.
Thanks for the updates, your trade for Friday should work and I share your premonitions about 2019! – Jay
Hi Jay,
Yesterday bought AMZN Nov 09 ’18 $1650 Call with AMZN @ $1651.
Cost $30.55. Dropped $6.00 by close. Didn’t look too smart.
Sold today 3:50pm AMZN @$1750 for $100.00. 227% profit in about 28 hours. AMZN up $10.00 after hours. $1,000.00 per contract. Oops.
Regrets? Not for selling but for not buying more originally.
Analysis. I bought because of accelerating price action yesterday morning. It didn’t hold up in the afternoon which is where I had intended to sell.Opened today with accelerating price movement all day. Too much acceleration for me. Afraid of retrenchment tomorrow or Friday.
We do what we do.
Take care,
Hoyt
Great trade Hoyt! Well done. Those are the one’s that keep you coming back. I know we are options sellers first here but it’s just human nature to play the buy side with limited risk every now and then when you get the itch and keep it small!
I thought if the Dems won the House healthcare/Obamacare was safe so I bought a call on UNH yesterday that was up over a triple today. Tiny bet, large return. Don’t bet a dime on stuff like that until you have mastered the sell side first. That is what I tell all my friends who ask me about options.
I also did quite well trading the support levels on SPX on the options that expired today. Again. it’s all sexy stuff but study the heck out of it first and always speculate small with risk capital you have coming in from options sales, not your money. – Jay
Jay,
As usual you are absolutely correct.
Education. Education. Education. BCI methodology is the Doctorate.
Another sign for my wall:
“Again. it’s all sexy stuff but study the heck out of it first and always speculate small with risk capital you have coming in from options sales, not your money.” – Jay
My you have fair winds and following seas.
Hoyt
Thanks Hoyt,
As always you are too kind! – Jay
Premium Members,
The Weekly Report has been revised and uploaded to the Premium Member website. The ER date for UBNT has been revised and confirmed. Look for the report dated 11/02/18-RevA.
Best,
Barry and The Blue Collar Investor Team
Barry / Members –
In Rev. A, UBNT is properly highlighted in GOLD area.
Thought not shown now (was before the update), CTRE should still be highlighted in Gold since ER is on 11/14/18.
Mario
Blue Hour #11: “WHEN TO ROLL COVERED CALL OPTIONS”
Premium and Video members,
A new Blue Hour webinar has been uploaded to your member sites. The location of the presentation is shown in the screenshot below.
CLICK ON IMAGE TO ENLARGE & USE THE BACK ARROW TO RETURN TO BLOG.
Alan & the BCI team
Hi Alan –
It was very nice meeting you at the recent AAII conference in Las Vegas. I stopped by your booth briefly. Since then, I have purchased a couple of your books; ‘The Complete Encyclopedia for Covered Call Writing’, and ‘Exit Strategies’, from Amazon, as I had gift cards.
I periodically trade options on a casual basis. One strategy that I’ve been thinking about is writing call options on a portfolio of stocks that I already own. This portfolio consists of about a dozen blue chip stocks that I am holding for the long-term. These stocks provide nice dividend income, and I am not really looking to sell any of them in the near-term. Would you have any thoughts on this strategy, and does The Blue Collar Investor address this idea?
Thanks much,
Alan
Alan,
I have referred to this specific scenario as “portfolio overwriting” in my books and DVDs. The covered call writing strategy is structured and managed slightly differently than for traditional covered call writing.
Portfolio overwriting is an outstanding way to leverage long-term buy-and-hold portfolios to create additional income streams but must be handled in a specific way to dramatically reduce the possibility of negative tax consequences.
Our latest book, “Covered Call Writing Alternative Strategies”, details the strategy (along with 2 others) with examples.
Here is a link for information on this new book:
https://thebluecollarinvestor.com/minimembership/covered-call-writing-alernative-strategies/
Barry and I have also created calculators for this and other alternative strategies:
https://thebluecollarinvestor.com/minimembership/calculator-package/
Alan
Alan, hello. Just to let you know that I’m very happy to be a member of BCI. I followed your recommendation in buying your Complete Encyclopedia and DVD series. I also purchased the Exit Strategies for CCall Writing. I just finished viewing the DVD and a lot of doubts I had were cleared. I will start reading the books in order to increase my knowledge on CCall writing.
Again Thank you for your time and support.
Regards, Américo
Américo,
I appreciate your participation in our BCI community. Please keep in touch and let me know how you’re progressing. I hope you enjoy and benefit from my books.
Alan
Premium members:
This week’s 8-page report of top-performing ETFs and analysis of ALL Select Sector Components has been uploaded to your premium site. The report also lists Top-performing ETFs with Weekly options as well as the implied volatility of all eligible candidates.
New members check out the video user guide located above the recent reports.
For your convenience, here is the link to login to the premium site:
https://www.thebluecollarinvestor.com/member/login.php
NOT A PREMIUM MEMBER? Check out this link:
https://www.thebluecollarinvestor.com/membership.shtml
Alan and the BCI team
Alan,
Can you give me an estimate of how much I could make realistically each month by selling covered calls on the 1,000 shares of Lockheed Martin stock that I own?
Thank you very much for your excellent training materials – I am just beginning to learn about selling covered calls.
Doug
Hi Doug,
Since I do this stuff all the time I can’t resist chiming in but I know Alan will give you a better answer!
I will assume your LMT is in a cash account, has some appreciation and you don’t want it called away. If it is in an IRA and you don’t care if it is called away you could make more.
LMT closed at around 307 today. You could sell the December 320 covered call and bring in over 1%. You may be better off moving to the 330 strike and bringing in a half a percent so you have more upside and less assignment risk
But please do not think about premium first. Think about what your relationship with your LMT shares is. If they are hold until the grave write your calls further out of the money. – Jay
Doug,
I concur with Jay’s assessment 100%.
We must define our return goals and determine if it is critical to avoid assignment to avoid negative tax consequences. Let’s assume that our annualized return goal is an additional 6% over normal share appreciation + dividend distribution.
We always avoid earnings report dates which is on 1’22’19 for LMT…not an issue for a while.
Next, we factor in ex-dividend dates (most common cause of early assignment) which is on 11/30/18 for LMT…we will avoid this week and not have an option in place on 11/29.
The good news is that LMT has weekly options so we can circumvent both ER and ex-dividend dates.
If our goal is 6% annualized, that would compute to 0.12% per week (we can move back to Monthlys when ex-dates and ER dates are not in play).
The BCI Portfolio Overwriting Calculator will be helpful running these calculations. The screenshot below shows that the $322.50 and $325.00 calls expiring on 11/23/18 offer 1-week returns of 0.18% and 0.08%, respectively. One is a bit higher than our 0.12% target, the other a bit lower. Using an equal number of each will bring us to our target return goal.
CLICK ON IMAGE TO ENLARGE & USE THE BACK ARROW TO RETURN TO BLOG.
Alan