When seeking to add a technology presence to our covered call writing and put-selling portfolios, we can do so by using exchange-traded funds (ETFs) based on technology benchmarks. Two such reliable ETFs are Technology Select Sector SPDR Fund (NYSE: XLK) and Invesco QQQ Trust (Nasdaq: QQQ). This article will compare the 2 funds to assist in determining which, if either- would make a better candidate for our portfolios.
XLK
This is a fund based on the technology stocks present in the S&P 500. Here is a list of the fund’s top 10 holdings as of 5/2021:

XLK: Top Holdings as of May, 2021
QQQ
This is a fund based on the top 100 non-financial companies listed on the Nasdaq exchange Here is a list of the fund’s top 10 holdings as of 5/2021:

QQQ: Top Holdings as of 5/2021
The top 2 holdings (AAPL and MSFT) are the same in both securities and one other (PYPL) is also found in both top 10s. There is no apparent security advantage based on holdings.
Comparison chart in 1 and 3-month time-frames
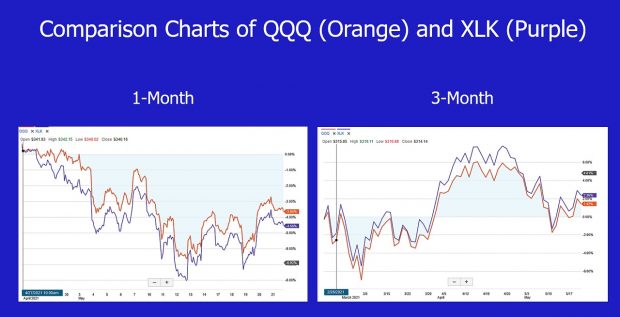
QQQ-XLK Comparison Charts
QQQ slightly out-performed in a 1-month time-frame while XLK slightly out-performed in a 3-month time-frame. This fairly typical of these securities. There is no apparent security advantage based on price performance.
Implied volatility comparison measuring risk and premium returns

QQQ and XLK Implied Volatility Stats
Once again, there is no apparent difference between the 2 securities as the risk and premium returns, as measured by IV, is similar.
Pros & cons
There are little differences between these 2 securities as they relate to option-selling. XLK, as of May 2021, has a much lower price-per-share and QQQ has the Nasdaq 100 Volatility Index (VOLQ) associated with it which can be leveraged into a strategy I developed in 2021:
Discussion
QQQ and XLK are both outstanding securities to integrate technology companies into our portfolios for option-selling. Both consist of quality companies and our well-diversified. Price and strategy goals may play a role into final decisions.
No price increase for premium members
On November 1, 2021, BCI will be raising membership rates for new members only. This will not apply to current members. It’s been 4 years since we had a rate increase. In that period, we have added dozens of training videos, additional downloads and resources and more quality data to our stock and ETF reports. We are fortunate to have such a robust and expanding membership and strive to provide the best high-quality information and tools at the lowest industry prices.
This price increase will not apply to current active members as you are grandfathered into the current rate for life or as long as your membership remains active. This is our way of showing our appreciation to our long-term members.
The increase for new members will go into effect on November 1, 2021 as follows:
Monthly: $19.95 for the first (trial) month and $57.95 each 30-days thereafter (currently $49.95).
Annual: $657.40 for the first 13 months (includes a reduced first month and a free last month) and then $695.40 every 13 months thereafter (includes 1 free month). Currently $569.40 and $599.40.
All new members who subscribe between now and 10/31/2021 will be grandfathered into the current rate and will see no price increase on 11/1/2021.
Thanks to all our loyal members for your support over the past 14 years and for putting on the financial map.
Premium membership information
Your generous testimonials
Over the years, the BCI community has been incredibly gracious by sending our BCI team email testimonials sharing stories as to what our educational content has meant to their families. Moving forward, we have decided to share some of these testimonials in our blog articles. We will never use a last name unless given permission:
Upcoming events
1.Wealth365 Summit: Free webinar
Monday October 11th at 4 PM ET
Stock Options: How to Use Implied Volatility to Determine Strike Selection
Creating 84% probability successful trades
This presentation will detail how to use implied volatility stats, standard deviation bell curves and conversion formulas to establish projected high and low ranges for price movement of a security over the life of an option contract.
These formulas will allow us to create 84% probability of success trades where share price is highly unlikely to fall below the breakeven price point or above the out-of-the-money call strike where share retention is a critical aspect of our strategy.
While there is inherent risk in all strategies that seek to beat risk-free returns (Treasuries, for example), the strategies discussed in this webinar will be ultra low-risk and appropriate for most retail investors.
2. Money Show Virtual Event: Free webinar
Tuesday November 2nd from 1:30 PM ET to 2:00 PM ET
Converting Non-Dividend Stocks into Dividend Stocks
Selling call options to create dividend-like cash-flow

***********************************************************************************************************************
Market tone data is now located on page 1 of our premium member stock reports and page 1 of our mid-week ETF reports.
****************************************************************************************************************
Alan,
Could we also own individual tech companies in our portfolio along with one or both of these ETFs? I especially like AAPL and MSFT.
Thanks,
Marsha
Marsha,
Yes, both individual stocks and ETFs can be incorporated into our portfolios as long as our common-sense principles are adhered to. These include:
1. Stock and ETF diversification
2. Sector/industry diversification
3. Cash allocation where a similar amount of cash is allocated per-position.
This approach gives us a degree of protection against a sudden and unexpected downturn in one particular stock or industry.
Alan
Premium Members,
This week’s Weekly Stock Screen And Watch List has been uploaded to The Blue Collar Investor Premium Member site and is available for download in the “Reports” section. Look for the report dated 10/08/21.
Also, be sure to check out the latest BCI Training Videos and “Ask Alan” segments. You can view them on The Blue Collar YouTube Channel. For your convenience, the link to the BCI YouTube Channel is:
http://www.youtube.com/user/BlueCollarInvestor
On the front page of the Weekly Stock Report, we now display the Top Performing ETFs, the Top SPDR Sector Funds, and the 4 single Inverse Index Funds. They are sorted using the 1-month performances from the Wednesday night ETF report and the prices from the weekend close.
Please make sure that you review the new feature that we’ve added…Implied Volatility or IV. This is the At The Money (ATM) Implied Volatility for all of the stocks in the report.
Best,
Barry and The Blue Collar Investor Team
Hi Alan,
I just purchased 3 of your books and anxiously awaiting their arrival. In the meantime I’m watching the beginner videos which are very easy to understand.
I hope you can answer this question about cost basis when rolling the option. Let’s say I buy a stock for 48.20 and sell the 48 strike option for 1.60.
Now its expiration Friday and the stock is at 52.20 and I want to rollout to the 48 strike option or out and up to the 54 strike option. Which cost-basis amount should I use? Do I use:
1. $48.20 what I paid for the stock?
2. $52.20 the price now
3. $46.60 the price I paid less the first premium I received
I apologize in advance if this is covered in the later beginner videos.
Thanks for all your hard work.
Seth
Seth,
The fact that you are thinking in terms of cost-basis is a sign that you are off to great start.
When we are considering rolling our in-the-money option, we must compare it to the alternative which is “allowing” assignment (selling our shares at the strike price).
In order to compare “apples-to-apples”, we must apply the same cost-basis for both approaches. We ask ourselves, “what are the shares worth prior to rolling? The answer is the previous strike sold, $48.00 in this hypothetical.
If we allow assignment, we receive $48.00 per-share. If we roll, $48.00 is also our cost-basis. Use the “What Now” tab of the BCI Calculators to get trade results.
Bottom line: The cost-basis we use for our rolling trade decisions is $48.00 per-share. For final portfolio results and for tax purposes, this does not apply.
Keep up the great work.
Alan
Premium Members,
There was a typo with the stock BLD. It appeared twice in the failed sections. This has now been corrected. The typo did not impact any of the stocks in the passed section. Look for the report dated 10/08/21-RevA.
Thank you, Marc.
Best,
Barry
Hi Alan!
Hope you have been well.
Just finished watching your webinar.. thank you.
For PMCC, is your management the same as coveted call 20% 10% ?
From your fan in Australia,
Toshie 😃
Toshie,
Yes, for the PMCC strategy, the active management leg is the short call which is managed the same way traditional covered call writing. The 20%/10% guidelines do apply.
Alan
Barry,
do you know what happened to TREX today???
Roni
Roni,
Baird downgraded TREX from “Outperform” to “Neutral” with a price target of $108 from $116.
Best,
Barry
Thanks, Barry.
Alan
You say that the mid contract unwind is for a situation in which “the underlying has significantly gone up, and that unwinding is recommended to offset the small loss by selling another call using a different underlying in the same month.” However, you don’t provide a parameter (guideline) for when the initial trade’s underlying is “too high”….do you have that guideline, and what is it?
Joanna
Joanna,
The guideline to initiate the MCU exit strategy is:
When the time-value component of the cost-to-close the initial short call is approaching zero and we can generate at least 1% more than this TV CTC by the end of the current contract with another position.
We use the “Unwind Now” tab of the Elite or Elite-Plus Calculators for these calculations.
Alan
Alan,
What would happen if I picked stocks like Apple and MSFT that I liked long term and constantly did the wheel, but say Apple is assigned at 140 from the put but stock drops to 130 and then I turn around and sell the ATM CC, gets called away, then sell the ATM Put. Keep repeating even though the stock stays under 140?
Thank you,
Bob
Bob,
The “wheel” (we call it the “PCP” or “Put-call-put” strategy in the BCI community), is a wonderful strategy. Whether we are selling calls or puts, our enemy is share depreciation and our trades must be managed if there is a share price decline. If AAPL drops from $140.00 to $130.00, some exit strategy intervention would have been appropriate.
That said, selling short-term options allows us to re-evaluate our bullish assumptions on the underlying securities. If share price continues to decline, the option premiums will not compensate us for the loss on the stock side.
If we decide to write calls against holdings we want to retain for the long haul (portfolio overwriting), we can first enter the trade by selling OTM puts and then, once exercised, write deep OTM calls accepting lower premiums in exchange for low-probability of exercise trades.
Bottom line: Unless we are favoring portfolio overwriting, it’s best to use securities that are elite-performers at the time of the trades.
Alan
Premium members:
This week’s 4-page report of top-performing ETFs and analysis of the top-performing Select Sector SPDRs has been uploaded to your premium site. One and three-month analysis are included in the report. Weekly performance has also been incorporated into the report although not part of the screening process. Weekly option availability and implied volatility stats are also incorporated.
The mid-week market tone is located on page 1 of the report.
New members check out our ongoing and never-ending training videos (“Ask Alan” and Blue Hour webinars). We add at least one new video each month. Only premium members have access to the entire library of these training tools.
For your convenience, here is the link to login to the premium site:
https://www.thebluecollarinvestor.com/member/login.php
NOT A PREMIUM MEMBER? Check out this link:
https://www.thebluecollarinvestor.com/membership.shtml
Alan and the BCI team
Alan a few questions;
a) im very intrigued with your strategy of using IV to sell puts and calls with 84% probability of success
– how is IV different from delta– why not use strike prices at a delta of .16%. Is that not the sameÉ
– when using VOLQ, why do u need to use the IV calculator for a monthly given the VOLQ IS the 1 mth time frame.. Confused
Navigating the website, learning , learning, learning. I LOVE the put-call-put strategy . Fits my personality — i like to get paid !! haha
Thanks,
George
George,
When I started writing articles about these ultra low-risk strategies, I tested several securities to see if Delta and implied volatility resulted in the same ranges. They were close but not precise.
Both approaches are excellent foundational methods of establishing high-probability trades. I have been using Delta for weekly puts very successfully for over a year. I, also, have another portfolio (small one) for IV trading ranges that is also doing quite well.
The main issue with using Deltas of 16 in place of IV trading ranges is that we don’t always have strikes with Deltas of 16 but we can always establish a trading range with IV.
As an example, the screenshot below shows a trading range for CPRT from $127.23 to $152.51 based on an IV of 28.77. For calls, the closest Delta is 13 (($155.00 strike) and for puts, the closest Delta is 19 ($125.00 strike).
It appears that using IV is a bit more precise but I will continue to monitor and evaluate. Again, both approaches are strong methodologies for successful, ultra low-risk trades.
VOLQ, like traditional IV stats, is based on annualized price movement and 1 standard deviation. The conversion factor must be used for the specific option contract we are trading.
CLICK ON IMAGE TO ENLARGE & USE THE BACK ARROW TO RETURN TO BLOG.
Alan