When selling cash-secured puts our position management skills include buying back the short puts under certain circumstances. These include situations when share price moves up or down dramatically. When share price declines below the breakeven, we start losing money. Our guideline is to buy back the sold put if share price declines by more than 3% below the strike. This article will focus in on scenarios when stock price gaps up. We will use Broadcom Limited (AVGO), a stock frequently on our Premium Watch List.
AVGO from 5/22/2017 to 6/2/2017

AVGO: Gap-Up Chart
On 5/22/2017 AVGO (Broadcom Limited) was trading at $238.00 and then gapped up to $254.00 on 6/2/2017.
Selling the $235.00 out-of-the-money put on 5/22/2017

AVGO: Put Calculations
The BCI Put Calculator shows us that we generate an initial 25-day return of 2.62% (38.25% annualized). The cash required to secure this put is $22,900.00 per contract
Charting the $235.00 put option from 5/22/2017 through 6/2/2017
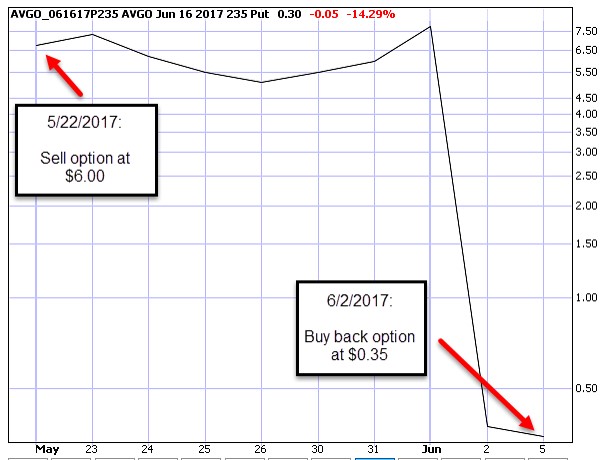
AVGO $235.00 Put Option Chart
Guidelines to buy back put options after stock price gap-up
We automatically buy back the short put when the premium value declines to 20% or less of the original sale price in the first half of the contract and 10% or less in the second half of the contract. In the case of AVGO, the decline was about 6% of the original option sale price of $6.00.
Benefit of closing
The reason it usually makes sense to close in this situation is because we now free up the $22,900.00 per contract which can be used to secure another put position in the same contract month. If we can generate more than $35.00 per contract, this will enhance our portfolio returns.
Discussion
***For more detailed information on put-selling, check out my book and DVD Program here.
Next live event
October 10, 2017: Palm Beach Gardens Florida:
7 Pm to 9 PM
Using options to Generate Monthly Cash and to Buy a Stock at a Discount.
LOCATION: Publix Greenwise Market (2nd floor)
11231 Legacy Avenue (Legacy Place)
Palm Beach Gardens, FL 33410
Open to public
The club charges $10 at door to cover expenses.
Market tone
Global stocks rose this week, with the MSCI All Country World Index hitting a record high. West Texas Intermediate crude oil slipped to $49.50 a barrel from $51.50 last Friday. Volatility, as measured by the Chicago Board Options Exchange Volatility Index (VIX), closed at a record on Thursday and traded at 9.65. This week’s economic and international news of importance:
- Hurricanes Harvey and Irma combined to bring an end to a seven-year streak of positive US payroll reports. Thirty-three thousand jobs were lost
- The unemployment rate dipped to 4.2% due to a temporarily smaller labor force
- Average hourly earnings rose to an annual rate of 2.9
- An unexpected positive effect of the hurricanes was a spike in September auto sales as consumers replaced vehicles damaged in the storms.
- Catalonia, the wealthy Spanish region that is home to Barcelona, is expected to declare independence from Spain next week
- Figures from the United States, Europe and China released this week all showed continued solid economic growth
- September figures for the US manufacturing and services sectors both showed their strongest readings in more than a decade, but the US data may have been somewhat distorted by the recent hurricanes
- The Institute for Supply Management manufacturing index rose to 60.8, the highest level since September 2004, while the nonmanufacturing reading came in at 59.8, a level not seen since August 2005
- European data were similarly robust, and China also showed continued upward
- President Trump is expected next week to decertify that the Iran nuclear deal — designed to restrain Iran’s nuclear. If the president withholds certification, Congress then has 60 days to decide whether to re-impose sanctions on Iran
- The US House of Representatives took the first step toward passing a tax overhaul by approving a fiscal- year 2018 budget blueprint. Passage of the House measure ups the odds that tax reform could be enacted early in 2018
THE WEEK AHEAD
Mon Oct 9th
- Bond market closed
Tue Oct 10th
- UK: Industrial production
Wed Oct 11th
- FOMC minutes
Thu Oct 12th
- Eurozone: Industrial production
Fri Oct 13th
- China: Trade balance
- US: Trade balance
- US: Consumer price index
For the week, the S&P 500 rose by 1.19% for a year-to-date return of 13.87%
Summary
IBD: Market in confirmed uptrend
GMI: 6/6- Buy signal since market close of August 31, 2017
BCI: I am currently favoring in-the-money strikes 2-to-1.
WHAT THE BROAD MARKET INDICATORS (S&P 500 AND VIX) ARE TELLING US
The 6-month charts point to a slightly bullish outlook. In the past six months, the S&P 500 was up 10% while the VIX (9.65) moved down by 30%.
Much success to all,
Alan and the BCI team
Hi Alan,
I enjoyed the pictures from Texas last week! I have also petted those statues 🙂
This is a timely article for me as I hold CSP’s on SPY at 243 and QQQ at 140 for regular Oct. expiry. They are both safe at the moment but it never hurts to close at a gain even though I would not at all mind owning both at those prices should we see them. Seems to me you should only sell CSP’s if that is the case.
I like selling them OTM. My thinking may be out to lunch but I view them as one month CD’s for the cash trying to buy something I want at a lower price.
I mentioned at the end of our last thread I await Hurricane Nate tonight. Anyone who has ever lived in hurricane prone areas knows how that drill goes! – Jay
Jay,
Stay safe. Our thoughts and prayers are with you.
Best,
Barry and The BCI Team
Thank you for your always kind words Barry. It’s been a tough season impacting many people in life changing ways. I am a Katrina vet and know all about these damn things… – Jay
Yes good luck with Nate Jay. Personally I wouldn’t want to live in any location where there was a constant danger of the local real estate suddenly relocating to the next county 🙂
Justin
Thanks Justin, it went east of here and I was not effected but a lot of folks were and I hope this is the last of them this year, – Jay
Alan,
Please,
In selecting a strike price for the sale of an In-the-Money covered call, Is there a rule of thumb that suggests/requires that the Premium amount ( Bid Price) be in excess of the difference between the Market Price of the stock and the Strike Price?
Thanks in advance for your reply.
When will your new book be available?
Bob
Bob,
Yes, definitely. It’s the time value component of the in-the-money (ITM) premium that represents our real initial return on our option (ROO). For example, if a stock is trading at $32 and we sell the $30 ITM call option, we are agreeing to lose $2 on the sale of the stock. Any option we choose should be more than $2 based on our return goals. In my case, I look for 2-4% per month and up to 6% in bull markets but no higher (too much risk).
Use the multiple tab of the Ellman Calculator for these calculations. I set up a hypothetical with 3 premiums. Only the $3 premium highlighted in the yellow field would meet my goals.
The upcoming book (“Covered Call Writing Alternative Strategies”), which I am co-authoring with Barry Bergman, is just starting the editing process. My hope is to have it published by the end of this year.
CLICK ON IMAGFE TO ENLARGE & USE THE BACK ARROW TO RETURN TO BLOG.
Alan
Premium Members,
This week’s Weekly Stock Screen And Watch List has been uploaded to The Blue Collar Investor premium member site and is available for download in the “Reports” section. Look for the report dated 10/06/17.
Also, be sure to check out the latest BCI Training Videos and “Ask Alan” segments. You can view them at The Blue Collar YouTube Channel. For your convenience, the link to the BCI YouTube Channel is:
http://www.youtube.com/user/BlueCollarInvestor
Our thoughts and prayers are with our members who are in “Nate’s’ path. Stay safe and come back strong.
Best,
Barry and The Blue Collar Investor Team
Hi Barry,
PYPL was expected to issue their ER on Oct 25 when I entered my CC trade on 09/25.
Now I see they decided on OCT 19, and I must take an exit strategy to avoid ER risk.
The stock is doing well, and I will probably be able to make a profit, but it will certainly be much less than my expected ROO.
It is always frustrating when these unexpected changes happen.
Roni
Roni,
Glad you picked up the Oct. 19 ER for PYPL. Another thing on my mind to ponder.
Last Price is 66.23
I own 300 shares in a OTM Covered Call Strike 64.5 Premium 1.69 (including commissions), Cost Basis 64.11. Total gain today is 2.5% plus 0.61% Upside.= 3.1% That comes out to be $598.00 today and at Expiration with assignment.
The price today 66.23, is 2.7% above my strike or 64.5.
The last 2 earnings reports exceeded estimates. The last 4 earnings reports either exceeded or met estimates.
Rating at Yahoo is a buy. Barchart strong buy. Fidelity Equity Summary Score 6.7 Neutral.
Time value of option today is 0.95 (midpoint) which would be a $285 loss if I unwind now, which I never would. Let’s see what the time value is Oct. 19 to make a better decision. Following the BCI rules one would unwind and take the profits. One could also close the option leg before the earnings and keep the stock for an earnings surprise.
Mario
Hi Mario,
my PYPL position is very similar to yours.
I have 400 shares bought at 64.35, and 4 10/20/2017 65.00 C.
I love PYPL and have had many good trades with it, but my risk tollerance is very low when it comes to Ernings Reports.
I agree we must wait a few more days, and watch it very closely, but I will not take it through Earnings.
Roni
For many years, I have been using the OptionXpress web site during off hours to evaluate the potential performance of different option positions (CCs, CSPs, vertical spreads, etc.) for the entire chain. Because Schwab is taking them over, the OX web site is down. I don’t know if this is temporary or permanent.
Is anyone aware of a free site that enables you to pick a strategy such as covered calls and see the calcs for return if assigned, return if unassigned, etc. for the entire chain? TIA
Spin
Spin,
Schwab’s StreetSmart Edge currently has that capability. As an aside, I was a Schwab external beta tester for their StreetSmart Edge platform and was part of their 5-year pilot program allowing spread trades inside of IRA accounts. Schwab tells me that they expect to launch “StreetSmart Central” shortly, [ossibly as soon as this week. Schwab and OptionsXpress have finally integrated their back-end systems so I expect that OX will slowly go away.
I’m expecting ‘Central to have many of OX’s tools. Schwab has been integrating many of OX’s tools into ‘Edge over the last year or two. The covered call calculations are available in ‘Edge. With Schwab dropping their commission fees recently, you might want to take a look at them again, although they are not as low as Interactive Brokers.
Best,
Barry
@Spin: Born to Sell does those calculations, but it’s a pay site. I think you can use it free for two weeks though.
Andrew & Barry,
Thanks for the info. Brokers like Schwab are a non starter for me because I’m often a scale in, scale out trader and there’s no dollar penalty for that at Interactive Brokers. I can use its DDE/Excel connection in real time for individual position analysis but that’s a micro not macro level.
I looked at a fallow account at Scottrade and they provide some basic option chains stats for covered calls and cash secured puts. It’s not as good as the web site formerly known as OX but it will have to do for now. I’m going to explore some other broker links and maybe I’ll get lucky!
Spin
Spin,
I’ve attached a shot of Schwab’s Covered Call options chain data. You can open a very small account at Schwab and get access to the tool. See below…
Best,
Barry
Barry,
Thanks for the screen shot. That’s exactly what I’m looking for. Do they offer that analysis feature for other option strategies such as short puts and verticals?
Many years ago, I paid $39.95 per month for real time Dow Jones streaming news at Datek which was subsequently bought out by Ameritrade. A year or so later, I found out that Scottrade offered it for free if you opened an account and parked $500 there. Giving up the interest on $500 a year saved me $479 a year in subscription costs. Looks like I might be doing that again at Schwab (g).
Spin
Spin,
As best I can tell, the only type of trade that this information is available for is the covered call. I’m still waiting to get access to their new platform, “StreetSmart Central” As soon as I get access to it, I’ll check it out for you.
Best,
Barry
Does anyone use IBD Leaderboard? Just wondering if it is of any value to use in conjunction with the BCI program. thanks , Ed.
Hello Ed,
For the Premium Report, the only two IBD lists we use are the IBD 50 and IBD Big Cap 20. We then further sort those lists to use only those stocks that have all “green” SmartSelect ratings. Our key here are the SmartSelect ratings. They are proven fundamental and technical screening parameters. We have been using them for as long as they have been available from IBD.
Although we don’t use the LeaderBoard, if we did, any stocks on that list would have to have all 6 green SmartSelect ratings.
Best,
Barry
Still a few offering decent looking value with 9.5 trading days left – I like the look of GLOB offering a 3.1% ROO with 2.9% DP for instance…
Justin,
watch out !!!
It’s too much.
Roni
Justin,
Regarding GLOB, I’d suggest that you try to find out why the IV for its options has doubled in the past month. Its earnings announcement isn’t for another month so something else is driving the premiums up, well above their previous high for the year. That increase is a big question mark.
Spin
Yes I looked all over the net and found nothing but a recent upgrade by a broker. How about it’s just bullish supply and demand bidding up the options price? 🙂
I have no clue what’s going on but something is definitely going on. Check out the attached stats from IVolatility (hopefully the attachment is readable).
Also possibly someone hedging maybe? Certainly the chart looks relatively safe, with normal volume and a move up from a consolidation area over the last two weeks. It would have to fall 6% over the next nine days before I’d start to lose money I calculate.
Hedging would not cause this amount of IV expansion. IV up 75% in one month means that options are being bought in size (compared to normal option volume), implying some sort of binary event which may or may not come to pass. As I said, I have no clue why but situations like this are often a red flag. Or not :->)
Ok how about this – since there’s no mention of any kind of binary event anywhere, then the combination of someone bidding up the price of the call options and the chart moving up over the last two weeks is much more likely to be bullish for GLOB?
Hi Guys,
I had never heard of GLOB but you have tweaked my interest. I like it’s business and to my uneducated nose it smells like a takeover candidate.
It’s lightly traded and options volume is low. But I have it on my watch list for this week. For Nov expiry I may buy 1 contract at 40 strike and see how it does now through earnings. Otherwise Feb is the next series I saw on Yahoo. Small risk, maybe big % reward or a washout :)? Time will tell…- Jay
Great attachment, Spin, it came across very clearly when I just clicked on it. Jay
I’m just a retail guy who has traded a lot of options over the years, looking in from the outside, guessing at what’s inside.
This kind of IV expansion usually occurs prior an earnings release or prior to a news event such as clinical trial results, mergers or acquisitions, new contracts, a product recall or lawsuit, etc. (please refer to Jay’s olfactory perception :->).
And once in awhile, it’s just a non event. About 20+ years ago I got wind of a spin off by a major telecom company. Implied volatility expanded as did option volume. Details were known and as expected, it halted trading at the expected time. The announcement made and BOOM! there was no BOOM at all. The stock dropped a bit, option IV contracted, and premium sellers did nicely. It was a big nothing burger for me since 8×12 confinement with a new significant other isn’t my cup of tea.
What will come of this? Your guess is a good as mine, maybe even better. In the absence of any news, it’s a crap shoot.
As for the IVolatility attachment, you have to register but their service is free. Good info available there.
Spin
Actually speaking of takeover rumors the FMSA 4.50’s seem to be offering good value as well…
New seminar just added:
The Association for Technical Analysis (AFTA): Dallas Texas
Crowne Plaza Hotel
Tuesday April 17, 2018
6:30 – 9 PM
As I went through my daily deletion of dozens of unread sales pitches about this stock and that, this system and that and this can’t miss trading method and that, I wondered “Wouldn’t it be ironic if information became the death of investing?”
By that I mean It has the propensity to turn us all into traders. We have a chart for everything and a reason to buy or sell every phase of the moon.
The idea of holding a portfolio of quality stocks over writing to enhance yield with no intention of selling seems as dated as 8 track tapes :).
Even more basic is a retiree splitting a million bucks between SPY, TLT and GLD, over writing them OTM every month at 1% and generating $10K monthly yield. Yet how many do that in a media culture that encourages them to churn their portfolios?
But maybe that’s all too simple in our world today :)? Anyway, just musings on a quiet day. – Jay
That’s all very well Jay but this is a covered calls forum – you should be telling us all how you’re putting that million into cc’s and pulling in 3% every month 🙂
Justin
Jay,
Musings while watching premium decay…
There’s a time to trade and a time to invest. The trick is figuring out what time it is :->)
As for generating $10K a monthly yield on a million dollar portfolio, what happens in a 2000 or a 2008 when the portfolio halves in value? Not only will the yield halve but in order to obtain it, will you be willing to write CC-s that may lock in a loss? If you do, what happens if a sharp recovery begins (see Mar 2009)?
I’ve read some people’s claim that you don’t lose with CC-s because the money is yours, no matter what. But at what cost?
Spin
Hi Spin,
Obviously it is impossible to foresee a crash in the stock market.
That is why we must limit our trading cash to only a a fraction of our net worth, and accept the possibility of a big loss.
But on the other hand, if we watch our positions all the time, and apply Alan’s exit strategies strictly and emotionlessly, we can minimize the loss.
And make it slowly back when the recovery comes. Right ?
Roni
Roni,
First, you have to differentiate between a crash and a bear market. 1929 and 1987 were crashes. Unless you had some form of negative correlation protection in place prior to them, you paid a hefty price. Disciplined exit strategies would be relatively ineffective in such events. But crashes are rare.
OTOH, bear markets like 2000 and 2008 took 18 months to unfold so they are more manageable because they offered lots of time to react and adjust.
For something more realistic, consider the Dividend Aristocrat GWW which tanked earlier this year. It had a poor earnings announcement on Apr 18th and it gapped down 20+ pts, losing 25+ pts for the day. A just OTM covered call might have softened that blow by 1/4 to 1/3 but still a painful day. If you hesitated, you were down another 20 points in the next few weeks.
If I recall correctly, you are selling ITM covered calls. That will do a better job of mitigating loss but always remember that a covered call and its equivalent cash secured short put are low reward/higher risk strategies. So when the video game starts, “Protect Your Cities”. React, don’t predict and if possible, develop a plan that will achieve gains in a bear market.
Spin
Hi Spin,
I hope you see this late response.
Thank you for the excelent explanation and advices. I will certainly follow them.
My strategy, based on Alan’s methodology, is to stick to monthly CC buy/write, Near The Money trades.
And I follow Alan’s weekly summary, where he states his “currently favoring” relation to ITM/OTM trading sentiment.
I am not prepared for a real steady bear market, except to stay fully in cash. 🙁
I hope the present bullish market will last for some time (years?)
I know it can happen sooner than later.
Roni 🙂
Roni,
Being in cash in a bear market is a plan and it’s a lot better one than Buy & Hope & Wait (for a year or more).
This is a wonderful market for covered calls and it is what it is until it isn’t (advice that I received from Miss Cleo :->).
Spin
Spin,
LOL. that´s so true. 🙂
Thanks ~Roni
Hey Spin,
Sorry I have been away. We have another blog open and you may not see this but thank you for your reply.
I don’t advocate buy and hold. I do advocate holding a portfolio of some kind and using covered calls to enhance yield.
As you point out astutely there will be plenty of signals as to when to get out. I doubt anyone ever went broke using the 200 day MA on SPY, for instance, as an in and out point. – Jay
Actually if you’re making money at all apparently you’re in
the top 1% 🙂 :
“only about 1% of all day traders are able to predictably profit net of fees.”
http://www.tradeciety.com/24-statistics-why-most-traders-lose-money/
“only about 1% of all day traders are able to predictably profit net of fees.”
And even fewer than that make money in bear markets 🙂
Will you be one of them?
Jay,
Severe market downturns such as 1987 (the two down months leading up to Black Monday), the 2000 Dotcom Bust, and the 2008 subprime melt down did not happen overnight. For those who aren’t oblivious, it’s not difficult to recognize that market metrics are deteriorating – economic indicators turn down, earnings announcement disappointments increase, analyst downgrades and earnings revisions increase, the VIX increases, etc., all beginning long before the crisis becomes acute. React, don’t predict.
Thanks Spin,
Good morning and happy Friday the 13th 🙂
A seasonal timing error I made this year was taking SPY and QQQ profits September first in anticipation of the usually rocky couple months ahead. But I did not short and in fact I sold some CSP’s below where I sold the ETFs for October expiry to insure a discipline of buying back lower than where I sold.
We all know the rest of the story: the market marched on and bears are an endangered species for now :),
With VIX below 10 and IV low I have not covered anything going forward as premium is just too low to block the upside but I have been buying ITM call spreads on tickers I like on down days since they are cheap in relative terms. – Jay
Hi Jay,
The VIX at such low levels presents a problem for premium sellers. Because of that, I’ve been contemplated the idea of using more short iron condors but it’s a hurdle for me because in I am mostly a premium seller.
Plan B is to continue as is but to add some cheap OTM index puts or more likely, some bearish put verticals to add a layer of protection (cheap because index IV tends to be lower than equity IV). I’ve had my risk on years and now, I’m more focused on keeping it :->). Speaking of which, have you done any ‘global’ portfolio hedging in your travels?
Spin,
I am woeful at global hedging and investing. I hold Brazil. India and Germany ETF’s but that is about it. – Jay
Spin,
I am woeful at global hedging and investing. I hold Brazil. India and Germany ETF’s but that is about it. – Jay
Here’s an example of online help from IB today:
(their system had told me I had $26k of ‘Buying Power’ left, so I bought $24k worth of stock, and then when trying to sell the call options rec’d an error saying I had ‘Insufficient capital’ (or words to that effect) :
Allan H: in terms the margin arrangement, the current setting has additional initial margin multiplier applied when you hold any short option position.
Allan H: we aware of such setting would affect strategy like cover call holder that requires higher margin
Me: sorry but I don’t understand that last sentence
Allan H: this has been escalated to risk management for review and we should be able to let system tell the strategy and let client to write a cover call without further put additional margin requirement
Me: ok but if I want to know in advance if I can complete a cc trade, there is no way I can be sure I’ll be allowed to do it then? I just buy the stock and then hope your system will let me sell the options?
Allan H: given the current set up, you can still preview order and it tells you margin impact. for just cover call, it will have initial margin applied with increase of around 50% of your stock value. as mentioned, this multiplier has been escalated to risk management and hopefully it can be removed for certain strategy like cover call.
Um – what??
Justin
Trading Status – 10/10/17 Day 2 of Week 4 of 5 Exp. 10/20
ALRM Gapped up – Set GTC order for 0.1% BTC loss. Strike 45. 0.1% loss is Time value .045. Credit limit order is therefore 45 – .045 = or 44.95 GTC to an even nickel..
SPLK – Sinking, declining. Filled Rule 10% BTC order at 0.20 by closing the option leg only. (I placed the order while time value was 0.40 with a GTC order – great decision.. Before end of day it was filled. Now let’s see if will climb back up for me so I can hit a double..
Bought Covered call on RCL and NCLH when the hurricanes were around at a good price. On NCLH I did a Buy Wait and then covered OTM. Still climbing past my strike.
Mario
Justin, Thanks for mentioning Barchart.com last week. I believe it was you that mentioned you can download Earning Report dates. It’s a great site for stock information, analysis, Fundamentals, and Technical information. I like the way they present the data with a fixed frame on the left and the right side for changes in a window. You can set up portfolios (stocks only, no options) and watch lists and get a daily report sent by email at the end of the day.
Mario
Mario
I’ve been taking advantage of the bullishness myself closing out CORT, YY and NVDA in the last few days, sacrificing about 0.5% of the ROO in order to open new positions in GLOB, FMSA and now TTD. There’s still some good premium available out there I find if you take the time to turn over enough rocks.
Re Barchart it’s great for the E.R’s – personally re fundamentals my main concern is to try and find out if there’s any binary-type or upcoming events that could impact the share price before the end of the contract, and StockTwits and SeekingAlpha can be useful there I’ve found.
Justin
Hello Justin,
thanks for your valuable informations on good premium CC trades.
I Have followed your indication (some time ago) on LITE, and placed a trade in the beginning of the 10/20/17 cycle, which is doing very well so far.
Also, I have liquidated my PYPL position last Tuesday after they announced an early 10/19/17 ER, (still making a decent 1.8% gain) and used the resulting cash today to place a new trade on TTD a few minutes ago, after reading your post.
Buy/write TTD @ 65.48/ sell TTD 10/20/2017 65.00 C for 2.11.
Now fully invested again.
Roni
N1 Roni! 🙂 TTD is just breaking upwards out of a flag formation now, which is generally bullish (though not much volume), so hopefully it’ll play nice at least until the end of next week. I’ve been scanning all stocks > $800MM market cap. so I’m expecting to find plenty of good candidates in the upcoming earnings season contract.
Justin
Hey lookit dat 🙂 :
“Equities researchers at Macquarie assumed coverage on shares of The Trade Desk Inc. (NASDAQ:TTD) in a note issued to investors on Thursday. The firm set a “buy” rating and a $78.00 price target on the technology company’s stock. Macquarie’s target price suggests a potential upside of 19.43% from the company’s previous close.”
Nice 🙂
Roni