Understanding option calculations is an integral part of the BCI methodology. Using the Ellman Calculators (Basic and Elite versions) will facilitate the process but knowing the “how” and “why” of these numbers will make us all better investors.
This article was inspired by Peter, one of our members. He was concerned about the potential drop in share price of a covered call trade he was in and wanted to calculate future returns based on the current delta of the option. Before I set up the trade for you let’s define delta:
The amount an option value will change for every $1 change in share price. Delta values run from 0 to 1 and the greater the chance that the strike will end up in-the-money, the higher the delta (the closer it is to 1).
Here is Peter’s trade from several months ago so I will use our generic BCI as the stock and 1 contract for simpler math:
- Buy 100 x BCI @ $62.46
- Sell 1 x $55 call @ $9.75
- Current share price is $60.06
- Current “ask” for the $55 call is $9.85
- Delta for the $55 call = 0.68 (moves $0.68 for every $1 move in share price)
Peter’s initial returns using the multiple tab of The Ellman Calculator:
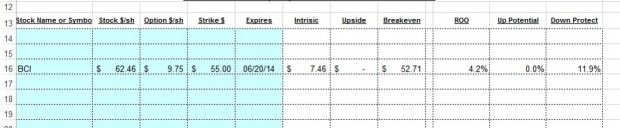
Calculating initial returns using the Ellman Calculator
We see an impressive 1-month return of 4.2% (time value only) and protection of that profit of an also impressive 11.9%
***A free copy of the Basic Ellman Calculator and its user guide can be downloaded from the “free resources” link on the top black bar of this page.
Calculating future returns using delta:
Peter was wondering what his position would be if share price dropped by $2 in the next week. Let’s calculate using delta with the understanding that there are other factors that will influence option premium like time value erosion (theta) and changes in implied volatility of the underlying security (vega). So all other factors remaining about the same, the delta of 0.68 will cause option value to decrease by $1.36 (2 x $0.68) when share value drops to $58.06. That means the cost to close (“ask”) will be $8.49 ($9.85 – $1.36). Okay everybody, take off your shoes and socks and let’s calculate this hypothetical circumstance:
- Share loss = $4.40 ($62.46 – $58.06)
- Option credit = $1.26 ($9.75 – 8.49)
- Net debit = $3.14 per share or $314 per contract ($4.40 – $1.26)
The takeaway here is that if Peter closes his entire position given this hypothetical scenario, he would lose $314 per contract. So where would he be if he didn’t close?
To close or not to close:
Unless some egregious news has come out about the company in question, Peter is still in great shape in this trade. The deep in-the-money strike sold ($55) generated an 11.9% downside protection of the time value component of the original option sale (4.2%). This means that Peter was guaranteed a 4.2% 1-month return as long as share value did not decline below $55. Even if the $2 drop in share value does occur, there is still another $3.06 in downside protection protecting that profit. At this point, the trade is still a classic “take no action” situation again as long as there was no unusual news reported by the company.
When do we start losing money:
Well we always have our exit strategy arsenal in place to avoid or mitigate losses but our breakeven is always share price – total option premium. In this case:
$62.46 – $9.75 = $52.71
With the stock currently trading at $60.06, even a share drop of $2 will leave us a galaxy away from the breakeven. Sometimes the best action to take is no action at all.
Next live seminar: Coral Springs, Florida: Just added:
I will be in SE Florida for 11 days in early September attending to family real estate business and was invited to speak at a local options club which meets 15 minutes from where I’m staying. As many of you know, I’ve never met a microphone that I didn’t want to speak into when it comes to covered call writing, sooooo….
South Florida Options Trading Forum
Thursday September 11th
6-9PM
http://www.meetup.com/options-fl/events/198999922/
Ask Alan videos:
Just a reminder that new Ask Alan videos will be posted on the blog the 2nd Wednesday of each month with some additional videos available on the general site and the entire set available on the premium site. These changes are currently being set up by my outstanding team members.
Market tone:
It appears that the recent market volatility is related on geo-political events occurring in the Middle East and increasing tension between the US and Russia. It certainly cannot be blamed on this past week’s economic reports which continue to be positive:
- According to the Labor Department, the annualized rate of non-farm productivity (a measure of the growth of labor efficiency in producing the economy’s goods and services) rose by 2.5%. Year-over-year, productivity was up 1.2%
- Initial jobless claims for the week ending August 2nd came in at 289,000, less than the 302,000 expected
- According to the Institute of Supply Management, the ISM Non-Manufacturing Index rose to 58.7 in July, showing continued expansion and at the highest level since 2005
- Consumer credit (excluding mortgages) increased by $17.3 billion in June according to the Federal Reserve. This is a report of the dollar value of consumer debt, including categories such as credit card use and store charge accounts (known as revolving debt) as well as longer-term loans for autos, education, recreation vehicles, etc. (known as non-revolving debt). The level of consumer credit is considered a barometer of consumers’ financial health and an indicator of potential spending patterns. This represents an increase of 6.5% year-over-year
- According to the Commerce Department, new orders for manufactured goods rose by 1.1%, well above the 0.6% anticipated. Factory orders were up 2.5% year-over-year
- The US trade deficit decreased by 7% in June to $41.5 billion, narrower than expected and a result of stronger growth in the 2nd quarter
For the week, the S&P 500 was up 0.3%, for a year-to-date return of 6%, including dividends.
Summary:
IBD: Market in correction
GMI: 1/6: Sell signal since market close August 4, 2014
BCI: Moderately bullish but continuing to favor in-the-money strikes while the market digests the events alluded to above.
Wishing you the best in investing,
Alan (alan@thebluecollarinvestor.com)
www.thebluecollarinvestor.com
Premium members: new feature added to our stock reports:
When this week’s report is uploaded to your premium site there will be a new feature added that many of you have been requesting. We are adding a price column to the “running list” in addition to the price column found on pages 2 and 3 of the report. This was a bit of a formatting challenge but we managed to incorporate this information into the ‘running list” without sacrificing cosmetics and readability. The screenshot below shows how it will look when this week’s report is published (do not use the data in this screenshot as it was from last week’s report.
CLICK ON IMAGE TO ENLARGE & USE THE BACK ARROW TO RETURN TO THIS BLOG.
Alan
Hi Alan,
Mid contract unwind exit strategy will be deployed when stock price shoots up.
As per beginner e-book page 35, I am selling a call at $50 strike and stock suddenly moved up to $57 and I am planning to buy back the call so to buy back that call I am paying high amount, as per book example, its $7.10 so by buying back call at $7.10 I would not earn the $7 appriciation in stock price, right?
It will be almost like I bought a stock at $57-(premium that I received while selling call at $50 strike).
Let’s say I sold the $50 strike price with premium of $1.10. Now stock is high at $57, I buy back call at $7.10 so my total investment is stock that I bought at $50+$7.10 = 57.10-1.10(premium of $50 sold call)=$56 so with buy back of call will give me only $1 ($57 current price-$56 total investment after buyback). Is my calculation and understanding correct?
Thanks,
Devang
Devang,
It appears that you are understanding quite well but let me frame it in more detail:
Let’s assume for a moment that you paid $49 for the stock and sold the $50 call @ $1.10. Your max profit is $1.10 + $1 (share appreciation to the strike) = $2.10/$49 = 4.3% for the 1-month. Your shares can never be worth more than $50 with the option obligation.
Now your shares are trading @ $57 and the cost to buy back the $50 call is $7.10. Should you close the entire position, you will incur a debit of $7.10 on the option side and a credit of $7 on the stock side. Net, net a debit of $10/contract. The “cost to close” is $10/$5000 = .2%, a small fraction of 1%.
If the freed up cash can generate a higher return than .2% in the remainder of the contract it pays to execute the mid-contract unwind exit strategy.
Refer to pages 264 – 271 of the “Complete Encyclopedia for Covered Call Writing” for more details and examples of this strategy. There is also comprehensive information in both DVD Programs.
You’re off to a great start!
Alan
Premium Members,
This week’s Weekly Stock Screen And Watch List has been uploaded to The Blue Collar Investor premium member site and is available for download in the “Reports” section. Look for the report dated 08-08-14.
Please note that there was a problem with MSN StockScouter this week (we use the “StockScouter” for our “Risk/Reward” screen). There were a number of stocks that StockScouter inaccurately indicated that data was not available. For those stocks with known historical data availability, we used last week’s data. These stocks are highlighted in red in the Risk/Reward column. If you select any of these stocks, please review them at: http://money.msn.com/investing/stockscouter-stock-ratings.aspx before you place your trade.
Also, be sure to check out the latest BCI Training Videos and “Ask Alan” segments. You can view them at The Blue Collar YouTube Channel. For your convenience, the link to the BCI YouTube Channel is:
http://www.youtube.com/user/BlueCollarInvestor
Since we are in Earnings Season, be sure to read Alan’s article, “Constructing Your Covered Call Portfolio During Earnings Season”. You can access it at:
https://www.thebluecollarinvestor.com/constructing-your-covered-call-portfolio-during-earnings-season/
Best,
Barry and The BCI Team
Alan, On page 315 of the Encyclopedia you show the ETF’s total initial return as 1.70% from a $48,838 investment. But I wonder if there is a mistake here as the premiums have been bought down to the ITM strikes, so shouldn’t this be reflected in the investment amount and also the return? (I had calculated for these 5 ETF’s a $833/$48,836 = 1.71% return?) Thanks
Adrian,
Your math is correct. The denominator shown in the book is $48,838 and share price cost basis IS bought down when selling in-the-money strikes. We agree on the returns a shown in the book:
$833/$48,838 = 1.7056% = 1.71%
In the book it was rounded down to 1.7%
Good catch.
Alan
Hi Alan,
In Aug 01 2014 report, I see RHT (currently at $58.81) stock has passed all criteria for covered call however the option chain shows the expiration of Sept 20 2014 with strike price of $60 (OTM) with premium $1.40.
ITM is $57.50 with premium of $2.65 with sept 20 2014 expiration.
Considering both this option which will you think is better option?
Do you think duration of the covered call is perfect (~40 days) so should we select less number of days then that?
RHT stock doesn’t have many option chain and various expiration duration.
Thanks,
Devang
Devang,
I favor 1-month options and enter my (non-exit strategy) positions on or near expiration Friday and the first few days of a contract such that theta (time value erosion) does not have a significant impact on our option premiums.
Here is where the Ellman Calculator will assist us in our investment decisions. Enter the information you provided into the blue cells of the multiple or single tabs. If the initial returns meet your goals (mine are 2-4%/month) then favor the ITM strike if bearish on the market and OTM strikes if bullish. Chart technicals (bullish in this case) and personal risk-tolerance should also be factored in.
In the screenshot below you see that both offer a similar initial return while the OTM strike offers additional upside potential and the ITM strike offers protection of the initial time value profit.
CLICK ON IMAGE TO ENLARGE & USE THE BACK ARROW TO RETURN TO BLOG.
Alan
Alan,
Being new to this, I never know if my thinking is accurate or not, so please bear with me.
In your example, “Calculating Future Returns Using Delta”, if on expiration Friday the price of the stock were to remain at the current selling price of $60.06,(implementing the do nothing strategy), wouldn’t the buyer of the call exercise his option to mitigate his initial $9.75 investment? And in doing so, leaving you with ($1.29) 2.07% net profit and no stock?
Thanks,,,, Roy…..
Roy,
Good question…it’s always beneficial to understand the thinking that takes place on the other side of the trade…you don’t sound like a beginner!
Before we crunch the numbers I need to point out that the “do nothing strategy” was appropriate mid-contract. On or near expiration Friday, we would evaluate for a possible “rolling exit strategy” but that’s a discussion for another time.
Let’s make the following assumptions:
1- It’s expiration Friday and the shares are trading @ $60.06
2- We decide that no exit strategy is appropriate we “allow” assignment or the sale of our stock.
The key point to remember is that if share price is $0.01 or more above the strike, the shares will be sold @ the strike price unless the Options Clearing Corporation has been instructed otherwise. So we know that our shares will be sold @ $55. Now the math:
1- Of the $9.75 premium, $2.29 is time value or profit and $7.46 is intrinsic value (amount the strike is in-the-money) and not profit but used to buy down our cost basis from $62.46 to $55. So our 1-month return is $229/$5500 = 4.2% for the month per contract.
2- We do lose our shares in this scenario but we also now have $5500 per contract (our original bought down cost basis) to re-invest for the next month’s contract.
4.2% in 1 month…I.ll take that any month.
By the way, these calculations are done automatically for us using the Ellman Calculator as shown in the article screenshot.
You’re off to a good start.
Alan
Alan,
Thanks so much for your prompt reply and reassuring me that I was on the right track. Obviously, I didn’t plug the numbers into the calculator, thinking that doing it longhand, at least for awhile, would somehow anchor the principles. Sadly, this stupid pencil of mine let me down; showing a remainder of $1.29 and not $2.29 of TV. Until I can find a smarter pencil, I WILL be using the Ellman Calculator.
Thanks,,,,, Roy….
Alan, I have another calculation problem to give you based on the lower denominator figure again. For the month of June on one of my papertrades I used ‘GRFS’ and sold an ITM-$45Call.
Price at trade time was $45.28, but ended at $44.82 at expiry.
Now because I wanted to keep this stock and use next month I BTC and STO more options on it.(for July.)
What I am needing to know here is if this opening July return(the BTC/STO amount) and also the final total return should have the $44.82 price as the denominator figure, because of the fact the price didn’t end above $45 the previous month? – is this the cost basis amount to use?(if not then can you tell me why?)
And from your previous answer to my above question I will understand also that I should use the $48,836 investment format, of using the ITM strikes, to get my correct initial and total monthly end returns – even though the book says differently. (I am currently figuring out some past months returns so just need to get the right maths first.)
Thanks for the help.
Adrian,
It appears you are looking for a cost basis when rolling an option. We would do so when the strike is in-the-money only. So let’s say the price is @ $45.50 on expiration Friday. Our decision is the “roll” or allow assignment. To compare “apples-to-apples” we need to use the same denominator. If we allow assignment we generate $4500 per contract so that’s what our shares are worth at that point in time. If the time value credit from rolling the option is $2, then our return is calculated :
$2/$50 = 4%
Now, if the price is below the strike there is no need to “roll” Simply allow the option to expire worthless and write a new call the next month or sell the shares and use the cash for a new position. In this case, shares are worth $44.82 for purposes of deciding which approach to take. For tax purposes, your cost basis is $45.28 minus the premium amount you initially generated.
Use the Ellman Calculators to determine the best investment decisions at any given point in time and use the Schedule D of the Elite version of the Ellman Calculator to calculate long and short-term capital gains (losses).
Alan
Alan, thanks for reply again and 2 things just to confirm my understanding.
– The shares worth of $44.82 at expiry is what I use to decide in calculating the next months returns.(this is what I initially had thought)
– Also because the initial premium was $1.65 then my cost basis for tax comes to $43.63, and as I rolled out the option to a $45call again with the BTC@0.20c and the STO@$1.45, then my c/basis goes down from $43.63 to $42.38.
That’s how I best understood it but please tell me if I’m wrong otherwise I guess it’s right. Thanks
Adrian,
Your calculations (for tax purposes) are correct. However, if the price was @ $44.63 just prior to 4PM ET on expiration Friday, there was no need to buy back the option and incur the expense of $20/contract + commission. Just sell the new option on Monday after the near month option expired worthless. It’s another story if you took this action early in the day or the day before expiration and you were concerned about the strike moving in-the-money. In the latter scenario, rolling would make sense.
You have a clear understanding of the math here.
Keep up the good work.
Alan