
Nov 10, 2018 | Covered Call Exit Strategies, Exit Strategies, Investment Basics, Option Trading Basics, Stock Investing, Stock Option Strategies, Technical Analysis
Technical analysis is one of the critical tools available to us in selecting the best stocks for our option-selling strategies. Price charts are much more than a sequence of dots and lines…they tell a story about a company which, with proper research, ultimately...

Jun 2, 2018 | Covered Call Exit Strategies, Exit Strategies, Investment Basics, Option Trading Basics, Stock Option Strategies, Technical Analysis
Fundamental analysis, technical analysis and common sense principles comprise the 3-pronged approach used in the BCI methodology for screening for option-selling candidates. Technical analysis is the factor that changes most frequently and is the main reason a stock...
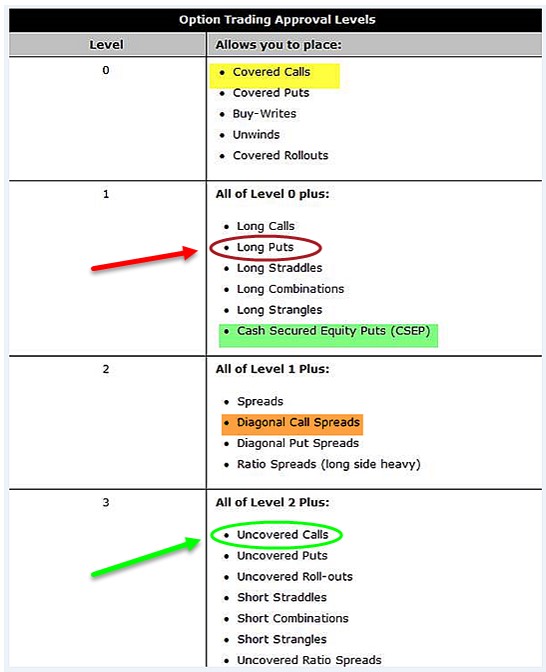
Apr 14, 2018 | Covered Call Exit Strategies, Exit Strategies, Fundamental Analysis, Investment Basics, Option Trading Basics, Put-selling, Stock Option Strategies, Technical Analysis
Selling covered calls and cash-secured puts are the main strategies highlighted in our BCI community. Much of the information disseminated on the Blue Collar site, books and DVDs is based on member feedback, inquiries and comments. In September 2017, Marc sent me an...
Mar 10, 2018 | Covered Call Exit Strategies, Exit Strategies, Investment Basics, Option Trading Basics, Options Calculations, Stock Investing, Stock Option Strategies, Technical Analysis
Covered call writing dilemmas can frequently result from positive circumstances. In August 2017, Vincent shared a trade he executed where an out-of-the-money strike was sold and share price had moved up significantly and was approaching the strike price. This means...
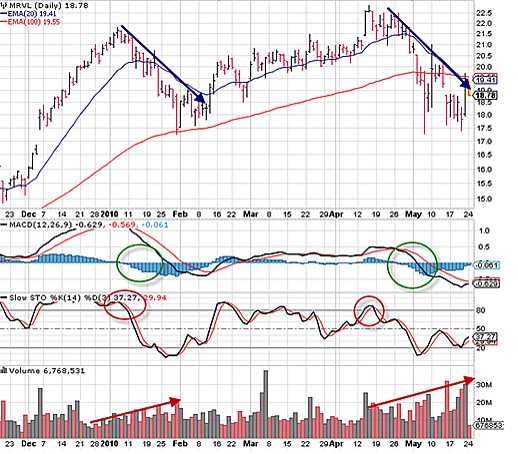
Dec 30, 2017 | Investment Basics, Option Trading Basics, Stock Option Strategies, Technical Analysis
Trading volume is the number of trades for a security in a given time frame. On a chart volume is typically represented as a histogram (vertical bars) and represents a confirmation or lack thereof of the other technical indicators. For example, if a moving average...

Dec 2, 2017 | Covered Call Exit Strategies, Exit Strategies, Investment Basics, Option Trading Basics, Stock Investing, Stock Option Strategies, Technical Analysis
Position management is one of the 3 required skills needed for covered call writing and put-selling. When share price gaps up or down there is a strong possibility that an exit strategy opportunity will present itself. There are times, however, when no action is the...
 Podcast