Covered call writing is the main focus of this site and the BCI methodology. Based on member demand and similarity of strategies we have been adding information on selling cash-secured puts, the topic of my upcoming 5th book. Recently I have received inquiries on related strategies that have led to some confusion specifically about covered puts so I decided to devote this article to that topic.
Defining the two strategies
Covered calls = Buy stock + sell call option = long stock + short option
Covered puts = Sell stock short (borrow shares from broker) + sell put option = short stock + short put option
Note: Selling cash-secured puts is a 3rd strategy that involves only a short put option position secured by enough cash to purchase the shares if the option is exercised.
Outlook for covered puts
A writer of covered puts has a slightly more bearish outlook than does the covered call writer as you will see as we calculate returns later in this article.
Hypothetical example
Sell short 100 shares of BCI @ $52 = $5200 cash generated into your brokerage account
Sell 1 x $50 out-of-the-money put for $1.50 = $150 cash generated into account
We now have two obligations: One to buy the shares @ $50 if the option holder chooses to exercise and the other to replace the 100 borrowed shares.
Breakeven
$53.50– any move above $53.50 will result in a loss. At this price we will lose $150 replacing the shorted stock (sold at $52 and bought @ $53.50) which is compensated for by the $150 put premium sale.
Maximum profit
$2 on the stock side ($52 – $50) for closing prices under $50 + $1.50 from the put sale = $3.50/share = $350/contract
No matter how low the share price moves, we purchase the shares @ $50 due to our put obligation and this is why covered puts is a bearish strategy as we max our trade as share price declines and lose money if share price accelerates past the breakeven ($53.50 in this case).
Maximum loss
Technically, unlimited as share price rises above $53.50, but $150 less than if the put was not sold and only the stock shorted. This also assumes no position management, an unfair assumption for educated investors.
Covered put graph
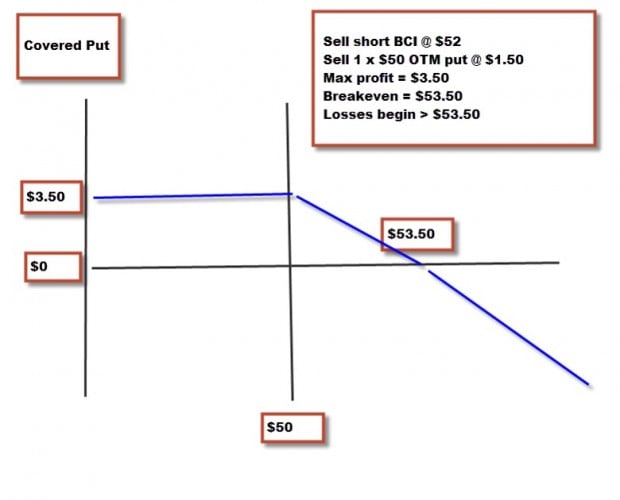
Covered put graph
Type of brokerage account required and level of trading approval needed
Since the strategy involves shorting a stock, a margin account (not a cash account) is required with a high level of trading approval, much higher than that required for covered call writing.
Margin and interest
This will vary from broker-to-broker but a typical margin requirement of the short stock sale is 50% ($2600 in this case) and none on the options side. Since we are borrowing the stock from our broker, we will be required to pay interest on that loan and this should be calculated into our results.
Summary
Most strategies if implemented and managed properly can be profitable. For most retail investors, covered puts are not appropriate and should be considered only by experienced, sophisticated investors. Covered puts and selling cash-secured puts are two completely different strategies.
Ask Alan videos and website enhancements
Now that I’ve produced over 100 Ask Alan videos covering a myriad of topics related to covered call writing we have developed a tremendous media database for our members. Thanks to all of our subscribers, both general and premium, who have supplied these valuable questions. Related to this milestone I have asked my great team to undertake the following project:
General site
- Create a link to a page of “The Best of Ask Alan Videos“
- Each of these 10 videos will address a question related to one of the 10 categories featured in the series
- We will provide a dropdown menu of topics and a keyword search
- The 2nd Wednesday of each month, I will produce a new Ask Alan video and make it available on the general site as we have in the past and this new video will be rotated into our Best of Ask Alan video series
Premium site
- Create a link to ALL 100+ Ask Alan videos
- As new Ask Alan videos are produced, they will be added to this database
- A dropdown menu of categories and a keyword search will be available to provide the pertinent information sought
Now that we have successfully migrated both our general and premium sites to more powerful servers, we have the ability to provide even more information and services than we have in the past and in a highly user-friendly venue. In the very near future we will be adding information related to selling cash-secured puts as my 5th book is near publication and I also envision a 3rd section of the Blue Collar website devoted to students and longer-term investing.
I will never lose sight of the fact that without you the Blue Collar brand and name could never have become what it is today and I will always be grateful for your support. Thank you.
Market tone:
What a difficult and strange week it was for the stock market! Why was there such a sharp decline? Geo-political events? Global economic concerns? Perhaps, but how about another theory…the economic reports were so good this week that institutional investors are hypothesizing that interest rates will be elevated sooner than anticipated. I am still scratching my head. In any case, this week’s bullish economic reports:
- According to the Commerce Department, GDP for the 2nd quarter came in at an annualized rate of 4%, better than the 3% expected
- The 1st quarter GDP decline was revised upward from (-) 2.9% to a less steep (-) 2.1%
- According to the Labor Department, the Employment Cost Index for the 2nd quarter rose by 0.7%, more than the 0.5% predicted by analysts. A rise in wages bodes well for higher consumer spending
- In a statement released after the July 29 – 30 FOMC meeting, the central bank noted how economic activity rebounded in the 2nd quarter with labor market conditions improving. Bond purchases were reduced by $10 billion to $25 billion and should be over by October
- The Fed maintained interest rate guidance between 0 and 0.25% and projected that target for the foreseeable future
- The US economy added 209,000 jobs in July, less than the 235,000 anticipated but May and June stats were revised higher by a combined 15,000 jobs
- Job increases have exceeded 200,000 for each of the past months
- The unemployment rate edged up from 6.1% to 6.2% but well below last year’s rate of 7.3%
- 1.7 million people were added to the labor force in the past 12 months
- According to the Commerce Department construction spending declined by1.8% in June, below expectations
- The Conference Board’s Consumer Confidence Index rose impressively to 90.9 in July well above the 85.3 predicted fueled largely by an improving labor market
For the week, the S&P 500 declined by 2.7% for a year-to-date return of 5%.
Summary:
IBD: Uptrend under pressure
GMI: 3/6: buy signal since April 22, 2014
BCI: This site remains moderately bullish on the economy but will use in-the-money strikes to enter new positions until the market behavior becomes clear
My best to all,
Alan (alan@thebluecollarinvestor.com)
www.thebluecollarinvestor.com
Quote shared with me by James Defranco:
“I tell clients who are procrastinating when starting a buy/write playbook is like going to the dentist. You may dread going but you will feel better once you have gone”
Jim is President of the long Island Stock Traders Meetup Group:
http://www.meetup.com/LISTMG/
Alan
Alan,
Can you comment on your preference between covered call writing and selling cash secured puts for retail investors.
Thanks for all the information you make available to retail investors.
Joe
Joe,
Both are excellent strategies once all aspects are mastered (selection of underlying security, strike selection and position management). You are one of many members who have expressed interest in this strategy and that is why I have written a book about it that will be available in the very near future.
I favor cc writing in normal and bull market conditions because we can take advantage of share appreciation when selling out-of-the-money strikes. Also, use in sheltered accounts and lower levels of trading approval are other advantages of cc writing.
However, in bear market conditions, we can sell out-of-the-money cash-secured puts to generate monthly cash flow (like selling in-the-money strikes with cc writing) and, if exercised, enter a cc position at a lower price. All this is explained in my upcoming book.
Bottom line: these are both excellent strategies for retail investors that must be mastered before utilized and can be used to supplement one another as well.
Alan
Premium Members,
This week’s Weekly Stock Screen And Watch List has been uploaded to The Blue Collar Investor premium member site and is available for download in the “Reports” section. Look for the report dated 08-01-14.
Also, be sure to check out the latest BCI Training Videos and “Ask Alan” segments. You can view them at The Blue Collar YouTube Channel. For your convenience, the link to the BCI YouTube Channel is:
http://www.youtube.com/user/BlueCollarInvestor
Since we are in Earnings Season, be sure to read Alan’s article, “Constructing Your Covered Call Portfolio During Earnings Season”. You can access it at:
https://www.thebluecollarinvestor.com/constructing-your-covered-call-portfolio-during-earnings-season/
Best,
Barry and The BCI Team
Alan, my question again I asked before was because of my ~7hr time difference from the ‘US’, I wonder whether my papertrading should only be done during market hours, or could I keep putting on practice trades after-hours as I have been doing? (I usually get a rough idea of the options values at given times by using marketwatch.com)?
What is your idea about this?
Adrian,
For the highest degree of accuracy, trades should be executed intially during market hours. This will be a 1-time per month inconvenience for members trading in different time zones.
You can then enter “limit” orders to buy back the options using our 20/10% guidelines where you do NOT have to be in front of your computer to buy back the option should share value decline. If an exit strategy opportunity arises and a new option will be sold, or the shares sold, yes, during market hours would be more accurate.
With proper preparation during hours that ARE convenient for you, I don’t see “inconvenient ” hours being more than 1-2 per month depending on the size of your portfolio. This will be another benefit of paper-trading where you can a handle on this aspect of trading on US exchanges and I congratulate you for paper-trading initially.
Alan
Hi Alan,
As I understand your system, when in the 1st half of the option cycle and the option premium decreases to =<20% of the original premium received, that I can buy back the option and (according to the Appendix XIII flow chart) either roll down or unwind entire purchase…IF the market tone and Technical analysis are both "Mixed to Negative".
Pretty much, after the DOW sank 300 points in a day, everything was pretty negative. Should I make my decision based upon the one very bad day, or should I wait for further confirmation of the negative outlook?
Your method and books are "just what the Doctor ordered" for us amateurs.
Thanks for all that you have done for us,
Rich
PS-I can't wait for the organization and categorizing of your 100 videos!
Rich,
Great question. Whenever there is a major movement in the market in one trading day emotions tend to run high…even for the professionals. It is important to “stick to the plan”
All options that meet our 20/10% guidelines should be bought back (buy-to-close) immediately.
If we were early in the contract, I usually wait a few days to a week to look to “hit a double” or re-sell the same option. At the end of a contract, I favor rolling down to a lower strike.
If a stock is dramatically under-performing the overall market I will sell the stock. Specific examples of each situation are detailed in my books/DVDs.
In this case we are midway through the August contracts…a borderline scenario. In these cases, I will wait 1-3 days at most as I look to re-sell the same option and if no recovery, roll down early in the upcoming week.
Thanks for your generous remarks and positive feedback regarding the organization of our “Ask Alan” video series.
Alan
Alan,
In reviewing the Weekly Stock Screens for potential entries I often have the situation where the available funds in a given account limit an entry a stock price under a given price. I would also prefer to buy 200 or more shares to get a better return after commissions are factored in.
The stock prices are shown on the “Passed All Screens” and “Passed All Screens, Mixed…Eligible” lists near the beginning of each report, but not on the “Running List”. Since the Running List has additional helpful info, including which stocks have been good performers over time, I find myself writing in prices of lower priced stocks from the earlier lists on the Running List.
I imagine my situation is not unique. Is it possible to include the prices on the Running List?
HS
Hello HS,
We have received this request in the past and it is on our enhancement list for a possible future upgrade While it does, in fact, make sense to add this enhancement, it would mean an extensive reformatting of the “Watch List” section of the report.
As it stands now, there is no room for an additional column without reducing the size of the other data elements. Since there is a lot of data already provided (in a fairly tight space) for each entry, we have felt that it would negatively impact the readability of the current data set.
Best,
Barry and the BCI Team
HS,
You were the “tipping point”, re: adding a price column to the “Running List” section. It took a lot of trial and error to “steal space from other columns to be able to fit the price column in without impacting the readability of the report. Thank you for the “final push”. We think it came out pretty well.
Best,
Barry
Alan,
As you know I am a long term subscriber who has benefited greatly from your work and become a better investor so my thanks as always.
I look forward to your upcoming book because entering trades through selling cash covered puts has become my vehicle of choice. Picking the correct stock is forever the first step. So I use the Premium Member List and sell cash covered puts a little ITM to get a good premium. I then take a portion of the premiums and buy OTM protective puts in case the stock goes down. Like any insurance you hope you never need it but are glad to have it when you do. This past week was a great case in point with the sell off.
I also bought back a few calls that fell below 20% on my long positions and as you explain above I am waiting to see what happens in the new week before writing again or exiting the positions.
When I am assigned a cash covered put I of course then own the stock and write a covered call against it for the second income stream and manage it thereafter per BCI methods.
I find the two approaches work well together but both need a stable to rising market to work best. These days taking some premium income and buying the OTM puts helps me sleep better :). – Jay
Jay,
Thanks for your valuable feedback and sharing your experiences with the BCI community. I will be incorporationg the “Put-Call-Put” strategy in my upcoming book.
Alan
Hi Alan
I am new to options trading and have bought your book and video. I haven’t quite started reading your encyclopedia yet, but have watched your exit video.
In the video you say to buy back your option once 80 to 90% of your profit has been attained. This maybe the second or first to last week in the month. Is there a calculation or a way to predict when this level should happen, so you could set up an contingent order. I live in Australia.
Thank you and have a great day
Kevin
Kevin,
I always love hearing from our international members.
Once we sell the initial option, we have achieved 100% of our initial profit. That cash is ours to keep, no matter what happens during the contract month.
The question that we must address from time-to-time is whether it makes sense to execute an exit strategy when the opportunity arises. Our 20/10% guideline is quite helpful in this regard. We always buy back the option when the premium value reaches 20% or less of the original premium in the 1st half of the contract and 10% or less in the 2nd half.
For example, if we sold the original option for $2 we will buy it back for $0.40 or less in the 1st half and $0.20 or less in the 2nd half of the contract.
You can place a “buy limit order” for these amounts after you place the initial trades so the process is automated.
Finally, the time frame to reach the point of execution can vary depending on the price of the underlying and may never be reached so each case must be evaluated on its own merit.
The Encyclopedia…will fill in all the details with examples to clarify.
Alan
New seminar just added: Coral Springs Florida:
South Florida Options Trading Forum
Thursday September 11th
6-9PM
http://www.meetup.com/options-fl/events/198999922/
Hi Alan
New member, enjoy your site and books. I was looking at some of the new recommendations EEFT and RHT and was wondering since these types of new stocks on the IBD site make new highs, they are often times extended away from the 20ema. Do you wait to buy the stock on some sort of a pullback. I have a history of picking the tops when I buy…LOL
Thanks
Steve
Steve,
When a stock price is uptrending and confirmed by both momentum indicators, I tend to take a bullish stance in normal or bull market conditions. It is important to also factor in overall market assessment (VERY IMPORTANT) and personal risk-tolerance as well.
With the market behaving in an unpredictable fashion of late, I am turning to in-the-money strikes as I indicated in the “market tone” section of this blog article. This will allow for time value capture but also protection of that initial profit.
Our obligations are only 1-month so we can alter our level of aggressiveness on a monthly basis, all the while having our exit strategy arsenal prepared as opportunities arise.
Alan
Premium members:
This week’s 8-page report of top-performing ETFs and analysis of ALL Select Sector Components has been uploaded to your premium site. The report also lists Top-performing ETFs with Weekly options as well as the implied volatility of all eligible candidates.
For your convenience, here is the link to login to the premium site:
https://www.thebluecollarinvestor.com/member/login.php
NOT A PREMIUM MEMBER? Check out this link:
https://www.thebluecollarinvestor.com/membership.shtml
Alan and the BCI team
Running list stocks in the news: LYB:
LyondellBasell, a Dutch plastics, chemical and refining company reported a stellar 2nd quarter earnings report on July 25th. Earnings increased by 29% year-over-year and sales rose by 9%, well above consensus estimates. Operating cash flow was up an impressive 44% allowing LYB to buy back 19 million shares in the quarter finalizing its 10% share repurchase authorization and has also begun buying back shares under another 10% repurchase authorization.
In addition, analysts are raising earnings-per-share estimates for 2014 and 2015 to 19% and 14%. Despite a 37% increase in share price year-to-date, LYB is trading at a forward PE of under 13, below the industry mean of 15. The company also boasts a stellar return on equity (ROE) of > 30.
Need more? The company recently raised its dividend by 17% as it has 6 times in the past 3 years in addition to 2 special 1-time dividends.
Our Premium Stock Report shows an industry (Chemical) rank of “A”, a beta of 1.07, a % dividend yield of 2.60, and adequate option open interest. All these factors have led to a price chart as shown below. CLICK ON IMAGE TO ENLARGE & USE THE BACK ARROW TO RETURN TO BLOG:
Alan