Whenever a covered call trade results in a maximum return, it is a successful trade…period…end of story. To most, this statement appears nonsensical and self-evident. But I’m here to tell you that there are a lot of covered call writers that question that success. In late December 2017, Paul shared with me a series of trades he executed that resulted in a return that left him a bit discouraged. There were several components to his trades, but we will focus on the final trades:
Paul’s trades
- 11/16/2017: Long 800 SPY (SPDR S&P 500 ETF) at $258.91
- 11/16/2017: Sell (short) 8 x $255.00 12/15/2017 at $5.44
- 12/8/2017: (1-week prior to expiration) SPY was trading at $265.05
- 12/8/2017: $255.00 call was trading at $10.33
- 12/8/2017: Paul wanted to avoid exercise and was considering closing the short calls
Calculations when entering the trade
Since an in-the-money strike was sold, we know that there is no opportunity to enhance returns via share appreciation. Let’s feed this information into the Multiple tab of the Ellman Calculator:
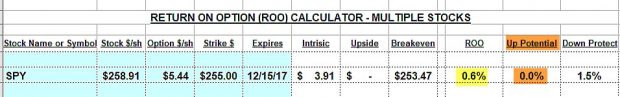
SPY Calculations using the Ellman Calculator
The initial time value return when entering the trade was 0.6% (yellow field) with no opportunity for additional profit (brown field). There was a 1.5% protection of that initial time value profit. The trade goal had been defined upon entering the trade. No matter how high the share price rises that goal of 0.6% for the 1-month has been realized.
What about the cost-to-close if we want to retain our shares?
Initially, it would appear that the cost-to-close the short call ($10.33) is quite expensive especially when compared to the initial $5.44 premium received. However, we must view this cost through the lens of share value as well. When the $255.00 call was sold, the price of SPY could never be worth more than that strike price while the contract obligation was in effect. If the call is bought back (buy-to-close), share value rises to current market value or $265.05, an increase of $10.05. This means that the actual time value cost-to-close is only $0.28 per- share ($10.33 – $10.05). Since this evaluation took place a week prior to contract expiration, waiting another week would result in an even lower time value cost-to-close.
What if Paul bought back the short call to avoid exercise?
On 12/8/2017, to close the short call would cost Paul $10.33, $10.05 in intrinsic value and $0.28 in time value. The time value cost-to-close is 0.11% ($0.28/$255.00). A lower cost-to-close would be achieved if we wait closer to contract expiration.
Discussion
Certainly, Paul would have generated a higher return not having sold the option. However, it never makes sense to look back on a trade and feel that more money could have been generated if a different strategy was used. We all would have made a fortune if we used the lottery numbers on Friday’s ticket purchase with the numbers we read in the newspapers on Sunday. Paul managed this trade to perfection given the following assumptions:
- His goal was about 1/2% per month
- He was bearish or concerned about the market and wanted the protection of an in-the-money strike
I’m going with those assumptions so congratulations Paul on achieving maximum returns.
Upcoming events
Denver Colorado: American Association of Individual Investors
August 18 @ 9:00 am – 12:00 pm
Saturday August 18, 2018
Click for information and registration details
San Francisco Money Show
August 23 @ 10:00 am – 11:00 am
Hilton San Francisco Union Square
1.Thursday August 23rd: 12:30 PM – 1:15 PM
All Stars of Options: “How to Select the Best Covered Call Options in Bull and Bear Markets”
2. Friday August 23rd: 10:15 AM – 1:15 PM
Masters Class: “How to Generate Monthly Cash Flow and Buy a Stock at a Discount Using 2 Low- Risk Option Strategies (covered call writing and selling cash-secured puts)”
3. Friday August 23rd: 6:00 PM – 6:45 PM
Workshop: “Converting Non-Dividend Stocks to Dividend Stocks using Stock Options”
Market tone
This week’s economic news of importance:
- Pending home sales June 0.9% (-0.5% last)
- Employment cost index Q2 0.6% (0.7% expected)
- Personal income June 0.4% (as expected)
- Consumer spending June 0.4% (0.5% expected)
- Core inflation June 0.1% (as expected)
- Case-Shiller home price index May 6.4% (6.4% last)
- Consumer confidence index July 127.4 (127.0 expected)
- ADP employment July 219,000 (181,000 last)
- Markit manufacturing PMI final July 55.3 (55.4 last)
- ISM manufacturing index July 58.1% (59.5% expected)
- Construction spending June -1.1% (0.2% expected)
- FOMC announcement 1.75 – 2% (as expected)
- Weekly jobless claims 7/28 218,000 (220,000 expected)
- Factory orders June 0.7% (as expected)
- Nonfarm payrolls July 157,000 (195,000 expected)
- Unemployment rate July 3.9% (as expected)
- Average hourly earnings July 0.3% (0.2% expected)
- Trade deficit June -46.3 billion (-46.6 billion last)
- Markit services PMI July 56.0 (56.2 last)
- ISM non-manufacturing index July 55.7% (58.6% expected)
THE WEEK AHEAD
Mon August 6th
- Survey of consumer expectations July
Tue August 7th
- Job openings June
- Consumer credit June
Wed August 8th
- None scheduled
Thu August 9th
- Weekly jobless claims 8/4
- Producer price index July
- Wholesale inventories June
Fri August 10th
- Consumer price index July
- Core CPI July
- Federal budget July
For the week, the S&P 500 moved up by 0.76% for a year-to-date return of 6.24%
Summary
IBD: Market in confirmed uptrend
GMI: 5/6- Bullish signal since market close of July 9, 2018
BCI: Using an equal number of in-the-money and out-of-the-money strikes. Impact of tariffs/trade wars unclear.
WHAT THE BROAD MARKET INDICATORS (S&P 500 AND VIX) ARE TELLING US
The 6-month charts point to a bullish tone. In the past six months, the S&P 500 was up 8% while the VIX (11.69) down by 70%.
Wishing you much success,
Alan and the BCI team
Alan,
I recently purchased your latest book, “Covered Call Writing Alternative Strategies” and have enjoyed it a great deal.
I am attempting to implement the Poor Man’s Covered Call strategy on stocks with great long term chart patterns and strong fundamentals. I have been able to find numerous great candidates. However, after spending several hours scouring options chains, I have been unable to identify any candidates that meet the requirement that the difference between the LEAPS strike and the short call strike, plus the short call premium be greater than the LEAPS premium paid. In every single case, the amount paid for the LEAPS call premium was greater, and sometimes much greater than the difference between the two strike prices, plus the short call premium. ( I am looking at the September 17 expiry for the short call options and the Jan. 2020 expiry for the LEAPS options. Am I doing something wrong, or is this just a poor market environment for attempting the Poor Man’s Covered Call strategy.
Your help in this matter will be much appreciated. Thanks.
Kent
Kent,
Let’s use INTC, one of the stocks highlighted in the new book.
With INTC trading at $49.29, I will use Friday’s published prices with the understanding that leveraging the “Show or Fill Rule” may allow better price execution.
Buy the 1/2020 $25.00 LEAPS at $24.65
Sell the 9/21/18 $50 OTM call at $1.17: ($50 – $25) + $1.17 > $24.65…meets our requirements or
Sell the 9/21/18 $52.50 call at $0.42: ($52.50 – $25.00) + $0.42 > $24.65…meets our requirements
The screenshot below shows the potential outstanding returns for the first month of the trade using the BCI PMCC Calculator.
Let me know if you need additional clarification.
CLICK ON IMAGE TO ENLARGE & USE THE BACK ARROW TO RETURN TO BLOG.
Alan
Alan;
I have finished reading your new book and enjoyed it very much, thank you. I have a question on one of the exit strategies for the PMCC.
When the short call trades deep in the money and both calls approach parity, you recommend unwinding both positions.
Could you also:
– roll out and up if you wanted to keep the underlying
– unwind both legs and then reestablish new position with same underlying
– unwind and look for new stock to trade
What approach is best?
Thanks;
Terry
Terry,
The 3rd choice is best in most circumstances with the 1st choice second best.
For those members new to the “Poor Man’s Covered Call”, Deep ITM LEAPS (long-term) options are purchased instead of actual stocks or ETFs and then short-term covered calls are sold against these securities. Now the initial structuring of our trades are required to meet the following formula:
(Difference between the 2 strikes) + initial short call premium > cost of LEAPS option
If share price accelerates dramatically to the point where both options are trading at parity (intrinsic value only), the cost-to-close will significantly increase the cost basis of our position. This may or may not be practical and always puts us in a position where profit-taking may result in subsequent losses. It is the reason we sell the underlying with our mid-contract unwind exit strategy (see both versions of The Complete Encyclopedia to review this exit strategy).
These scenarios are precisely the reason why the initial structuring formula is so important. Imagine setting up a PMCC trade where we are directionally correct, yet lose money when share price moves up exponentially and we are forced to close at a loss.
For more information on initial structuring of the PMCC trade, see pages 117 – 133 of “Covered Call Writing Alternative Strategies”
Thanks for this excellent question Terry.
Alan
Alan,
Thank you for a very helpful and re-instructive blog topic for this week. I call it that because it took me a while to understand and internalize what success looks like with covered call trades. And by that I mean I used to let perfectly successful trades that went exactly as planned get under my skin because a given stock I covered took off that month and I felt left at the bus stop. Then if I bought back the now expensive call and the stock had some normal profit taking I felt frustrated all the more.
That was completely a symptom of my wrong thinking, immaturity as a covered call writer and greed.
We have new friends joining us all the time. Some are just starting with selling options. For what it is worth for those folks what I had to learn is make the most of the strategies I chose fighting any greed instinct that made me think mid stream or after the fact I should have done it differently. Save that for next time at the outset. And then laugh at how often you second guess those trades too….it’s human nature :)! – Jay
Jay,
Thanks for your well-constructed confirmation of this article. It is one of main concerns of new option-sellers and it is so important to also hear this philosophical approach from some of our more experienced investors.
Alan
Premium Members,
This week’s Weekly Stock Screen And Watch List has been uploaded to The Blue Collar Investor Premium Member site and is available for download in the “Reports” section. Look for the report dated 08/03/18.
Also, be sure to check out the latest BCI Training Videos and “Ask Alan” segments. You can view them at The Blue Collar YouTube Channel. For your convenience, the link to the BCI YouTube Channel is:
http://www.youtube.com/user/BlueCollarInvestor
Since we are still in Earnings Season, be sure to read Alan’s article,”Constructing Your Covered Call Portfolio During Earnings Season”. You can access it at:
https://www.thebluecollarinvestor.com/constructing-your-covered-call-portfolio-during-earnings-season/
Best,
Barry and The BCI Team
barry@thebluecollarinvestor.com
Alan,
Still with setting limit orders with the show or fill rule,, I can understand a Market order should be used for the DMCP strategy, because the stock price is declining so there should be no time to muck around with getting ‘best-prices’.
But what about for ‘roll-downs’- the price is still(or has been) declining, so shouldn’t a Market order again be of more importance to implement,- because if I wait for Limit order to fill it may take longer, and by then the price may likely have fallen further still? (so probably would then need to re-assess whole trade orders?)
Thanks,
Adrian
Adrian,
When there is a bid-ask spread of $0.15 or more, I find it almost always make sense to leverage the “Show or Fill Rule” by setting limit orders. We are literally talking about seconds to implement. Let’s take a spread of $0.50 – $1.00. I will usually place a limit order to BTC for $0.80 or a limit order to STO for $0.70. In a couple of seconds, we will see that order reflected in the new spread or the trade will be executed. If in the new spread, we can try a new limit order or settle for the published bid or ask stat.
Alan
Alan, New member here,,,, Question, regarding the premium report that comes out each week, should we only buy new CC positions for the next month at expiration of the prior month. For example, we just completed the July expiration and the following Monday, I placed some CC trades for August expiration. With the report that came out this weekend are we still placing trades for August or going out to September? What is the cut off for making August CC trades ? Thanks
Mike
Mike,
My personal preference is to have all my positions with the same expiration date. For me, it makes management so much more practical. I enter the bulk of my trades on Monday or Tuesday of the new contract month (after expiration Friday) in addition to the trades I hold from rolling the previous month’s options.
All the stocks in the white cells are eligible for the current contract month which expires on 8/17. If we close a position and need a replacement stock, use the most recent reports (stock, ETF or Blue Chip).
You will also note that the stock list is crafted such that stocks are separated by earnings dates and the contract month they will fall in. The broken and solid black lines define this information.
Alan
Alan- first thank you for sharing your passion. You are an accomplished communicator and teacher.
What is the birthdate of an option chain? It’s date of death normally is 4:00 pm eastern time, 3rd Friday of month. Is it true that the premium is highest at birth, and like life, starts expiring one day at a time, although not linear?
Does your calculator calculate returns based on number of days held?
So should initial option sale be near birth? Week 1, 2, 3, 4? to maximize premium?
You may already have an article on this. If yes, please point me to it.
Thanks a lot.
Ron
Ron,
Thank you for your generous remarks.
Option initiation is based on the expiration cycle assigned to the underlying. here is a link to an article I published on this topic:
https://www.thebluecollarinvestor.com/stock-option-expiration-cycles-beware-of-expiration-dates/
We have multiple calculators. The ones that calculate annualized returns base that stat on the 3 of days in the trade.
When using Monthly options, it is best to initiate the trade after expiration of the previous month’s options…Monday or Tuesday of the following week. This will allow us to avoid the negative impact of time value erosion (Theta). here is a link to an article I published on this topic:
https://www.thebluecollarinvestor.com/theta-time-decay-of-our-option-premiums/
Alan
I’m writing today to tell my recent tale of woe. Actually, I think it’s more appropriately named “Tale of *DOH!*” So, on 7/20/18, I decided to do some covered calls on HQY, CPRT, and HDS. However, I got cheeky and bought only the shares first to capture higher call premiums when the prices go up instead of doing buy/writes. I won’t even say what happened in the next several days after buying the shares since one glance at the charts will tell all. The moral of the story is that I could have very well hit doubles on all three of these had I stuck to the prescribed strategy of doing buy/writes. Instead, I’m still holding the shares waiting to just hit a single! *ARGH*
One of the many great things that I like about the buy/write strategy is that it doesn’t matter if your shares are going up or going down….either way, there is potential to make more money. This effectively removes almost all of the anxiety/frustration that I used to feel when I would see my shares start to fall. The frustration is now replaced with happy feelings of potentially doubling income on my premiums. So, from now on, it’s buy/writing every single time!
The other thing I want to add is that today’s market conditions of uncertainty and geopolitical shenanigans have created what I think are the most ideal setups for covered call writing. So long as you select great companies, you can be sure that any downturn is probably the result of let’s say a ridiculous tariff tweet, or Jerome Powell yammering on about inflation, or some mega-company missing earnings to create artificial moves in the securities you own. Makes for ample opportunities to hit doubles and maybe even triples if you are lucky!
Joanna
Joanna,
You have described a characteristic of mine. I seem to be unable to fully learn something without having paid for the knowledge.
From your previous posts it seems that you only need to learn it once; unlike me who needs to relearn time and time again. You have learned something here that will serve you well if you have, or create, the discipline to follow the BCI strategies.
As I have said many times discipline is as important as knowledge. Someone once said, “A poor plan well executed is better that a good plan poorly executed.”
Another person who I respect tremendously, Dr. Alan Ellman, said on 07/31/17, “I never hold a stock more than 2 months due to the rule of avoiding earnings reports which come up quarterly here in the US.”
Now, that’s discipline!
So here’s wishing you the rewards of applying discipline to the knowledge of strategies that you are acquiring. That knowledge and the discipline to use it will serve you well for your investing career.
Good luck,
Hoyt T
Hey Joanna,
Thanks for a great, thoughtful and informative post! It hits home for me because on past blogs I have advocated to do what you did on these 3 stocks: “buy and wait” to over write. In fact I can’t recall the last time I did a “buy/write” same ticket. I’m sure there have been a few times I wish I had but on balance that has worked for me.
Now, a huge caveat here: I do not manage positions month to month or have a high turnover between earnings reports like many traditional covered call writers do. That would make buy/write more attractive to jump on most possible theta decay each month. I buy what I think are good stocks when they go on sale like after a bad earnings report, hold them until they get better and then look at doing some over writing.
I find it interesting to read how each of us with our different psyche’s and time frames arrive at our preferred approaches.
Could not agree more with your final paragraph! I have developed a fondness for selling CSP’s on the big down days further out of OTM, let the underlying catch it’s breath, buy the depleted CSP back and do it again in my short term
trading portfolio allocation on next opportunity.
Success and regards, – Jay
P.S., I just read Hoyt’s reply and agree with it also. He has been at this longer than most and always shares great insight.
Hi Joanna,
I am a consistent Buy/Write fan too.
I believe it is impossible to forsee which way the underlying stock will move, and I do not like 50/50 bets. Therefore, Buy/Write is the best for me.
But you must be very cautious during the options cycle.
Hitting a “Double” is not easy, and mostly rare.
Exit strategy is most important, because once a stock has started to go down, there is a strong probability that it will continue to go down for a while, and you must not wait too long.
Cut your losses before they become disastrous.
Follow Alan’s instructions closely, and manage your trades constantly, unemotionally and with courage.
Best of luck – Roni
Hey Roni,
Joanna started a fine conversation I hope others chime in on!
Maybe I am being too agreeable but everything she, Hoyt and you have posted makes perfect sense to me!
And when you say “once a stock has started to go down there is a strong probability that it will continue to go down” I find so true.
Yet isn’t the reverse of that the premise of Barry’s Premium list for top performing stocks? Likely a matter of physics: objects in motion tend to stay in motion until acted on by an outside force…
Because both of you are right and not in conflict I do different things simultaneously. I love selling options and I love buying them, I love holding stocks and I love trading them. I love leveraging what has worked and I love trying new things.
It keeps me ever on my toes and learning! – Jay
Jay,
we all basically agree, and try to help each other with our posts.
That is the reason we are members in this wonderful community.
Roni
Well said Roni.
I interact socially with smart people who enjoy stock investing and are proud of their portfolios which they love to talk about. Yet when I mention options trading saying it is my retirement hobby which generates income they look at me like I am from Mars :).
They think dividends and interest are the path to income investing. Options are too risky.
Debate in social settings is rude so I never disagree or do an impromptu workshop. I just become more convinced those of us who use options selling in any manner in our investing have an advantage over those who don’t. – Jay
Hi Roni,
You are right on. We all want a community where each person honestly share their experiences, the good, the bad and the ugly. We do this in hopes of being able to think about those experiences and see if we can derive any principles that can be used in our own strategies.
It might be that we learn what we might not want to do as well as what we might want to do.
More often these experiences seem to re-enforce the overall BCI approach. My view remains that the BCI principles are the most conservative, less time consuming and most financially rewarding method of stock investing.
Without beating a dead horse, my posts are intended to, aside from the fantastic fellowship of kindred souls, stress that the keys to success are discipline and execution. These actually go hand in hand.
Actually, Larry Bossidy wrote a book, “Execution: The Discipline of Getting Things Done”. After 34 years at GE under Jack Welch, Larry became Chairman and CEO of Allied Signal, which then bought Honeywell and changed its name to Honeywell. It is one of my all time favorite business books.
I keep extensive records of all my trades and I have noticed an alarming pattern to my biggest mistakes. My biggest winners and losers were/are long calls. Long calls are not conservative and are much more risky (see my recent post on FB). What I am about to say is directly related to the article above this quote. I have done very well on my long calls where the return fell into my goals for the trade, very much like a covered call position where we have a percentage profit goal at the beginning. Where I have mostly gone wrong is when my position begins to really succeed early. Where I normally reduce my position, sometimes taking all my original investment off the table, I leave it all in. Mostly this works out good if not great. But in the case of FB I had $7,800.00 invested in FB SEP 21 “18 $180 Call. On July 25 FB closed at $217.50. I had $37.50 per share intrinsic value. With time value I had over $32,000.00 profit in the position. Shortly after 4:00pm I had about a $1,000.00 loss in the position. I had opened the position on March 26. FB was trading at $159.83. I had survived one earnings report in April and thought the Cambridge Analytical scandal was behind FB.
Had I had the discipline to follow my rules this could have been avoided. Fortunately my losses were primarily unrealized gains but it still hurts.;)
“Losing money in the stock market hurts a hell of a lot worse than making money in the stock market feels good”. I don’t know who said that but I agree.
Hoyt
Hey Hoyt,
I am glad you joined our group as it is helpful to have someone with your experience commenting here.
That said, there is a new thread started so wouldn’t it be a shame if you missed that compliment and never read this :)?
Thanks for your FB story. I buy options and call/put spreads all the time in my IRA. I have a simple put buy open on X (US Steel) now which is approaching the point where I can take my money back out and just let the rest run a bit before taking that out too.I will do that. It is always my first rule on option buys.
I agree with you that if one is going to speculate buying options a set of rules – not guidelines – is of great value. -Jay
Thanks Hoyt, Thanks Jay,
that’s the spirit.
Roni
Joanna,
For our covered call writing or put-selling portfolios, we select our underlyings based on fundamental, technical and common sense analysis. Then we check the option chains to make sure the premium can generate initial time value returns that meet our goals. Assuming all requirements meet our goals, the stock is included in our monthly portfolio.
Now, buying a stock and waiting for share appreciation is adding additional risk to a conservative strategy. Any security can be brought down by a declining market. If that occurs, time value returns may now not meet our goals. Or we may have to use a lower strike, locking in a loss on the stock side. If share price rises, we win but is the risk worth it?
The BCI guideline for buying a stock specifically for covered call writing is to buy the stock and sell the option simultaneously (buy stock and then immediately sell the option or use a buy/write combination form). At this point, we have successfully established our initial time value return goals and move to management mode where we look to mitigate losses and enhance gains.
If there is a group of stocks that we like for long-term growth, we can establish a separate portfolio outside our option-selling accounts.
Thanks to Jay, Roni and Hoyt for their valuable feedback.
Keep up the good work. You’re off to an impressive start.
Alan