One of the exit strategies for covered call writing that allows us to enhance portfolio returns is known in the BCI community as “hitting a double”. We implement this position management technique when option value meets our 20%/10% guidelines. The initial short call is closed (buy-to-close) as share value declines early to mid-contract and then re-sold if and when share value appreciates as a result of the Delta factor. Generally, the same option is sold for a second time, but we can also frequently benefit financially buy re-selling a lower strike option. What distinguishes this from rolling down is that the latter is usually accomplished simultaneously. Hitting a double involves a delay between the option close and re-open during which share appreciation takes place. In June of 2018, Joanna generously shared with me a series of trades she executed where she hit her first double.
Joanna’s trades with E*TRADE Financial Corp. (NASDAQ: ETFC)
- 5/21/2018: Buy 200 ETFC at $65.05
- 5/21/2018: Sell 2 x June $68.50 call at $0.51
- 5/31/2018: Buy-to-close the $68.50 call at $0.12 (approximating the 20% guideline)
- 6/6/2018: Sell-to-open the June $66.50 call at $0.46
ETFC initial calculations with the Ellman Calculator (initial trade structure)
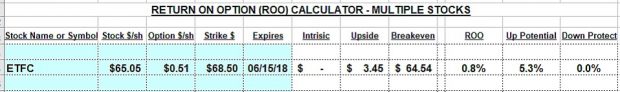
ETFC Initial Time Value Returns and Upside Potential
Joanna’s trade generated an initial 4-week time return of 0.8% with 5.3% upside potential. This was a bullish approach to the trade.
ETFC price chart analysis
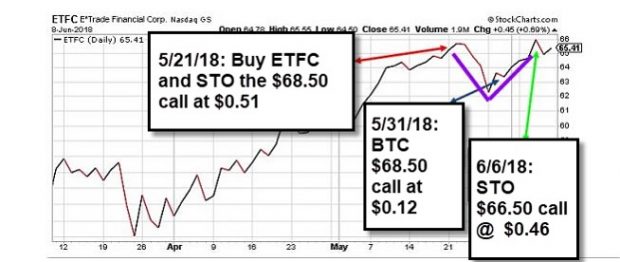
ETFC Price Chart May and June 2018
Points of interest
- Red arrow: Initial trades entered
- Dark green arrow: Short call closed
- Light green arrow: Second option sold
- Purple lines: Classic V-shaped pattern typical of “hitting a double” opportunities
- Share price closed the contract month at $65.41
Current returns/calculations
Stock side of trade: ($65.41 – $65.05) x 200 = +$72.00 (unrealized until shares are sold)
Option side of trade: ($0.51 – $0.12 + $0.46) x 200 = $170.00 (less trading commissions)
Discussion
Position management is the third required skill for option-selling. Using the 20%/10% guidelines along with the “hitting a double” strategy can elevate returns to higher levels. We can hit a double even when using a lower strike for the second option sale.
**********************************************************************************************************************************************
HOLIDAY DISCOUNT CODE
Give the gift of education this holiday season and use this discount promo code to get a 10% discount at checkout on all items in the BCI store:
HOLIDAY10
Click here to enter the store the BCI store
**********************************************************************************************************************************************
Upcoming event
February 7th – 10th, 2019
Orlando Money Show
Omni Orlando Resort @ Champions Gate
February 7th – 10th 2019
Speaking schedule:
1. Getting Started with Stock Options: Creating Monthly Cash Flow with Covered Call Writing
February 8, 2019, 3:10 pm – 3:40 pm
2. Getting Started with Stock Options: How to Select the Best Options in Bull and Bear markets
February 9, 2019, 2:00 pm – 2:45 pm
Market tone
This week’s economic news of importance:
- Chicago Fed national activity index Oct. 0.24 (0.14 last)
- Case-Shiller house prices Sept. 5.5% (5.7% last)
- Consumer confidence index Nov. 135.7 (135.8 expected)
- GDP Q3 3.5% (3.6% expected)
- New home sales Oct. 544,000 (589,000 expected)
- Weekly jobless claims 11/24 234,000 (220,000 expected)
- Personal income Oct. 0.5% (0.4% expected)
- Consumer spending Oct. 0.6% (0.5% expected)
- Pending home sales Oct. -2.6% (0.7% last)
- Chicago PMI Nov. 66.4 (58.4 last)
THE WEEK AHEAD
Mon Dec. 3rd
- Markit manufacturing Nov.
- ISM manufacturing index Nov.
- Construction spending Oct.
Tue Dec. 4th
- Motor vehicle sales Nov.
Wed Dec. 5th
- ADP employment Nov.
- Productivity Q3
- Markit services PMI Nov.
- ISM nonmanufacturing index Nov.
Thu December 6th
- Weekly jobless claims 12/1
- Trade deficit Oct.
- Factory orders Oct.
Fri December 7h
- Nonfarm payrolls Nov.
- Unemployment rate Nov.
- Average hourly earnings Nov.
- Wholesale inventories Oct.
- Consumer credit Oct.
For the week, the S&P 500 moved up 4.85%% for a year-to-date return of 3.24%
Summary
IBD: Market in confirmed uptrend
GMI: 1/6- Bearish signal since market close of November 13th, 2018 as of Friday morning
BCI: Selling an equal number of out-of-the-money and in-the-money strikes. The fundamentals are in place for a market turnaround which may have started this past week.
WHAT THE BROAD MARKET INDICATORS (S&P 500 AND VIX) ARE TELLING US
The 6-month charts point to a neutral tone. In the past six months, the S&P 500 was up 2% while the VIX (18.07) moved up by 17%.
Wishing you much success,
Alan and the BCI team
Premium Members,
This week’s Weekly Stock Screen And Watch List has been uploaded to The Blue Collar Investor Premium Member site and is available for download in the “Reports” section. Look for the report dated 11/30/18.
Also, be sure to check out the latest BCI Training Videos and “Ask Alan” segments. You can view them at The Blue Collar YouTube Channel. For your convenience, the link to the BCI YouTube Channel is:
http://www.youtube.com/user/BlueCollarInvestor
Since we are nearing the end of Earnings Season, be sure to read Alan’s article, “Constructing Your Covered Call Portfolio During Earnings Season”. You can access it at:
https://www.thebluecollarinvestor.com/constructing-your-covered-call-portfolio-during-earnings-season/
Best,
Barry and The BCI Team
barry@thebluecollarinvestor.com
BCI Members,
The NYSE and NASDAQ will be closed this Wednesday, 12/5/18 to honor the late President Bush.
Best,
Barry
Alan,
In this week’s stock report there are many more stocks than the previous several weeks and most are in bold. Does this mean we should use mainly out of the money strikes?
Thanks,
Marsha
Marsha,
Good observation. We have found over the years that our premium stock reports reflect the action in the stock market…the more eligible securities, the stronger the market performance.
Now, stocks in bold in our reports have the strongest technical indicators in addition to passing all fundamental screens so favoring OTM strikes makes sense. The caveat is that we also have to factor in overall market assessment and personal risk tolerance before finalizing these strike price decisions.
Alan
Hey Friends,
Here in the US it is big deal when a former President dies. They plan for it well in advance. I have no doubt similar traditions exist around the world.
I have enjoyed reading the tributes for President Bush. I remember him well and admired him greatly. I happen to be in the other political party but that did not stop me from recognizing him as a first class human being and Great American. May he rest in peace.
We could use more leaders like him today.
Well, I got lucky last month (so far) planning a bullish December expiry. May start buying back and hitting doubles on CSP’s if this keeps up :). I did not write any overhead calls since we were just too low last month and G20 and Fed were coming. – Jay
Alan,
I am new to options and just finished your terrific beginner’s course. I am confused on one point and I hope it is not a dumb question. Since we are selling options that means that someone is buying them. I read that 90% of options expire worthless. Why are so many people buying options that will probably expire worthless and lose all their money?
There must be a simple explanation and appreciate any help understanding.
Lew
Hi Lew,
Alan has done some nice work explaining and debunking that old saw about options and I suspect he will forward a link or two.
I am an active options trader on both the buy and sell side. I can tell you I almost never hold a bought option to expiration. When I buy it I have an appreciation target in mind and am out of it before expiration for better or worse. Perhaps ironically I hold many more sold options to expiration because I have a depreciation target – often down to zero in the case of CSP’s.
I like the old story of “If I was a dollar bill?” How many hands, cash registers and wallets would I go through in my life cycle? Options are like that too. Eventually they all expire, some in the money and some not but they go through a lot of hands and accounts along the way! I may sell it to you at the start of a monthly cycle but who knows how many times it will turn over after that and how many times it had already before I sold it to you in the “first” place :)? – Jay
Well, I obviously typed my note above before today happened :)! Oh well, volatile times….- Jay
Hi Jay,
-5.44% Another night when I can’t sit down. Nothing there. It’s sitting on the hearth on a silver platter.
My fourth worst day of the year. 02/05, 02/08 and 10/10 were worse in that order.
I, too, liked and respected .GHWB. Politically had everything going against him in 1992. People make a big deal out of Perot but Perot didn’t cause him to lose any electoral votes. Bush just lost losing states by bigger margins and won winning states by smaller margins. That was why Clinton won with 43%, Bush 37% and Perot 17%. That’s how I remember it. Anyway Bush was a class act.
Still hoping Santa Claus will come to town this year. With my RMD taken out I will be lucky to end up with “flat for the year” accounts.
I, too, am of the other political party. Made a fortune with Clinton, lost most of it with W, came back better than I expected with Obama and did really good last year.
But I wouldn’t take anything for what I have been through. I can remember all the presidents from Truman to now. Was too young to remember FDR. It’s is, and always has been, the greatest country on earth. As bad as Wall Street can be it’s still the most efficient way to allocate capital that has ever existed.
I love Europe, particularly Germany, my second home, but capital is allocated very differently. It’s very hard to be an entrepreneur there.
Oh well tha’s another story over another drink. I am on my second eggnog and will just have to wait for Thursday.
I would say to Poppy Bush and to you now, “Fair Winds and Following Seas.”
Take care,
Hoyt
Hoyt,
Thanks for the kind and informative reply, as always.
Please do not feel like the lone Ranger, i got my ass handed to me today too!
Since you mentioned FDR, who was a long time personal friend of mine, and after whom term limits were designed how many times since FDR has the 8 year party rotation been broken? Think about that if you are a historian and I will give you the answer at the bottom of this post. No fair reading ahead 🙂
‘Tis the season for the eggnog and hopefully the Santa Rally. I am expecting a big up day Thursday when Trump talks nice about China trade. Buying a BABA call Thursday morning is a way to play that.
i am still bullish December although my CSP on IWM at 148 went ITM today. That’s OK, I would not have sold it in the first place if I did not want some IWM at some point down the road.
OK, I know US history fans are dying to know: FDR was elected US President 4 times. Since term limits were established the parties have tended to rotate on an 8 year cycle. The first exception was when Jimmy Carter lost in 1980 after only one term. The second was when the now late President Bush won in 1988 beating Michael Dukakis in what “should have been” a Democratic year. Four years later the cycle was broken again when Clinton won. It’s been unbroken since.
So regardless of what one’s opinion of Trump is the 8 year party rotation cycle is on his side :). – Jay
Jay,
I concur. The eight year party presidency is a powerful phenomena. I predict a Democratic house and senate in 2020 with the strong possibility of Trump’s reelection. Assuming, of course, that he is not impeached and convicted. It would be a mistake for the Dems to impeach without assurances that the senate would convict.
Anyway, back to our vocation and avocation. I, too, expect a slight recovery on Thursday.
It is obvious, to me at least, that trade is what is making this market schizophrenic. Trade is the life blood of the equity markets, whether domestic or foreign or both. In my opinion the stock market reflects our GDP. Without foreign trade our GDP is smaller, thus lower stock market. Free trade has winners and losers. More winners than losers but losers nonetheless. Cushioning the pain of losers and turning them into, if not winners then certainly not losers should be the priority. Europeans have figured out that part of the equation. They just screwed up the entrepreneur side of the equation. We need to get both sides right.
Take care,
Hoyt
Good morning Hoyt,
We think too much alike which can not be a good thing :)?
Day of mourning the loss and celebrating the life of President Bush. I doubt a finer or kinder human being has ever held the office.
I might quibble with you a little, just a nit, but I think Ross Perot cost Bush that election to Clinton. Fortunately my Dad is still vibrant at 85. He voted for Perot and when I want to needle him when the subject of politics comes up I thank him for electing Bill who he loathes :)!
Yet you are likely correct Perot did not change the Electoral College math but why dull a needle that has served me ever since :)?
I like the market from here and added to a few positions on the dip yesterday. It’s funny, when I question a spending item by my significant other her response is always “It was on sale”. But when I tell her I bought a few things on a market down day she does not seem to get that :)? – Jay
Hi Jay and Hoyt,
I was fully in cash on monday when I entered buy/write trades on ILMN, VEEV and UNH.
They went up and I was staring to believe that the correction was over.
But yesterday, when the market started to go down, I exited both ILMN and UNH with gains before everything crashed. So far so good, but I stil have VEEV at a steep paper loss. Maybe I can exit tonight in aftermarket hours.
Roni
Hey Roni,
If you still believe in the fundamentals of VEEV why would you take a steep paper loss and make it a real one? You should be adding to it unless something has changed in the holding itself independent of daily market tide and news cycle.
My two cents, anyway :)! – Jay
Thanks Jay,
I will wait and see what happens tomorrow.
I guess I’m just plain scared.
Roni
By the way,
I just remembered that I cannot trade options in after hours, therefore I must wait for tomorrao anyway
Roni
Thanks Roni,
I think we have a reasonable chance of an up day tomorrow. Trump does not do press conferences to let the market down.
Since I am comfortable expressing myself in this forum I hope Trump took something away from being at the Bush service today.
The guy has some good ideas and a lot of people like him. But I just think his tone, attacks on anyone who does not adore him and general lack of polish or civility are an embarassment for us up here in the States. Jay
Roni and Jay,
Jay first.
Every time the market goes down my wife says,”Sell, Sell, Sell.”
We have separate accounts, always have as she also worked for the firm and had her own separate retirement account. Her holdings are core, chosen by me, and she doesn’t trade. She wants both of us to go to cash. I tell her I am not but if she will stand by me at the laptop and confirm each sale, I will close out her positions. She never does. She doesn’t keep up with the market on a day by day basis so the next time she sees on the news that the market has gone done “bigly” she says, “See I told you we should have sold.” I tell her the market went up x% and now is down 1/2x% so we are actually ahead. She goes away.:)
Roni. I am with Jay. If the fundamentals haven’t changed I try to like it better at what I think is a temporary lower, “on sale”, price. Long ago trading expenses were much higher and getting in and out of a stock was costly. Now trading costs are insignificant. But the problem, at least for me, is that once I exit an equity position I tend to re-enter it too late or never at all. (I don’t seem to have that problem with options. I often wonder why.)
AMZN is a core holding for me. I don’t overwrite my positions. But I do buy calls from time to time. I held on as it went from $2000 at the end of September to $1502 on 11/23. Ouch that hurt. I still believe AMZN to be a monster. Of all the companies we hear about needing to be broken up AMZN probably fits the bill. Maybe AMZN will grow it’s earnings into a market average p/e over time. I think most people have until very recently overlooked Amazon Web Services(AWS). It is the real driver.
Good luck tomorrow for both of you,
Hoyt
Thanks Hoyt,
AMZN is a growth core stock and i would never try to over write that either. Too volatile and too much headache when the growth happens. I only over write the boring stuff! – Jay
Jay,
Exactly. I buy calls at certain times on AMZN and sell the bought calls. I don’t want anymore AMZN.
BOA and GLW have been core holdings for me since 2009. BOA has not been the stock I anticipated with rates going up. In DRIP programs on both so they have grown over the years. GLW more than BOA because of restrictions on it by the Fed.
Futures just swung almost 400 points from up 140 to down 243..Batten the hatches!
Good Luck,
Hoyt
Hoyt,
Trump could save the day with his press conference. Will depend on whether he plays blow fish or statesman?
Thanks for all the notes today. I guess that is what happens when two market junkies like us have time on their hands :)? – Jay
Thanks Hoyt,
I just entered a sale order for my 2 VEEV calls at 20% of the premium received, and if the market continues to drop, it my be filled soon.
If that happens, I will wait a few days, but will sell the shares if my accrued loss gets to 10%.
Roni
Correction : I entered a buy order, not a sale order.
Sorry – Roni
Lew,
Here is a link to an article I published a few years ago on this topic:
https://www.thebluecollarinvestor.com/percentage-of-options-expiring-worthless-debunking-a-myth/
Alan
Premium members:
This week’s 8-page report of top-performing ETFs and analysis of ALL Select Sector Components has been uploaded to your premium site. The report also lists Top-performing ETFs with Weekly options as well as the implied volatility of all eligible candidates.
New members check out the video user guide located above the recent reports.
For your convenience, here is the link to login to the premium site:
https://www.thebluecollarinvestor.com/member/login.php
NOT A PREMIUM MEMBER? Check out this link:
https://www.thebluecollarinvestor.com/membership.shtml
Alan and the BCI team
Alan,
Does the only reason implementing 20/10% exit rule is the possibility of ‘hitting a double’ or there are other reasons?
Thanks,
Sunny
Hey Sunny,
To me once a sold option depreciates according to plan to less than 20% of what we sold it for all there is left in it is risk compared to the profit we have made.
So it makes sense to buy it back, bank the profit and then decide based on the under lying whether you want to hit a double, exit the position or do something else entirely. – Jay