Stock selection, option selection and position management are the 3 required skills for covered call writing and put-selling. One of our go-to exit strategies is “hitting a double” where we buy back the original option sold if share price declines and then re-sell that same option as share price recovers. Stock prices whipsaw and that is what gives value to our option premiums. Overall market movement plays a major role in our stock and option prices and news events is one of the main factors that impact these changes. In August 2017, Kim Jong-in, the Supreme leader of North Korea launched a series of nuclear missile tests over Japan that spooked the market and most stocks plunged dramatically. The market then re-thought its reaction and immediately reversed its course. Stock prices plummeted and then accelerated. This is the perfect scenario for “hitting a double”

Kim’s Missiles Impacted Stock prices
Real-life example with TAL Education Group (NYSE: TAL)
TAL Education Group was an eligible stock on our Premium Watch List in August 2017. Prior to the start of the September contracts, TAL had undergone a 6-for-1 stock split where the number of stock held was multiplied by “6” and the price-per-share was reduced by a factor of “6” As a result, strike prices were also reduced by a factor of “6” resulting in atypical strikes. The price chart shows how the news of the missile launches caused share price to first decline and then recover:
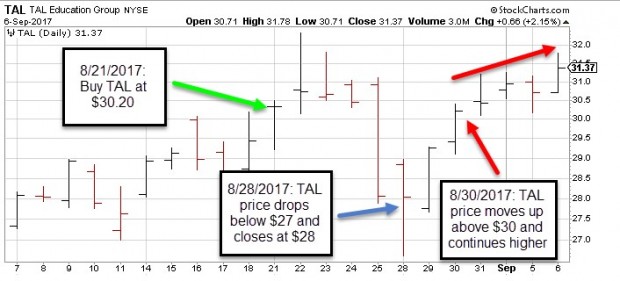
TAL Price Chart August-September 2017
- 8/21/2017: Buy TAL at $30.20 (green arrow)
- 8/28/2017: TAL price closes at $28.00 (blue arrow)
- 8/30/2017: TAL price recovers and moves above $30.00 and then above $31.00 (red arrows)
“Hitting a double” with TAL and Kim
Our knowledge of the option Greeks and Delta in particular is confirmed by the direct relationship between stock price and call premium highlighted in the chart of the $30.83 call strike. Before the 6-for-1 stock split, this strike was a $185.00 strike:
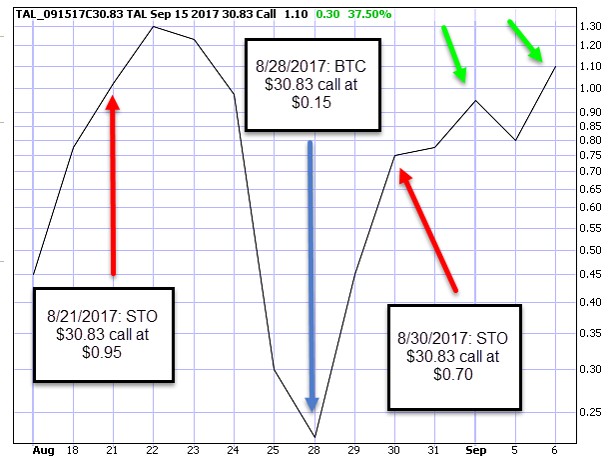
TAL $30.20 Call Option Chart
- 8/21/2017: The $30.83 call option was sold (STO or sell-to-open) at $0.95 (red arrow on left)
- 8/28/2017: The $30.83 call option was bought back (BTC or buy-to-close) at $0.15 meeting our 20% guideline (blue arrow)
- 8/30/2017: The $30.83 call option was re-sold at $0.70 (STO) as share price appreciated (red arrow on right)
- Early September: Share price continued to rise (green arrows)
Discussion
Current events will frequently impact our stock and option prices. Market psychology (fear and greed) can result in overreactions and then a re-thinking of those outlooks. We must be prepared with our position management arsenal to take advantage of these situations to either mitigate losses or enhance gains as was the case with TAL in this article. In this scenario, premium returns were elevated an additional $55.00-per-contract, less small trading commissions ($70.00 – $15.00).
Cramer’s top picks…we had them first
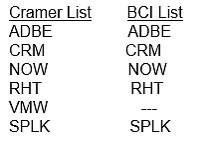
Jim Cramer’s Top Picks and the BCI Premium Stock Report
***We should keep in mind that screens and recommendations are made for various strategies. The BCI screens are specific for short-term option-selling.
Upcoming events
Portfolio Overwriting webinar for The Options Industry Council (OIC)
March 23 @ 10:30 am – 11:30 am
College and graduate school finance majors only
Quinnipiac G.A.M.E. VIII Forum
New York City
Friday March 23, 2018
“The 3-day forum, held annually in the spring, gathers some of the most successful people in finance together to share their knowledge, expertise and outlook for the future with graduate and undergraduate students”.
Market tone
This week’s economic news of importance:
- Consumer price index Feb 0.2% (expected)
- Core CPI Feb 0.2% (expected)
- Retail sales Feb (-)0.1% (under-performed)
- Producer price index Feb 0.2% (0.1% expected)
- Weekly jobless claims through 3/10 226,000 (slightly less than expected)
- Housing starts Feb 1.236 million (slightly less-than-expected)
- Building permits Feb 1.298 million
- Industrial production Feb 1.1% (better than expected)
- Consumer sentiment March 102.0
THE WEEK AHEAD
Mon March 19th
- None scheduled
Tue March 20th
- None scheduled
Wed March 21st
- Existing home sales Feb
- FOMC announcement
Thu March 22nd
- Weekly jobless claims through 3/17
- Markit manufacturing PMI March
- Markit services PMI March
- Leading indicators Feb
Fri March 23rd
- Durable goods orders Feb
- New home sales Feb
For the week, the S&P 500 declined by 1.24% for a year-to-date return of 2.93%
Summary
IBD: Market in confirmed uptrend
GMI: 5/6- Buy signal since market close of February 20, 2018
BCI: Still cautious selling 3 out-of-the-money strikes for every 2 in-the-money strikes.
WHAT THE BROAD MARKET INDICATORS (S&P 500 AND VIX) ARE TELLING US
The 6-month charts point to a neutral outlook. In the past six months, the S&P 500 was up 15% while the VIX (15.80) moved up by 58% but trending down.
Wishing you much success,
Alan and the BCI team
Alan
Suppose we have bought 100 shares of Coca-Cola (KO) at 44$ and i sell one call option out-of-the-money with strike 45 and expiration 1 month (in this case I am the operator who implemet the strategy: the Writer).
During the life of the option, suppose during the third week, the price of the KO goes up to the strike (from 44$ to 47$), so the option is deep-in-the-money and in this case the holder exercise immediately. Is that right?
Thus, in order to avoid this particular scenario, can i repurchase the call
Steven
Steven,
Options are not automatically exercised the moment they move (deep) in-the-money. There are several reasons for this. The main 2 are:
1- Option buyers are usually not interested in taking possession of the stocks but rather want to generate cash profits by selling the options if they are directionally correct regarding the movement of the underlying security.
2. Option premiums generally have a time value component. By exercising, the intrinsic value is captured but time value is lost. In your example, when KO is $47, the $45 strike may have had a premium of $2.50, $2 intrinsic value + $0.50 time value. By exercising, buying the stock at $45 and selling at market at $47 = + $2. The option, on the other hand, could have been sold for $2.50.
Early exercise is extremely rare and, when it occurs, is usually associated with a dividend event.
Yes, options can always be bought back (buy-to-close). An option moving in-the-money is not an automatic reason to do so.
Alan
I have another question. I’d appreciate it if you’d answer my question.
My strategy for CCW is this:
– for the long position: i purchase shares with object to mantain for a long period. These shares should give the dividends because i want to earn them.
– for the short position: i sell monthly call option out-of-the-money. But in this case, according to you, how much difference in terms of % do i have to establish between the price of the title and the strike price (that i choose) to avoid the assignment at the end of the month?
Thanks,
Steven
Steven,
Yes, this is a viable strategy based on your stated objectives. It is important we have a full understanding as to how to manage earnings report dates, ex-dividend dates and how to roll options.
Strike selection: Decide on your return goals of option profits over-and-above current portfolio returns. Let’s say it’s 6% per year. That calculates to 1/2% per month. Check out-of-the-money strikes that generate 1/2% time value initial profit and we have identified the appropriate strike. From there, our position management skills kick in.
Our next book, “Covered Call Writing Alternative Strategies” will include detailed information on this strategy (portfolio overwriting) as well as 2 others. We are also making available a portfolio overwriting calculator…both available in about 1 month.
Alan
If you buy a stock for the purpose of CCW (ie it’s not a long term hold), I am having trouble understanding the rationale for why you would ever roll out. Aren’t you simply exchanging realized profit (premium received) for unrealized profit?
Richard,
If we decide that we want to retain the stock in the next contract month and if the time value credit/debit meets our initial time value return goals, than rolling makes sense.
This is because rolling will guarantee the time value returns in place which may not exist the following week and also will result in 1 less trading commission than will allowing assignment and re-buying the stock the following week.
One more possible reason is related to tax consequences. If the stock is a low cost-basis stock, assignment may result in negative capital gains penalties.
Alan
Expiry weekend report:
Total account value – Up 1.5%
9 positions .
7 positions – assigned (AMAT, EW, GRUB, NFLX, NVDA, NOW, and URI)
1 position – still holding 200 shares of LOW with 8% paper loss after 20/10 rule.
Added 100 shares last week, now holding 300 shares with BEP of $100.60, and planning to sell 3 CCs next week to mitigate loss.
2 positions (WGO and DLTR) sold before ER.
DLTR – 7% loss after subtracting premium and comissions.
WGO – 0% gain/loss.
1 position entered last week to deploy the cash (PYPL) buy write with 04/20 expiry.
Today I am 74% in cash, and waiting for Barry’s list to pick new tickers.
Roni
Hey Roni,
Congrats on out performing SPY by 50% this expiry! My chart shows SPY up 1% and you up 1.5%. Great work!!
Your monthly recaps are helpful for me and I suspect others. It is always interesting to hear how active users of the higher portfolio turnover application of covered call writing do in real time against a benchmark like SPY. I hope your roll continues! – Jay
Jay,
Thanks for your kind words.
My goal is learning to manage part of my economies in a “secure” investment, with consistent gains, above the normal bank meager returns.
Also I want to have fun, and need to sleep well.
Roni
Excellent Roni, wishing you fun doing your replacement shopping and call writing this week!
I am having a decent year well ahead of SPY but just can’t keep up with that damn QQQ :).
I keep score on a YTD basis. I also now take perhaps a contrarian approach to covered call writing: I only overwrite the positions I am either bearish or less bullish on each month. I have about 20 optionable positions. I don’t touch the ones I am most bullish on. I let them run.
But, as always, the risk in these strategies is never in the CC/CSP we sell. It is in the underlying. And there are endless ways to use the strategies…. – Jay
Jay,
20 optionables is very good.
When I look at my past trades since I started selling CCs, it is obvious that I left a lot of money on the table because of the bull market we had in that period.
But I do not regret the lost opportunities.
You see, when I own a stock and it drops significamtly, I can’t sleep at night and worry.
And if it goes up I get exited and can’t sleep either.
So, the BCI methodology is fundamental for my health.
Roni
Roni,
I understand!
In this journey of becoming “CEO of Our Own Money” – I did not think one up 🙂 – the importance of finding an approach that fits your temperament and personality can not be over stated. From all of our chats here I know you have found what works for you. I wish that for all of of our friends here.
Tough market day today. But great to buy some good stocks “on sale” and sell some good OTM puts on a volatility and put premium up tick today for the new expiry. I would not have wanted to be a covered call seller today with call premiums down and stocks now likely to bounce. Most of the time it does not matter much on a post expiry Monday if you buy/write same ticket since you capture max theta decay potential.
It has just been my experience that if we get handed a nice buying opportunity after expiry like today grab it! But wait for the bounce back tomorrow or Wednesday to cover it. Or cover half and wait in case the bounce takes a while.
In any case the stock is what matters and those shopping to fill open cash for April got a break today! – Jay
Jay,
great tip.
I will do it in the after hours.
I was taking it slow because this is a 5 week cycle, but your post has me wide awake now.
Roni
Jay,
good news.
Following your tip, I bought ADBE and ANET in the after hours on March 19 at a reduced price, and, sold the April 20 calls yesterday at noon when both were up aprox. 4%.
I also tried to do the same with GRUB, but did not get a fill.
Roni 🙂
OOPS. think I placed my reply in the wrong spot, Roni, please see lower in the thread! – Jay
Good job Roni!
Does anyone else trade in the after hours?
Best;
Terry
Terry,
thanks. I rarely trade in the after hours, but when I read Jay’s post, the market was closed and I wanted to grab the opportunity.
Roni
I was reviewing Ask Alan #142 – “Evaluating The Cost-To-Close Prior To Contract Expiration” and am confused about one of the calculations. With the UCTT example in the Time Value Lost to Close section, the Time Value of option remaining was -$88.00. Than part makes sense to me. The Percentage lost to time value was calculated as -2.93%. This seems to be the remaining time value divided by the strike, -$88.00/($30.00*100). Why would I use the strike price of the closed option position as the basis? Why not the original stock investment of $2,790 or even the bought up stock basis of $3,162?
Premium Members,
This week’s Weekly Stock Screen And Watch List has been uploaded to The Blue Collar Investor premium member site and is available for download in the “Reports” section. Look for the report dated 03/16/18.
Also, be sure to check out the latest BCI Training Videos and “Ask Alan” segments. You can view them at The Blue Collar YouTube Channel. For your convenience, the link to the BCI YouTube Channel is:
http://www.youtube.com/user/BlueCollarInvestor
Best,
Barry and The Blue Collar Investor Team
barry@thebluecollarinvestor.com
Alan,
I was reviewing Ask Alan #142 – “Evaluating The Cost-To-Close Prior To Contract Expiration” and am confused about one of the calculations. With the UCTT example in the Time Value Lost to Close section, the Time Value of option remaining was -$88.00. Than part makes sense to me. The Percentage lost to time value was calculated as -2.93%. This seems to be the remaining time value divided by the strike, -$88.00/($30.00*100). Why would I use the strike price of the closed option position as the basis? Why not the original stock investment of $2,790 or even the bought up stock basis of $3,162?
James
James,
We use the strike as our cost-basis because that is what our shares are worth at that point in time. The “bought-up” stock value is factored in by deducting the intrinsic value of the premium from the total premium to get to the time value cost-to-close. In this case, the time value cost-to-close is 2.93% at a time when our shares are worth $30.00. Using a previous value of the underlying, be it $27.90 or $10.00 (had that been our original purchase price at some time in the past) is not as useful as using current practical value.
These calculations are intended to assist in making the best possible investment decisions at that point in time and not for tax reasons or measuring long-term portfolio results.
Alan
Hi Alan,
Why do you promote doing one month calls? For tax reasons? If you explained this in one of your videos could you refer me to it? Ive been doing one weekly options. Why? Im thinking in lines of defense..No long term commitment. Maybe why Im still single. 🙂
Speaking of taxes, can you recommend or refer to the tax implications of short term option trading? I was told (and understand) I will get nailed on my income at year’s end. And if I trade frequently on the same stock during my short term exposure I may not be able to deduct losses. Do you set up an escrow account to fund for taxes? Maybe this isn’t the forum to ask these questions, but I am concerned about it nonetheless.
Thanks
PS I bought two of your books! Paul
Paul,
I believe that impressive returns can be generated with both Weeklys and Monthlys although I favor the latter.
Weeklys are especially useful in circumnavigating around earnings report and ex-dividend dates and may also result in higher annualized returns…maybe.
Disadvantages of Weeklys include:
Smaller pool of stocks with Weeklys which may impact quality of underlying selection
Lower option liquidity (generally) resulting in wider bid-ask spreads and less favorable trading execution prices
More frequent decisions regarding rolling the option
Less time for position management
Quadruple or 5x the number and amount of trading commissions
Let me re-emphasize that we can be successful with both Weeklys and Monthlys once we’ve mastered the 3 required skills.
Alan
Your tax question:
Option-selling results in short-term capital gains (losses) and that is why trading in sheltered accounts is preferable when possible. Since I am not a tax expert, I would refer other tax-related questions to your tax advisor…Alan
ISRG looks like it might be reporting earnings early (BCI has 4/26):
http://phx.corporate-ir.net/phoenix.zhtml?c=122359&p=irol-irhome
Webcast Image Webcast
Q1 2018 Intuitive Surgical Earnings Conference Call (Live)
04/17/18 at 1:30 p.m. PT
ISRG ER Date Update…
The originally reported ER date for ISRG (from EarningsWhispers.com) is incorrect. The actual date is 4/17/18, not 4/26/18. This was checked against the CBOE Earnings Calendar, Schwab website, and the company website.
Thank you JLDTEX for the heads up.
Best,
Barry
Hi Alan,
Thanks for what you do.
I have been using BCI for about 2 years or so and have a couple of questions. I apologize if these have been answered before in the blogs- I couldn’t find them.
When using the “what now” page for stocks that you have previously rolled up, should the “stock share price you paid” be the original purchase price of the stock plus the costs you have paid to roll up or just the original cost?
It seems to me that the cost of your stock should include what you have paid before to roll up.
The other question I have is when a contract expires and your stock price has dropped well below what you paid, should you sell the stock and lock in a loss, or hold it it till it bounces back?
My current approach is to hold it till it rebounds if it is still in the running list, but maybe that is the wrong approach. I never roll down.
Thank you.
Earl
Earl,
After having rolled out-and-up, our new cost basis is the current market value of the stock or the strike for the new contract month, whichever is lower. The cost-to-roll has been calculated in already in the “rolling “calculations”. If we originally had a stock at $48 and sold the $50 call and near expiration the price was $53, and now we roll out-and-up to The $52 strike, our cost basis is $52. Had we rolled out-and-up to the $55 strike, our cost basis is $53. Note that we can roll out-and-up to an in-the-money, at-the-money or out-of-the-money strike. When we roll out only (and not up) we are always rolling out to an in-the-money strike.
When a stock price drops and it is still on our watch list, a strike is selected based on our system guidelines: overall market assessment, chart technicals and personal risk tolerance, not on previous trades we made.
If the stock is not on our watch list, we may keep the stock as long as it is not significantly under-performing the overall market but I will usually exchange it for a stronger candidate. The previous price of a stock plays no role in my current investment decisions. It’s the cash in the security that matters, not the security itself.
Alan
Alan:
Wouldn’t it be more accurate to use a weighted average for ROO and upside percentages instead of straight averages?
I found this evaluation very interesting and useful. I went back and used it to evaluate my February selections. I had a mix of new picks (2) and three other positions that were unassigned calls. I sold new calls for these. Should I just evaluate my new picks or combine the new and old for an overall evaluation. Generally speaking the unassigned picks sell for a lower premium.
Peter
Peter,
This is an interesting approach to our portfolio construction guidelines. Let me offer another perspective, making the case for evaluating each trade on its own merits rather than as a part of an overall evaluation:
We know that our initial time value returns (ROO) is directly related to the implied volatility (IV) of the underlying security. IV is a measure of risk.This allows us to avoid underlyings that are too risky for this conservative strategy. For me, I look for ROOs between 2-4% per month and up to 6% in bull markets.
Two stocks that show ROOs of 4% each total 8% in ROO value averaging to my maximum goal of 4%. Now, if we had ROOs of 1% and 7%, that would also average to 4%. In the latter hypothetical, we would have 1 security with a risk-tolerance above our comfort level (7%) and another that would provide initial returns below our stated goals (1%). In essence, we are trading in 2 appropriate trades for 2 that do not meet are system guidelines.
Alan
Premium members:
This week’s 8-page report of top-performing ETFs and analysis of ALL Select Sector Components has been uploaded to your premium site. The report also lists Top-performing ETFs with Weekly options as well as the implied volatility of all eligible candidates.
New members check out the video user guide located above the recent reports.
For your convenience, here is the link to login to the premium site:
https://www.thebluecollarinvestor.com/member/login.php
NOT A PREMIUM MEMBER? Check out this link:
https://www.thebluecollarinvestor.com/membership.shtml
Alan and the BCI team
Hey Roni,
Thanks for the follow up. Great stuff on your two new stocks! It just seems to me that in volatile times like this it makes sense to split the tickets. Buy stuff on the down days and cover it on the inevitable bounce back! Hope both trades work for you! – Jay
ABBV price in free fall. Cancer drug delayed.
Hey all,
History buffs are familiar with Thomas Paine’s quote “These are the times that try men’s souls”.
The market feels like that now. It’s funny, I sold covered calls on everything in my IRA portfolio I would not mind getting rid of as a “Spring cleaning” exercise for April. As of this writing it looks like I will keep all of them and have to try again for May :)?
This pull back was easy to see coming. Rate hikes and tariffs were well telegraphed. It still stinks when it happens if you own long stock. Add FB and other problems and it is a hard time to be excited about stocks. But a good time to pick up quality tickers caught in the tide and hold them for a better day. – Jay
Jay,
Welcome your comments all the time as well as others. I see we have a lot of new participants in the blog in the last 2 months. Great to see that.
I still enjoy reading books on Options using the Broward County Library system here in Tamarac, FL. Barry told me last year he had an impressive library of books. I have had my share of books on many subjects throughout my career just to keep alive, stay up to date, to reach today’s stage of retirement. I check out books i need now when possible..
I still am reading Options as a Strategic Investment by Lawrence G. McMillan 5th Edition. Spindr recommended the book to us about a year ago. It’s 1048 pages long and I check it out through the Inter-library Loan system for 2 months at a time. Copies have come from Nashville, Georgia, and now Easttown, PA. Great book and it is a classic. Ties a lot of information together.
One other book I am reading is “Options DeMystified – Hard Stuff made easy” by Thomas McCafferty, 2nd edition. It’s a different style of book in the sense that it has few graphs at all and in words deals with the world of trading, regulatory and brokerage systems, options, strategies, advanced concepts, futures, etc. Each chapter also has a short quiz as well. Has been worthwhile reading.
Mario
.
Thanks Mario, great book ideas! I have gotten a little spoiled by the You Tube world we live in and I watch a lot of videos about option trading but should read more!
Another red ink day as of this writing. I made my over written SPY and QQQ into collars with bought puts at the up market open this morning.
Have a nice weekend!- Jay