Meaningful option calculations are essential in determining if the premiums meet our covered call writing goals. To this end, we must understand the mathematics of these calculations to become elite option-sellers. Now don’t worry…we don’t have to become Albert Einstein to be successful. But we do have to have a general understanding of the components of the option premium and how they influence our investment decisions.
Let’s start with the basic equation that many of you have seen in my books and DVDs:
Option premium = intrinsic value + time value
Intrinsic value applies only to in-the-money call strikes and is the amount the strike price is below the current market value. As an example, if we bought Company BCI for $32.00 and sold the $30.00 call for $3.00, of that $3.00, $2.00 is intrinsic value (NOT profit) and $1.00 is time value (our true initial profit). Now, at-the-money and out-of-the-money strikes have premiums associated with them that are all time value since the strike price is not in-the-money. Examples:
- At-the-money: Buy BCI for $30.00 and sell the $30.00 call
- Out-of-the-money: Buy BCI for $28.00 and sell the $30.00 call
In this article, I will discuss and show hypothetical and real-life examples of how intrinsic value protects time value when selling in-the-money strikes.
Hypothetical example
- Buy BCI @ $32.00
- Sell $30.00 call at $3.00
- Intrinsic value = $2.00
- Time value = $1.00
- Initial profit = $1.00/ ($32.00 – $2.00) = 3.3%
Since we only count $1.00 of the $3.00 premium as initial profit and we did, in fact, receive a total of $3.00, what happened to the other $2.00? We use it to “buy down” our cost basis from $32.00 to $30.00. This means we are guaranteed our 3.3%, 1-month return as long as share depreciation does not drop from $32.00 to below $30.00. I call this downside protection which is quite different from breakeven. It is protection of the initial profit. It is calculated as follows:
Downside protection = $2.00/$32.00 = 6.3%
I view the downside protection as an insurance policy which is paid for by the option buyer. When evaluating this trade, the calculations tell us the following:
We are guaranteed a 3.3%, 1-month return as long as share value does not decline by more than 6.3% by expiration. If that trade meets your goals then it’s time to make some money.
Breakeven
As an aside, to calculate breakeven we deduct the entire option premium from the initial cost:
$32.00 – $3.00 = $29.00
Real-life example: Atlassian Corp. Pic (NASDAQ: TEAM)
At the time I am writing this article, TEAM is a stock on our Premium Watch List and the options chain shows the following stats with 3-weeks remaining until expiration:
- Price = $84.48
- $80.00 strike = $7.65
- Therefore, time value = $3.17 and intrinsic value = $4.48
Let’s allow the “multiple tab” of the Ellman Calculator to do the work for us:
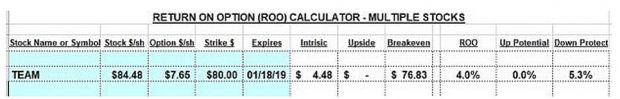
Team,: Option Calculations
Intrinsic value protects time value
The calculator shows that we are guaranteed a 4.0%, 3-week returns as long as share value does not decline by more than 5.3% by expiration. One of the many perks of being a covered call writer is that this “insurance policy” is paid for by the option buyer, not by us.
Discussion
When using in-the-money strikes, the intrinsic value protects the time value or our initial profit. These strikes are most appropriate in bearish or volatile markets, when chart technicals are mixed and when the investor’s risk-tolerance is extremely conservative.
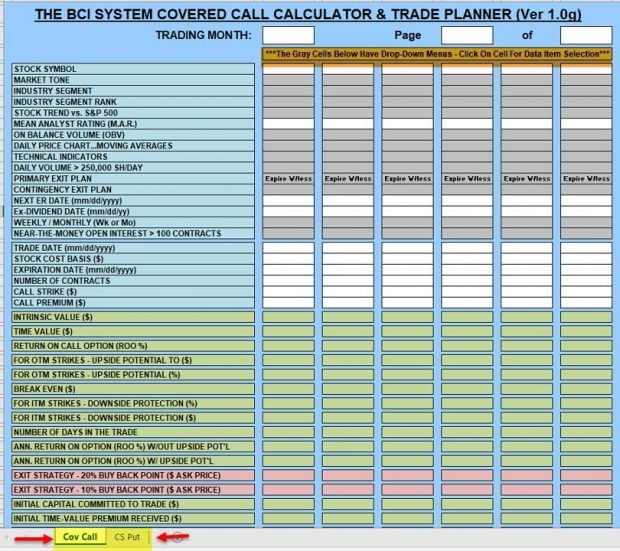
BCI Trade Planner: New tool coming soon
Purpose and Benefits of the BCI Trade Planner
The new Blue Collar Investor Trade Planner is one of the most exciting tools we’ve ever developed. We are introducing this tool to our user community, for both new and experienced traders. By using this tool, we will be in a better position to fully understand and plan our trade(s) for both covered calls and cash secured puts. With the BCI Trade Planner, we can define our primary goal for the trade (“Primary Exit Plan”) and have a defined upfront exit plan if our trade doesn’t go according to the initial plan (“Contingency Exit Plan”). The calculations section gives us a complete picture of our returns for the trade, including:
- Intrinsic Value
- Time Value
- Break Even
- ROO, Upside Potential (in $ and percent), Downside Protection (in $ and percent)
- Annualized Return, including with upside potential
- Exit Strategy option “Buy Back” points
This tool gives us:
- The capability to completely understand and document the trade details that went into our stock selection and trading decisions.
- The capability to better define our trade goals.
- The capability to document the final outcome of the trade.
- A clear picture of the total amount of money committed to the trade as well as the total amount of premium initially received for the trade.
By using of the BCI Trade Planner, we can get a better picture of the end-to-end details of the trade…from initial analysis to final outcomes. We will have the opportunity to review our trades, better understand the trade outcomes, and add discipline to our trading process.
BCI Trade Planner
Your generous testimonials
Over the years, the BCI community has been incredibly gracious by sending our BCI team email testimonials sharing stories as to what our educational content has meant to their families. Moving forward, we have decided to share some of these testimonials in our blog articles. We will never use a last name unless given permission:
Alan,
Four years ago, we went to Spain. I bought every book I could find on writing puts and covered calls. The first few I read were okay but I felt something was missing. I then started reading your books and not only did I learn a lot but I was hooked. I am very satisfied with my overall results having made money every year and have improved and learned more every day. You have taught me how to fish.
Thanks,
Horatio
Upcoming event
July 22: Chicago Traders Expo
1:30 – 2:15
Hyatt Regency McCormick Place
***********************************************************************************************************************
Market tone data is now located on page 1 of our premium member stock reports.
***********************************************************************************************************************
Alan,
I am trying to understand how to handle mid contract positions. On 6/10 I bought TNET for 66.05 and sold the 65 call for 2.94 (exp. 7/19). Yesterday it was trading for 67.62 and I was trying to decide if I should roll out and up and make about 6.15% or let the contract expire for 2.6% profit? I am leaning to rolling out and up but not sure of the timing or when to do this.
Thank you for any help you can provide.
Kurt
Kurt,
I commend you for analyzing your trade mid-contract to see if you can generate more than a maximum return with the cash investment.
Another choice would be to take no action at this time. We are a mile away from the 7/19 contract expiration. The way the trade was initially structured, a 2.9% 5-week return would be realized as long as share value does not decline below $65.00 (see screenshot below showing the multiple tab of the Ellman Calculator). Well done.
Now, rolling out-and-up to the August $70.00 call would result in an additional 2% time-value profit with significant upside but also extend our obligation another month. Most significantly, is the fact the there is a 7/29 earnings report on the horizon and that eliminates writing the August call until the report passes..
Our choice is to allow assignment if the strike is still in-the-money at July contract expiration or keep the stock (buy back the option if necessary) and write the call after the report passes. In my accounts, I usually allow assignment with rare exceptions.
Whatever you decide, continue to monitor… that’s what sets us aside from other covered call writers.
You currently have a successful trade in place. Keep up the good work.
CLICK ON IMAGE TO ENLARGE & USE THE BACK ARROW TO RETURN TO BLOG.
Alan
Alan,
Thank you for answering my question and taking time out of your busy schedule to help me as I’m learning the BCI methodology. I really appreciate it!
Kurt
Alan,
What do you think of the Covered Combination strategy? With it you sell covered calls and cash-secured puts.
Tom
Tom,
Here is a link to an article I published on this topic a few years ago:
https://www.thebluecollarinvestor.com/covered-combinations-merging-covered-call-writing-and-put-selling-into-one-strategy/
Alan
Premium Members,
This week’s Weekly Stock Screen And Watch List has been uploaded to The Blue Collar Investor premium member site and is available for download in the “Reports” section. Look for the report dated 06/28/19.
Also, be sure to check out the latest BCI Training Videos and “Ask Alan” segments. You can view them at The Blue Collar YouTube Channel. For your convenience, the link to the BCI YouTube Channel is:
http://www.youtube.com/user/BlueCollarInvestor
Best,
Barry and The Blue Collar Investor Team
Hi Alan,
I very much like your service. I do have one question, how are the symbols in the running list sorted?
Thank you,
Gary
Gary,
The symbols are sorted by earnings report dates. The black lines delineate contract months. For example, the broken black line above CPRT delineates the August and September contracts.
Glad your pleased with our service.
Alan
Alan,
Almost halfway reading the Covered Call classic book. Let me say that it has explained much more than I expected about trading options in general.
For $50k, you suggest 5 stock positions.
For $100k, you suggest maybe 5-10 stock positions.
For portfolio of $250k, $500k and $1M, how many stock positions do you recommend for these? I know it could be different for each investor based on time and risk.
At what point do you suggest reinvesting trading funds to go into other investment types such as real estate?
I’m trying to understand Unwind strategy where the stock price shoots up in value by mid month. Why not just wait and let the call option get exercised by end of month instead of buying back to close with higher cost? Looking for another stock and sell covered call position is just extra work for remainder of month, I feel. Maybe one of your videos can help me understand better.
Thanks,
Alan
Alan,
My responses:
1. For portfolios between $250k – $1 million or higher, 15 – 25 positions is reasonable depending on the comfort level of the investor for managing positions. As account value increases, the amount of cash allocated per positions will increase.
2. Other asset classes for our overall portfolio should be considered on day 1. This site focuses in on the stock market but real estate, bonds and cash equivalents should be part of our overall plan (in my humble opinion). In my portfolio, stock and real estate dominate and in the stock portion of my portfolio, option-selling represents more than 90% of that asset class because that is where I’ve had my greatest success… by far.
3. The reason we should consider the MCU exit strategy is that it will elevate our overall returns when these opportunities present themselves. It’s like “doubling down” when playing blackjack. As far as the time it takes, when we have an up-to-date watch list (which all premium members have), the time to close and enter a new position should take minutes… a we will be well-paid for those few minutes, perhaps an additional 1 – 2% for our monthly returns on that position. MCU is a valuable exit strategy tool in our covered call writing arsenal.
Alan
Alan,
My son’s name is also Alan :-).
My stock market portfolio is in the low end of your question’s range, and I have my hands full managing 9 or 10 positions, all invested exclusively in monthly CC trading.
On the other hand, my time available to dedicate to trading is quite limited, and I believe in Alan’s evaluation of handling 15 -25 positions, if I had more time and more cash to invest.
Rpni
Hi Alan
Thank you for another very informative article. I am really benefiting from your service.
On ITM covered calls, however, a thought has occurred to me. Since there is no upside potential, wouldn’t an alternative/better strategy be to sell OTM cash-secured puts?
I’ve run the numbers on Atlassian (but they are very different, as the stock price is now at 130+). At the money, the returns are similar, but as we reduce the strike price, the short put provides a better return, with the same downside protection.
For instance, at a strike price of 120, the CC returns 0.5%, and the put returns 0.96%, for a 3 week contract. Would we expect this normally to be the case, since put premiums are higher than call premiums, generally?
In addition, with a short put there is only 1 position to manage.
Any comments on this alternative approach, when bearish?
Thanks
Tony
Tony,
I do like selling deep out-of-the-money puts in bear markets. These may lead to exercise and then selling in-the-money calls (PCP strategy). With the average stock market year up 8% – 10%, more often I prefer covered call writing where I have the opportunity to take advantage of out-of-the-money calls for share appreciation in addition to option premium.
TEAM closed today at $131.77. The July 19 $130 ITM call had a bid of $5.00 (time value of $3.23). The OTM $130 put had a bid of $3.40. Put premiums got a bit richer after the debacle of 2008 which scared the heck out of many investors.
Both are great strategies. I would base my decision on the strategy advantages and disadvantages rather than the small discrepancy in premium.
Alan
Hi Allen,
I was looking at PWR
covered call for July 10 for $40:00
I was entering a buy write call.
Fidelity show me a maximum loss of $890:00
I call Fidelity they say if you are bullish and stock is going up in price you will be immediately be assigned call.
If you want to collect premium sell put option and collect premium.
What’s your strategy in this situation.
Umesh
Umesh,
Maximum loss is the price we paid for the stock less the call premium. It assumes the investor watches the stock price move from purchase price to zero so it is irrelevant to those of us who have mastered the position management skill.
Early assignment is extremely rare. If the strike is in-the-money at expiration, assignment (shares removed from our account and cash added)will occur the Saturday after expiration Friday. When early assignment does occur, it is usually related to a dividend distribution (ex-date). Even with dividends, early assignment is rare.
Selling cash-secured puts is also a great cash-generating strategy especially in bearish market environments. I prefer covered call writing in normal to bull markets so we can also generate income from share appreciation when we sell out-of-the-money calls. Put-selling profits are from premium only. See pages 20 -21 of my book, “Selling Cash Secured Puts”, for a complete list of the pros and cons of put-selling.
Alan
Hi Alan,
Thank you so much for answering my questions. Your previous answers iare very reassuring that I am understanding the BCI methodology correctly.
Now, one thing you said was I should use “only out-of-the-money strikes”. for portfolio overwriting I figure I should be using “deep out-of-the-money strikes? If we continue using my earlier example, had I sold the $61 strike (while XLE was trading at $59.32 and I tried to hit-a-double), I could easily be assigned at $61 and lose out on the recovery to $63. Would that make the overall trade a losing trade?
Unfortunately, I do have a few July options in this category which I need to unwind in the next 3 weeks.
Thanks again for all you do.
Van
Van,
A trade that generates initial time-value premium + exit strategy (“hitting a double”) premium and share price is rising is a winning trade… big time.
Now, as far as strike selection when portfolio overwriting, we use our initial time-value goal and select an out-of-the-money strike that meets that goal.
If strikes are in-the-money as expiration approaches and retaining the shares is critical, rolling the option is an available position management tool.
Alan
Alan,
I would like to piggy back a question from Alan’s question. If you were Alan and Alan had 300K to begin his covered call strategy, how would you proceed? Would you open up the latest BCI weekly stock screen and pick stocks from the list and sell covered calls against them? Based off the 15 to 25 positions you mention, would you pick the stocks that were in bold and divvy up the list, being mindful of the sorted ER dates? If you decided to take the lower amount (15) I know you would want to leave money in cash but let’s say you had another 100K sitting in cash. Now you would allocate 20k per 15 stocks? What and how would you proceed from the BCI stock screen? Since I’ve watched a lot of your videos and read a lot of your material, you would want to make 1 to 4% or higher per month return…correct?
Rob,
There is no one right answer to your questions but I’ll give it a shot:
For experienced investors with a portfolio of $300k to $500k, a decision of how many positions can comfortably be managed… 15 – 25 is reasonable. Experienced investors will know their comfort level. Selections can be made from the stock, blue chip or ETF reports depending on personal risk-tolerance. When using the stock report, starting with the stocks in bold is reasonable but all stocks in the white cells with adequate open interest are eligible. Many of our members also focus in on stocks in industries ranked A or B. Once the stocks/ETFs are selected, we divide that number of positions into the cash available and that is how much cash will be allocated per position. The price-per-share is divided into the allocated amount (getting a headache yet?) and rounded off to the nearest 100 and that is how many shares should be purchased.
For new investors with similar amount of available cash, a smaller portfolio should be considered initially… perhaps $50k with 5 positions. The balance of the cash can be left in cash equivalents (Treasuries, CDs etc.) or in broad market, low expense-ratio index funds (Vanguard, Schwab, Fidelity) if stock market exposure is preferred. As experience and confidence builds, portfolio size is increased until a comfort level is established.
Alan
Rob,
I am copying my yesterday’s comment above to Alan & Alan, because my range is very close to your 300K question:
“My stock market portfolio is in the low end of your question’s range, and I have my hands full managing 9 or 10 positions, all invested exclusively in monthly CC trading.
On the other hand, my time available to dedicate to trading is quite limited, and I believe in Alan’s evaluation of handling 15 -25 positions, if I had more time and more cash to invest.”
I wish to add that I try to stay close to 30K per position, but I hope to increase this ammount gradually, if the market stays bullish, and when my skills and confidence increase.
Also, I would like to say that most of my positions are selected each month from Barry’s latest BOLD tickers on the stock screen.
Roni
Roni,
You bring out an excellent point… the # of positions per portfolio will vary from investor-to-investor based on portfolio size and comfort level in the number of positions that can be taken care of. For me, 15 – 25 positions/ 50 – 100 contracts per month has been manageable for over 10 years (I started much smaller), including times when I was also running a full-time dental practice. Many of members handle less and many manage more… there is no right or wrong.
Alan
Alan,
thanks for your kind and helpful comment.
Roni – 🙂
Alan,
I subscribed Alan to your premium service.
June 24th:
S-T-O CVS at 52.50 & GM at 37.00
After I did this then I thought hey I want to keep these stocks and have lost money on both and I would have been better buying new and selling calls.
I received total for CVS 1.66 for the 52.50 Call, it’s now 2.82 to B-T-C.
I received total for GM .96 for the 37.00 Call, it’s now 2.01
In a few words is there anything on the premium members site that can help me keep my stocks with the lowest loss possible?
I should have bought new and sold the calls.
I have more money I could purchase more shares of either if need be.
In the future I will buy new and sell the calls not use stocks I want to keep that I’ve also lost money on but believe in for the long run.
Thanks,
Jack
Jack,
When we use covered call writing on stocks we want to retain for the long-term, the strategy is known as ‘portfolio overwriting” This strategy is addressed in our latest book, “Covered Call Writing Alternative Strategies” We also developed a calculator specific to this strategy. We focus in on deep out-of-the-money strikes that meet our initial time-value return goals.
Premium members can also access a Blue Hour webinar on portfolio overwriting located on the left side of the member site (see the screenshot below).
For more information on the book and calculator:
https://thebluecollarinvestor.com/minimembership/covered-call-writing-alernative-strategies/
https://thebluecollarinvestor.com/minimembership/portfolio-overwriting-calculator/
CLICK ON IMAGE TO ENLARGE & USE THE BACK ARROW TO RETURN TO BLOG.
Alan
Hi Alan,
Can you give us an idea when the BCI Trade Planner may be available.
Looking forward to using this new tool.
Regards,
Ned
Ned,
My expectation (aka… hope) is sometime this month. We are finished with the actual tool and nearly finished with the user guide. Then the planner must be uploaded to the site… just about there.
Alan
Premium members:
This week’s 8-page report of top-performing ETFs and analysis of ALL Select Sector Components has been uploaded to your premium site. The report also lists Top-performing ETFs with Weekly options as well as the implied volatility of all eligible candidates.
New members check out the video user guide located above the recent reports.
For your convenience, here is the link to login to the premium site:
https://www.thebluecollarinvestor.com/member/login.php
NOT A PREMIUM MEMBER? Check out this link:
https://www.thebluecollarinvestor.com/membership.shtml
Alan and the BCI team