The screening process for option-selling watchlists include fundamental analysis, technical analysis and common-sense screens. The BCI team is now adding a new screen the mean analyst rating (MAR) to replace the Scouter Rating we have been using for years. This will add an “institutional” component to our analysis.
What is MAR?
An investment analyst is a financial professional with expertise in evaluating financial and investment information, typically for the purpose of making buy, sell and hold recommendations for securities. In order to reach an opinion and communicate the value and risk of a covered security, analysts research financial statements, listen in on conference-calls and talk to managers and the customers of a company, in an attempt to determine findings for a research report. Ultimately, the analyst decides whether the stock is a “buy,” sell,” or hold.”
The Scale of Ratings
The analyst ratings scale is more involved than the traditional classifications of “buy, hold and sell.” There are now various categories that include multiple terms for each of the ratings (“sell” is also known as “strong sell,” “buy” can be labeled as “strong buy”), as well as a couple of new terms: underperform and outperform.
Stock recommendation Range

MAR Terms
Additionally, not every firm adheres to the same ratings terminology: an “outperform” for one firm may be a “buy” for another and a “sell” for one may be a “market perform” for another. Thus, when using ratings, it is advisable to use a consensus figure like mean analyst rating
The basics
Let’s review the traditional ratings of “sell,” “underperform,” “hold,” “outperform” and “buy”.
- Buy: Also known as strong buy and “on the recommended list.” This is a recommendation to purchase a specific security.
- Sell: Also known as strong sell, it’s a recommendation to sell a security
- Hold: A hold recommendation is expected to perform at the same pace as comparable companies or in-line with the market moving forward.
- Underperform: A recommendation that means a stock is expected to do slightly worse than the overall stock market return. Underperform can also be expressed as “moderate sell,” “weak hold” and “underweight.”
- Outperform: Also known as “moderate buy,” “accumulate” and “overweight.” Outperform is an analyst recommendation meaning a stock is expected to do slightly better than the market return.
It is best to view these recommendations as a consensus stat with at least 3 analyst reviews. These consensus stats should then be used in conjunction with other fundamental, technical and common-sense parameters when making our investment decisions.
Sample free site with MAR stats: finviz.com
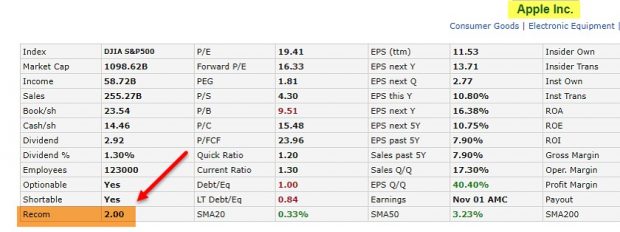
Locating MAR from Finviz.com
Location of MAR stats in our Premium Stock reports

MAR Stats in Premium Stock report
The BCI team will eliminate all stocks with MAR Ratings higher than “3” For those securities remaining, we will publish the precise stats to assist our members in making the best investment decisions possible.
Discussion
Analysts’ recommendations are the culmination of analyzing equity research reports and should be used in conjunction thorough investment methodologies in order to make investment decisions. Additionally, “buy, hold and sell” recommendation meanings are not as cut-and-dry as they first appear; a series of terms and differences in meanings exist behind the basic terminology.
Florida State College at Jacksonville
BCI welcomes students and faculty of this fine learning institution which now includes my book, Stock Investing for Students, in its finance curriculum.
April 5th stock report
Will be published late Sunday to early Monday as Barry recovers from his new bionic knee… can’t keep a good man down!
Upcoming events
-March 29th
Quinnipiac GAME Forum
International forum for college and graduate school finance majors
-May 8th
Alan will be hosting a free webinar for the Options Industry Council (OIC) on generating income from selling options. Click here to register for free.
-May 13th
All Stars of Options
Bally’s Hotel, Las Vegas
10 AM – 10:45 AM
How to Select the Best Options in Bull and Bear Markets
Free event
-May 14th
Las Vegas Money Show
Bally’s/ Paris Hotel
12:15 – 3:15
Master class encompassing covered call writing, put-selling and the stock repair strategy
This is a paid event hosted by The Money Show
Your generous testimonials
Over the years, the BCI community has been incredibly gracious by sending our BCI team email testimonials sharing stories as to what our educational content has meant to their families. Moving forward, we have decided to share some of these testimonials in our blog articles. We will never use a last name unless given permission:
Alan,
I’m only now getting involved with options…mostly because I saw you speak at the P.O.B. Public Library a while ago. I’m also currently reading your book “Complete Encyclopedia for Covered Call Writing”…which I find very well written…Clear and concise with just the right amount of humor.
Ed B.
Market tone (***starting in April, market tone information will be located on page 1 of premium member stock reports)
This week’s economic news of importance:
- Home builders’ index March 62 (62 last)
- Factory orders Jan. 0.1% (0.4% expected)
- Federal Reserve announcement No change in rates
- Weekly jobless claims 3/16 221,000 (225,000 expected)
- Philly Fed index March 13.7 (3.0 expected)
- Quarterly services survey Q4 1.2% (1.8% last)
- Leading economic indicators Feb. 0.2% (0.0% last)
- Markit manufacturing PMI March 52.5 (53.0 last)
- Markit services PMI March 54.8 (56.0 last)
- Existing home sales Feb. 5.51 million (5.12 million last)
- Wholesale inventories Jan. 1.2% (1.1% last)
- Federal budget Feb. -$234 billion (-$215 billion last)
THE WEEK AHEAD
Mon March 25th
- None scheduled
Tue March 26th
- Housing starts Feb.
- Building permits Feb.
- Case-Shiller home price index Jan.
- Consumer confidence index March
Wed March 27th
- Trade deficit Jan.
- Current account deficit Q4
Thu March 28th
- Weekly jobless claims 3/23
- GDP revision Q4
- Pending home sales Feb.
Fri March 29th
- Personal income Feb.
- Consumer spending Feb.
- Chicago PMI March
- New home sales Feb.
- Consumer sentiment index
For the week, the S&P 500 moved down by 0.77% for a year-to-date return of 11.72%
Summary
IBD: Uptrend under pressure
GMI: 6/6- Bullish signal since market close of January 31, 2019 as of Friday AM
BCI: I am favoring out-of-the-money strikes 3-to-2 compared to in-the-money strikes for new positions
WHAT THE BROAD MARKET INDICATORS (S&P 500 AND VIX) ARE TELLING US
The 6-month charts point to a slightly bearish market tone. In the past six months, the S&P 500 moved down 4% while the VIX (16.48) moved up by 35%.
Wishing you the best in investing,
Alan and the BCI team
Allen,
Can i ask you a question about something i didnt find in your books or maybe i just dont understand correctly? I found examples of this matter only on or near expiration Friday but not an example for in the first two weeks of the contract. I think i figured it out but i need to be sure if i am doing it right.
My English writing isnt very good, i can read it good enough but writing is more difficult for me. Excuse me for that.
What if the next example occurs?
12 march 2019:
I bought 100 shares of RDSA at € 27,075
I sold the call RD 18/apr/2019 with strike € 27,5 @ € 0,34
21 march 2019:
Today the stock is trading € 28,37
The price of the option now is € 1,04
So after what i have learned my thought would be that i first take the intrinsic value out of the price to buy back the option.
Price option = 1,04
Intrinsic value = 0,87 (=current stock price 28,37 – strike of the sold call 27,50)
Time value = 0,17
So if i apply the 20% rule (because we are in the first 2 weeks of the cycle) in this case i should not take action because the time value of the stock is worth 50% of the original paid option.
But if the time value drops to 0,068 i should buy it back?
So my real question is: In the case of buying back an option when the stockprice went up and is now much higher then the strike, should i apply the 20/10% rule on the time value of the option and not on the real price of the option?
Id really appreciate it if you can help me with this matter. Thank you in advance.
(I wrote a review on the Belgium website where i bought exit strategies.)
Greetings,
Jean
Jean,
Glad to help. The 20%/10% guidelines apply to a stock declining in price and yes, applying these guidelines now would not be appropriate.
The guidelines apply to the entire premium. Now, for a stock accelerating in price, we are prepared to employ the “mid-contract unwind” exit strategy when time value approaches zero.
Examples are found in my books and DVDs in the exit strategy sections. Calculations can be made using the “Unwind Now” tab of the Elite version of the Ellman Calculator.
Alan
Alan,
This was exactly what i was looking for.
Thank you for your help.
Best regards,
Jean
Alan,
I have a question regarding exit strategies on cash secured puts.
I paper trade ETF’s from BCI ETF reports. Let’s assume I sold 04/18 XBI $91 ATM put for $2.50 on 03/20. The stock was trading at $91.06. On Friday stock declines to $87.86 meeting 3% exit guideline ($88.27 according to Put Calculator). Buy to close price is $4.55 (the loss is $2.05 per contract).
My question is what to do next after we buy back option? Sell the new put on XBI with the lower strike? Or choose another ETF from ETF report? I don’t know if it makes sense to buy the option back at all, as it’s only one day decline and it’s very possible that markets will rebound next or following week. From one day decline it’s impossible to say if XBI underperforms market or not long term.
What would you do in this situation?
Sunny
Sunny,
You bring up an excellent point. When there is a 1-day extreme downturn of the overall market, it may not reflect a continued pattern in much the same way that Thursdays upturn did not last long. When these events do occur I will wait for the next trading day to see if the trend is continuing. If yes, I will close the current position and immediately open a new one on a better-performer in the current market environment.
I understand that this represents a loss but mitigating losses is critical to our long-term success. A loss of $2.05 looks bad but if it becomes a loss of $5.05, $2.05 starts to look pretty good!
The 3% calculations are framed as “guidelines” in my books and DVDs for this very reason. It gives us the flexibility to wait a day or two when unusual circumstances occur..
Thanks for this question…very important.
Alan
Premium Members,
This week’s Weekly Stock Screen And Watch List has been uploaded to The Blue Collar Investor premium member site and is available for download in the “Reports” section. Look for the report dated 03/22/19.
Also, be sure to check out the latest BCI Training Videos and “Ask Alan” segments. You can view them at The Blue Collar YouTube Channel. For your convenience, the link to the BCI YouTube Channel is:
http://www.youtube.com/user/BlueCollarInvestor
Best,
Barry and The Blue Collar Investor Team
barry@thebluecollarinvestor.com
Alan
How are you? Based on you experience, when the yield curve is inverted how long takes until the economic enters to a recession?
And on this case what would be your advice.
Hope to hear from you.
Daniel
Daniel,
There certainly is no reason to panic (never is…) regarding the recent yield curve inversion. Some of the studies on historical inversion data suggest:
1- Recession historically occurs 6-18 months after inversion. So recent yield curve suggests a fair chance of a 2019-2020 recession.
2- There is a 25-30% probability of a recession on a 12-month view
These conclusions are based on a handful of similar scenarios so recession is more likely down the road but not imminent in my humble opinion.
If recession does occur, we simply continue investing with stocks and ETFs that are performing well in these environments.
Alan
Hi Alan,
I have just become a BCI investor. 2 weeks ago I purchased the stock TEAM and sold an Apr 18th call. At the time there was no earnings report date set. In the the last newsletter TEAM has an earnings report due on the 18th Apr.
Does the BCI methodology recommend immediately closing the position or is it ok to hold until the day before the earnings report is due. I was thinking that I would hold the position open until 1 day before the report date.
My first month using BCI has been awesome. I have already generated $2300 in selling calls and currently have $1600 in stock appreciation. I am trading with $53000, so the returns are amazing. This more than covers the subscription cost for the year. I have been trading for 15 years and your methodology is by far the best I have seen.
Regards
Mark
Mark,
Thanks so much for your generous comments and congratulations on your initial success. It is also critical for all option-sellers to be prepared with the 3rd required skill, position management, when trades turn against us.
Generally, we can wait until the day before the report to close our positions. In the case of TEAM, we can actually close the day of the report because the company is scheduled to report after the closing bell. This information can be gleaned from:
http://www.earningswhispers.com
Keep up the good work.
Alan
Alan and Barry,
Just wanted to share something with you.
Sunday afternoon I decided to review my portfolio overwriting. I had been keeping up with it in my major spreadsheet which has far too many tabs now and makes it somewhat cumbersome.
So I took a deep dive into the Portfolio Overwriting Calculator. This calculator is absolutely amazing! And amazingly simple.
What I did was to add the following rows(in different sections) with corresponding formula in some cases:
1. Quantity owned (rounded down to nearest 100).
2. Premium needed to meet monthly goal (function of stock price)
3. Number of contracts sold.
4. Proceeds net of commissions and fees.
Lastly I inserted the “today” function in the “Today’s date” cell.
Then I copied and pasted the last two columns five times. I saved a copy for each of my accounts. Next I entered each of my core holdings in its own column, adding each individual target date(s) and recorded my current open positions.
Eureka! Now I can not only see and but also manage all my overwriting positions on one screen.
Thank you so much for this calculator. It not only saved me an extraordinary amount of time, but, more importantly, it caused me to think of new approaches.
Thanks again,
Hoyt
PS. I am now working on a similar “program” with the PMCC calculator. It also has amazing possibilities.
2 new premium member reports now available:
The latest ETF Report and the High Dividend Yield Report for the 2nd quarter 2019 have both been uploaded to your member site today.
For your convenience, here is the link to login to the premium site:
https://www.thebluecollarinvestor.com/member/login.php
NOT A PREMIUM MEMBER? Check out this link:
https://www.thebluecollarinvestor.com/membership.shtml
Alan and the BCI team
Totally hit a double on ROKU cash secured puts recently.
On 3/15/19, sold two 5 APR 19 strike = 57, premium = 1.34
On 3/26/19, bought back at approximately 20% of the premium value at 0.32
Today, sold two 12 APR 19 strike = 61, premium = 1.85
I love these strategies!
Joanna
Yeah!
Good for you.
Discipline! Discipline! Discipline!
I wish I had yours.
Hoyt
Joanna,
Congrats…keep yup the good work.
Today may have presented opportunities to close short calls on some of our positions. Placing buy-to-close limit orders based on the 20%/10% guidelines after entering our covered call positions is a good way to automate the first step in the process.
Alan
Good Morning Alan,
Under what circumstances would I sell a cash secured put in the money? In my reading in a bull market.
Thanks,
John
John,
Yes, in a bull market when there is a heightened chance of share price moving above the ITM strike leaving it now OTM avoiding exercise. However, in these bull market scenarios I would prefer an OTM covered call, potentially generating 2 income streams.
An excellent use of ITM puts would be to buy a stock at a discount quickly when our objective is to own the underlying security at a price lower than current market value.
Alan
FREE WEBINAR:
Here is the link to the webinar I will be presenting on May 8th hosted by The Options Industry Council:
https://www.optionseducation.org/events/a000w00000sx46mqaq-en
Alan