Covered call writing, when combined with protective puts, is known as the collar strategy. The maximum gain is established by the short call strike while the maximum loss is defined by the long put strike. For example, if a stock is purchased for $48.00 per share and the $50.00 call is sold while the $45.00 put is purchased, we will realize our maximum gain when share price reaches $50.00 or higher and maximum loss when share price declines to $45.00 or lower. This article will highlight how to select the best strike prices for the collar trades using the BCI Collar Calculator.
Establishing our return goals
The collar trade is covered call writing with the additional insurance policy to the downside in the form of the protective put. The call and put premium must result in an option credit so that our goal generating cash flow can be realized. The put premium will result in lower returns than traditional covered call writing but will provide greater protection to the downside. This means we must set our initial return goals lower than conventional covered call writing. For me, I require an initial 1-month initial time value return of 2% – 4% in my accounts. When using protective puts, that percentage goal is reduced to 1% – 2%. We are trading higher potential returns for lower capital risk.
Real-life example with PayPal Holdings, Inc. (NASDAQ: PYPL)
- 6/19/2018: PYPL trading at $84.24
- 6/19/2018: PYPL $85.00 call generates a “bid” price of 2.94
- 6/19/2018: PYPL $83.00 put cost has an “ask” price of $1.98
PYPL call option chain for 7/20/2018 expirations
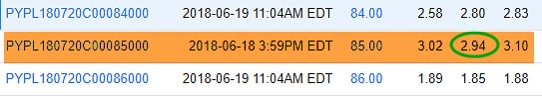
PYPL Call Option Chain
PYPL put option chain for 7/20/2018 expirations
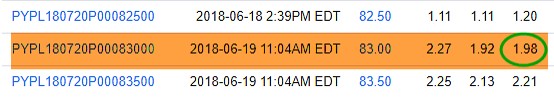
PYPL Put Option Chain
Collar calculations using the BCI Collar Calculator
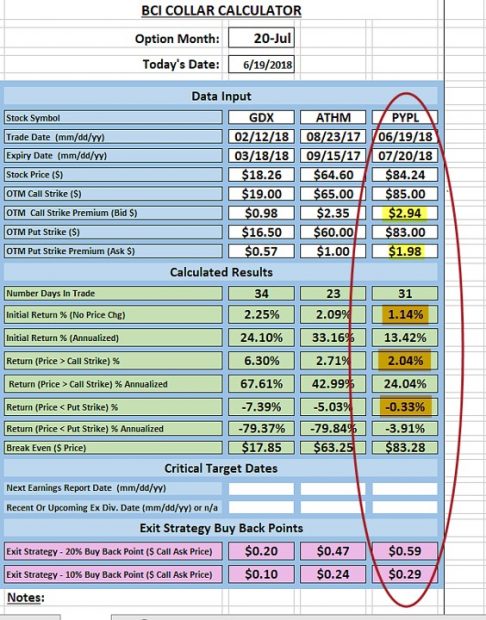
Collar Calculations for PYPL
Note the following:
- The yellow-highlighted cells show the call and put premiums
- The brown cells reflect potential returns
- 1.14% if share price remains the same (meets our 1% – 2% initial 1-month time value return goal)
- 2.04% if share price moves up to the $85.00 call strike or higher
- -0.33% if share price declines to the $83.00 put strike or lower
***Other strikes can be inserted into the blue cells at the top of the spreadsheet if stated goals are not met.
Discussion
When selecting call and put strikes for collar trades, an initial time value return goal is required. Strike prices and their associated premiums can be adjusted if stated goals are not confirmed by the BCI Collar Calculator.
THE BCI COLLAR CALCULATOR CAN BE PURCHASED INDIVIDUALLY OR AS PART OF A 3-CALCULATOR PACKAGE AT THIS LINK;
**********************************************************************************************************************************************
HOLIDAY DISCOUNT CODE/ Last chance for holiday orders
Give the gift of education this holiday season and use this discount promo code to get a 10% discount at checkout on all items in the BCI store:
HOLIDAY10
Click here to enter the store the BCI store
**********************************************************************************************************************************************
Upcoming event
February 7th – 10th, 2019
Orlando Money Show
Omni Orlando Resort @ Champions Gate
February 7th – 10th 2019
Speaking schedule:
1. Getting Started with Stock Options: Creating Monthly Cash Flow with Covered Call Writing
February 8, 2019, 3:10 pm – 3:40 pm
2. Getting Started with Stock Options: How to Select the Best Options in Bull and Bear markets
February 9, 2019, 2:00 pm – 2:45 pm
Market tone
This week’s economic news of importance:
- Job openings Oct. 7.1 million (7.0 million last)
- NFIB small business index Nov. 104.8 (107.4 last)
- Producer price index Nov. 0.1% (-0.1% expected)
- Consumer price index Nov. 0.0% (as expected)
- Weekly jobless claims 12/8 206,000 (226,000 expected)
- Federal budget Nov. -205 billion (-139 billion last)
- Retail sales Nov. 0.2% (0.1% expected)
- Industrial production Nov. 0.6% (0.4% expected)
- Markit manufacturing PMI Dec. 53.9 (55.3 last)
- Markit services PMI Dec. 53.4 (54.7 last)
- Business inventories Oct. 0.6% (0.3% last)
THE WEEK AHEAD
Mon Dec. 17th
- Home builders index Dec.
Tue Dec. 18th
- Housing starts Nov.
- Building permits Nov.
Wed Dec. 19th
- Existing home sales Nov.
- FOMC statement
Thu December 20th
- Weekly jobless claims 12/15
- Philly Fed Dec.
- Leading economic indicators Nov.
Fri December 21st
- GDP revision Q3
- Durable goods orders Nov.
- Personal income Nov.
- Consumer spending Nov.
- Core inflation Nov.
- Consumer sentiment index Dec.
For the week, the S&P 500 moved down 1.26%% for a year-to-date return of -2.76%
Summary
IBD: Market uptrend under pressure
GMI: 0/6- Bearish signal since market close of November 13th, 2018 as of Friday morning
BCI: Selling an equal number of out-of-the-money and in-the-money strikes. Will hold with this ratio until the Fed announcement this coming Wednesday.
WHAT THE BROAD MARKET INDICATORS (S&P 500 AND VIX) ARE TELLING US
The 6-month charts point to a bearish tone. In the past six months, the S&P 500 down 6% while the VIX (21.63) moved up by 81%.
Wishing you much success,
Alan and the BCI team
Premium Members,
This week’s Weekly Stock Screen And Watch List has been uploaded to The Blue Collar Investor Premium Member site and is available for download in the “Reports” section. Look for the report dated 12/14/18.
Also, be sure to check out the latest BCI Training Videos and “Ask Alan” segments. You can view them at The Blue Collar YouTube Channel. For your convenience, the link to the BCI YouTube Channel is:
http://www.youtube.com/user/BlueCollarInvestor
Best,
Barry and The BCI Team
barry@thebluecollarinvestor.com
Are you legging into these collar trades? I can’t seem to reproduce a trade like yours (2.00% profit with .33% risk).
Jeff,
Generally, the best and worst case scenarios will be closer as shown in the screenshot below using closing prices today for PFE and the January expiration.
With the collar, we are buying insurance for our covered call trades and the amount of insurance will dictate the cost. The article was written in July when calls were more in demand than puts…not the situation today.
This is a difficult market environment to make conclusions regarding percentage benefit and risk but we can’t have a better market environment to make a case for protective puts.
CLICK ON IMAGE TO ENLARGE & USE THE BACK ARROW TO RETURN TO BLOG.
Alan
Alan,
This is a perfect time to read your article.
I understand that 1% per month is much better than staying in cash and waiting for the bull to come back.
It is also much better then investing in treasuries or mutual funds.
Another plus, is that I will stay in tune with the market, and learn to use the collar strategy.
Thank you for thinking of us – Roni
Hi Roni,
I might offer a different view about the merits of just staying in cash after this tumultuous expiry :)!
A month ago when I was planning this coming Friday I thought a great place to park cash would be in Cash Secured Puts (CSP’s) and bring in premium on things I was OK with buying. Yet the market has a way of testing your mettle and your resolve when the rug get’s pulled out from under you :). Suffice it so say I called this expiry very wrong on my CSP’s.
All are in the money. Any “income” from them is forfeit to defray account loses and I will have some head scratching to do Friday on which ones to buy back, roll and try again and which ones to take assignment on, switch to selling calls against and wait for better days.
When the bears get loose there are few good places for us campers to hide :). Our options selling helps and certainly taking long bets on the short side speculating on inverse ETF’s, buying puts, selling overhead call spreads, etc., can help and I do all that stuff because I am an active trader and junkie :).
But I suspect most retail folks who have jobs, families, real lives and other hobbies are not parked on their trading platforms and would prefer market conditions with more reason and stability than those we have now. I would too. – Jay
Jay,
you describe it very well. It is a very tough moment.
Roni
Ask Alan Video Topics:
A few of our new premium members have inquired about the location of the list of “Ask Alan” video topics. The file (currently of 153 videos) is located on the member site in the “resources/downloads” section as shown in the screenshot below.
A new video is added each month and the entire library of Ask Alan videos is available only to premium and video members.
CLICK ON IMAGE TO ENLARGE & USE THE BACK ARROW TO RETURN TO BLOG.
Alan
Premium members:
Also added to the resource area of the member site is the “Stock Evaluation Worksheet 2019” with the MAR and OBV indicators incorporated into the screens.
Alan and the BCI team
Premium Members:
This week’s 8-page report of top-performing ETFs and analysis of ALL Select Sector Components has been uploaded to your premium site and is available in the “ETF Reports” section. Look for the report dated 12-19-2018.
New members check out the video user guide located above the recent reports.
For your convenience, here is the link to login to the premium site:
https://www.thebluecollarinvestor.com/member/login.php
Alan and the BCI team
Premium members:
The Blue Chip Report of top-performing Dow 30 stocks for the January 2019 contracts has been uploaded to your member resource area (right side) of the premium site.
There were 6 Dow 30 stocks that have broken even or increased in value in both short and longer-term time frames.
Alan