
Strike price selection should be a focus when selling call and put options. With the stock market bearish and volatile at the start of 2016, this article will highlight how such choices will offer significant protection while still allowing for compelling returns. The stock I selected to demonstrate the main points is Adobe Systems, Inc., a stock that has appeared on our Premium Watch List over the years although it is currently not on that list. I chose this stock because its option returns are typical of the securities normally found on our list and because it does not report earnings during the February contracts as we enter another earnings season.
In my books and DVDs I always stress that we should favor deeper-out-of-the-money puts (lower than current market value) and in-the-money calls (also lower than current market value) when a defensive posture is indicated as it is now in my view.
Options chain for ADBE

ADBE Options Chain for 2/19/2016
Note that the out-of-the-money $87.50 put generates $2.09 and the in-the-money $87.50 call generates $4.35. To afford maximum protection, we will first sell the out-of-the-money put so let’s feed the information from the options chain into the BCI (single-column) Put Calculator.
Put calculations for ADBE
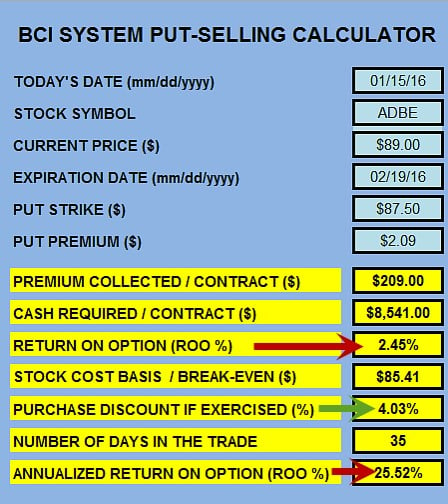
ADBE- Put Calculations
Note that if ADBE does not drop below the $87.50 strike from $89.00 by expiration, we will have generated a 2.45%, 1-month return which annualizes to 25.52%. If the stock price dips below the strike, our cost basis (breakeven) is $85.41 or a 4.03% discount from current market value. If this latter scenario occurs and the shares are put to us (we can always buy back the option if we do not want to take possession of the shares) we can then sell an in-the-money call option. For purposes of this article, we will extrapolate a bit and assume a similar return next month for the call as we would receive this month.
Call calculations for ADBE

ADBE- Call Calculations
Note that the in-the-money strike generates a 3.3% (40% annualized), 1-month initial return with 1.7% downside protection OF THAT PROFIT. This means a breakeven of 5.0% (3.3% + 1.7%).
2-month calculations
In this hypothetical scenario based on a real-life options chain, our 2-month breakeven protection on the put side is 4.03% and on the call side is 5.0% for a total breakeven protection of 9.03%. This means that to lose money ADBE would have to decline in value to below $80.96. If, on the other hand, the markets calm, there is opportunity to generate significant monthly returns.
Discussion
Strike price selection is a powerful tool at our disposal to navigate through bear and volatile markets. Deeper-out-of-the-money puts and in-the-money calls should be given serious consideration in these market conditions. Navigating difficult markets is not for everyone. We must be comfortable and trade within our own personal risk-tolerance. That said, staying on the sidelines until the markets calm is another consideration.
Upcoming live appearances
1- Saturday January 23rd, 2016: Kansas City, Missouri
9 AM – 12:30 PM
Matt Ross Community Center
2- New York Stock Traders Expo
February 21st – 23rd
Marriott Marquis Hotel, NYC
http://www.newyorktradersexpo.com/expert-details.asp?speakerID=891071A
JUST ADDED: I was recently invited to speak at The Money Show Las Vegas event on May 10th, 2016 at Caesar’s Palace.
Market tone
This has been the worst 10-day calendar start to an investment year in history. Global markets remained bearish this week reflecting concerns that US growth is slowing and raised questions about whether the US Federal Reserve will be able to pursue its forecast of four rates hikes in 2016. Having fallen 21% since its late December high, the Shanghai Composite Index is officially in bear market territory, defined as a drop of 20% or more from its recent high. Oil extended its decline, dropping below $30 late in the week. Slowing global growth, high supply from the U.S. and anticipation of additional supply hitting the markets when sanctions are lifted on Iran are adding to the bearish backdrop for oil and other commodities. Oil ends the week at 12-year lows and bankruptcy fears in the oil sector continue to grow. All this added up to another down week to start 2016. This week’s US economic reports:
- The Fed’s Beige Book, prepared in advance of the January 26–27 Federal Open Market Committee meeting, was less gloomy than many recent headlines
- Growth remains modest to moderate across most Fed districts amid few signs of wage or price pressures, according to the report
- Comments from several regional Fed presidents during the week were less upbeat. For example, Boston Fed president Eric Rosengren, a voter in 2016, said sluggish global and US growth may force a more gradual pace of tightening than officials currently expect
- The European Central Bank released an account of its December meeting that showed that there was a split over the need for further stimulus in the eurozone. The ECB surprised markets by not implementing more aggressive stimulus measures at their December meeting (not a US report, but impacts us)
- December US retail sales fell 0.1%. For all of 2015, retail sales rose a 2.1%, the slowest sales growth since 2009
- US industrial production contracted 0.4 in December and January’s Empire State manufacturing survey fell to -19.4 from 4.6 in December, setting off a fresh round of concern that US growth is rapidly losing momentum
- Corporate earnings for the final quarter of 2015 began to be released this week. Though it is still very early in the process, it is notable that among large banks that have reported thus far, most have exceeded expectations, finally a silver lining
- The Fed sent a record $97.7 billion in profits for 2015 to the US Department of the Treasury this week
- The central bank sent $19.3 billion in excess capital to the Treasury Department under the terms of the recently enacted federal highway bill. Fed chair Janet Yellen has protested the return of capital, saying it sets a bad precedent and infringes on the Fed’s independence
For the week, the S&P 500 declined by 2.17% for a year-to-date return of – 8.01%%.
Summary
IBD: Market in correction
GMI: 0/6- Sell signal since market close of December 10, 2015
BCI: Moving 1/3 of my stock investment portfolio into cash short-term. Favoring only deep out-of-the-money puts and in-the-money calls on active positions. Reducing my monthly goal for initial returns to 2% – 3% to decrease volatility risk. February contracts are 5-weeks long so I plan to hold off a few days into this coming week before taking new positions. Plan to get more aggressive when markets calm.
Best regards,
Alan ([email protected])


Premium Members,
This week’s Weekly Stock Screen And Watch List has been uploaded to The Blue Collar Investor Premium Member site and is available for download in the “Reports” section. Look for the report dated 01/15/16.
Since we are in Earnings Season, be sure to read Alan’s article,
“Constructing Your Covered Call Portfolio During Earnings Season”. You can access it at:
https://www.thebluecollarinvestor.com/constructing-your-covered-call-portfolio-during-earnings-season/
Also, be sure to check out the latest BCI Training Videos and “Ask Alan” segments. You can view them at The Blue Collar YouTube Channel. For your convenience, the link to the BCI YouTube Channel is:
http://www.youtube.com/user/BlueCollarInvestor
Best,
Barry and The BCI Team
Hello
Buying addition shares from reinvestment of dividends is
a normal practise
I do this with option premium received
Why don’t more people do this?
and why is this not talked about?
Your opinion would be greatly appreciated
Hanze,
This is an extremely astute point you mention. I discuss this in all my books, DVDs and seminars and probably should re-visit it in my blogs as well. I refer to this as “compounding your money in minutes” The cash generated from selling calls can be immediately used to purchase new shares and then sell options on those newly-acquired shares thereby compounding your money in minutes. We must always have 2-4% of our investment portfolio in cash for potential exit strategy execution.
Alan
Thanks Alan, your article is very helpful.
I will follow your indications, especially the one of waiting one week, or possibly more, and watching if the market calms down a little.
It can always get worse, and I have therefore moved more than 50% of my portfolio into cash (unfortunately after taking a big loss).
Important lesson learned here.
I believe we will have to “pedal uphill”, as you say in your book, for a fairly long time. There are simply too many negatives in the global scenario.
Good luck to all members – Roni
Hey Roni,
I have you beat on the “Scaredy Cat Index” :). I went 90% cash when we did not get the Santa Claus Rally after Christmas!
It feels good to have missed the New Year’s correction but when and by what metric to buy back is now my perplexing question.
It would have likely been better holding core positions instead of taking profits. Then flex options selling per this blog from Alan. But I could not do that this time. Too many negative forces at work.
I did not coin the one liner the market “takes the stairs up and the elevator down.” Though I wish I had :).
Corrections are swift and impossible to time. This one could be over Tuesday then back to the slow upward grind on the stairs. But key technical lines are still up in the attic, the world is a confused place and I expect 1700’s on S&P.
For whatever that is worth! – Jay
Very happy to hear that you made the right move before the crash.
That was really smart. :-o…… (admiration)
Now you can take a comfortable vacation from the market, and stay out until the weather clears.
There is trouble everywhere in the global economy, and the US may be dragged in soon.
See you later (aligator)
I mean (alligator)
Thanks Roni,
Yet what was the line from the movie “Wall Street”? Money never sleeps?
It’s hard to sit in cash. I am ever on the prowl for new ideas. Maybe calls on TLT? Maybe puts on biotech?
Yet always the risk of chasing the bus. Treasuries have done well while bio got crushed. That could turn around tomorrow. – Jay
Hi Alan, your message in the first article says that S&P500 rises on average 8-10%/year and so we should try to outperform it,- this has always been your goal you said.
But how much should we be trying to beat the market at years end by?,- what would be the minimum % more to aim for?
Other questions I have are :-
2. If at the time you want to put on a trade you notice that the price of the stock has broken out above its s/ways channel resistance, then do you still put a trade on or wait a day for breakout confirmation?, and is the option more likely to be an OTM option seeing as price likely to rise up?
3. Can you just confirm for me again(from a recent answer) that you still wouldn’t see any need to buy protective put options halfway through a contract even in the face of bad news related to the market?
4. And is there anything you do to prepare for any potential market crash (just like 87′)?, any technical /sentiment signs you may look out for in advance?
I’m glad I was not trading over those last 2 weeks – kind of unexpected I thought. Lets hope this year won’t turn into any potential bear market as we are a bit overdue. Thank you
Adrian,
My responses:
1- An option-seller who has mastered all 3 required skills (stock selection, option selection and position management) should beat the market virtually every year in my view. The goal as to by how much will depend on personal risk-tolerance as some investors are more aggressive than others. One size does not fit all. I set monthly initial return goals of 2-4% and manage my positions from there…1-2% in my mothers portfolio of ETFs.
2- I am more likely to use OTM calls when chart technicals are bullish but also factor in overall market assessment. When using multiple contracts for a position I will frequently “ladder” or use a percentage of ITM and OTM.
3- Let me clarify about protective puts. There is nothing wrong with using the collar strategy. For some, it will help us sleep better at night despite settling for lower returns. I discuss this strategy in my books and DVDs so members can make up their own minds. I personally rarely will buy a protective put but use every other aspect of our management tools to mitigate losses and enhance gains. It’s a personal decision…no right or wrong.
4- When markets are bearish as they have been lately, there is a tendency to panic and believe they are in free fall. When they are rising exponentially, we feel they are headed to the moon. The truth and reality is usually somewhere in between. I look at the charts of the S&P 500, the VIX and read all the weekly economic reports as well as follow corporate earnings. My personal market assessment, that of IBD and Dr. Eric Wish’s GMI Index are all published in my weekly blog articles and in our Premium Stock Reports.
Alan
What time of the trading day or week do you recommend for executing covered call trades. For example, don’t trade until after the first hour of trading, etc.
Don,
For entering trades, I prefer executing trades between 11 AM ET and 3 PM ET. This will circumvent the volatile early morning and late afternoon computerized institutional trading. Exit strategy maneuvers can be implemented at any time during the trading day.
Alan
Premium members:
This week’s 7-page report of top-performing ETFs and analysis of ALL Select Sector Components has been uploaded to your premium site. The report also lists Top-performing ETFs with Weekly options.
This week, there are only 4 non-leveraged ETFs that meet our system criteria and also did not lose value over the past 3 months. Like last week, the best-performers are the 4 inverse ETFs found on page 6 of the ETF Report.
For your convenience, here is the link to login to the premium site:
https://www.thebluecollarinvestor.com/member/login.php
NOT A PREMIUM MEMBER? Check out this link:
https://www.thebluecollarinvestor.com/membership.shtml
Alan and the BCI team
Alan:
You frequently mention avoiding selling an option with a forthcoming earnings report due within the contract period, & from past experience, I understand why. But, what advice do you offer when an assigned Put from the previous contract period results in owning a stock with an earnings report scheduled to occur within the current contract period & selling is not especially attractive currently?
Thanks,
Paul
Paul,
If you own a stock that you do not want to sell, own it through the ER and then sell the option after the report passes. If the stock has Weeklys, you can sell Weeklys for the entire month with the exception of the week of the report.
Alan
Alan, thanks for the good lengthy answers you gave and for that question 2, I think I may more likely want to wait for a price breakout confirmation by a day first, as you may remember the stock ‘CALM’ (in Nov), which actually had me fooled into a false breakout – want to avoid that if I can!
Here below are 4 more questions I have thought of :-
1. When during a contract month the price of a stock declines, then how would you view the stock as underperforming the market at any particular moment, so you would be likely to immediately do a DMCP instead of rolling-down?
2. If I were to put on a limit-sell order to only sell a stock if it goes below a certain price, then I am wondering if an automatic sell would occur if the candlestick wick dipped below my ‘sell-point’ yet price then closes above it? (does it depend on how much lower price goes or how long it has been below my sell point?)
3. Is it true that the stocks that have larger strike price gaps(like $5), will have less liquidity than another stock with a smaller price gap(like $1)?
4. And last question for the present moment we are in.
You want to wait for market to become less volatile(a good choice) but how do you know when is best time to put on trades again? There is also only 3 current stocks that have passed, with 2 of them too costly, so when time is right for trading – maybe in a few days – then do I just hope there are some ETF’s on mid-week report to trade instead?
That’s my lot for this week. My return by papertrading your system last year wasn’t much at only around 2%, yet as S&P500 was down -3.14% over this period then means I outperformed by 5%. Think this is a good return or should it have been higher? (I must say though that all papertrades were done at after-hours times, which became easier for me. Does this make a difference to the return?- not sure if this is alright or not either?)
Thanks for your great help.
Adrian,
1- I use a comparison chart of the stock and the S&P 500 (3-month) and sell if the stock is significantly under-performing. Keep in mind that this would be rare since we would not have used this security to begin with if it were an under-performer. Checking for corporate news (www.finviz.com) is a good idea as well. This is a guideline, not a rule with a specific degree of under-performance. Most of the time I will be using one of our other exit strategies.
2- Once the share price dips below the limit price, the trade will be executed…limit order becomes a market order at that point unless you specify otherwise. Please check with your broker regarding the specifics as to how they manage limit orders.
Will get back to you on 3 and 4…
Premium Members,
The report for 01/22/16 may be delayed this weekend due to the expected winter storm along the East Coast. With storms like this in the past, I’ve lost network connectivity, power…sometimes both. Unless the storm changes track, I expect to be impacted. I will advise you as the situation develops.
Best,
Barry and The Blue Collar Investor Team
Alan, I was still waiting for your replies to last questions I had.
First for your answer to my Qu.1, you say:- “I use a comparison chart of the stock and the S&P 500 (3-month) and sell if the stock is significantly under-performing.”
But on a previous article titled “When do we sell our covered call writing stocks”(24/1/15), you are using a 1-month chart for 4 stocks. So why use a 3-month chart?, I am talking about during the month so is this different compared to end of month price performance comparisons?(1-month actually seemed better.)
2. I ask again, those stocks that have larger strike price gaps(like $5), will they have less liquidity than another stock with a smaller price gap(like $1)?
3. On ‘Earningswhisper.com’ there is a predicted short, medium,
and long-term trend for each stock. I am wondering what you think of this prediction, and is this something we should use, so to be made aware of the stocks likely trend,- or maybe for not even buying a stock at all,- if short-term trend was forecast to be down?
4. If using weekly options up to an ER date, then is it still not a good idea to rollout and down the option each week?
5. Finally for the stocks I see on recent report that reported ER’s that are not in the 1st contract week, then if they don’t have weeklies then I don’t understand why these are even listed?
No need now for me to ask you about ‘waiting for market volatility to go’ as for now I found some Etf’s to try out. Hope these workout.
Thanks again for your time.
Hello Allan,
Re your example “Using Out-Of-The-Money Puts and In-The-Money Calls to Manage Bear Markets.”
I can follow the short OTM put fine, but the short ITM call confuses me. For the short call mentioned, i.e. Strike 87.50 and call premium of 4.35, shouldn’t the breakeven be 91.85, not the 84.65 mentioned in your article?
Thanks,
kk
Ken,
If a stock is purchased for $89.00 and selling a call option generates $4.35, the stock price would have to drop below $84.65 before the position would begin losing money.
Alan
Allan,
I just wanted to drop a line and say that your book (Complete Encyclopedia for Covered Call Writing) is fantastic. I bought it about 6 weeks ago and although I have traded in options in the past it cleared up a lot of questions I had. One quick question… How often is a contract exercised before the expiration date? If the underlying stock rises a fair way above the strike price on your covered call say in the first couple of weeks of the contract.
Thanks in advance and keep up the great work
Dave
BCI strategy
Dave,
Thanks for your generous remarks.
Early exercise is rare because the option buyer is leaving time value on the table. Here’s an example:
A stock is trading at $42.00 and the $40.00 strike is worth $2.50. The $2.50 breaks down as $2.00 intrinsic value (amount strike is lower than current market value) and $0.50 time value. Now, if the option holder exercises early, the shares can be bought at $40.00 and sold at market for $42.00, generating a $2.00 profit…why not sell the option for $2.50. As long as the premium has a time value component to it (trading above “parity”) early exercise rarely makes sense.
Check out pages 296-299 and 443-445 of the Complete Encyclopedia…classic version.
Alan