Implied volatility is a key concept for covered call writers and put-sellers. It is a forecast of the underlying stock’s volatility as implied by option prices in the marketplace. In 2012, I published an article relating to implied volatility where volatility skew was discussed.
Volatility skew as defined in my 2012 article
The volatility skew is the difference in implied volatility (IV) between options with the same underlying security. Skews are categorized in two ways: they can be either horizontal or vertical. Vertical skews show how volatility changes depending upon the strike price. Horizontal skews refer to skews across time (that is, options with different expiration dates).
Another definition of volatility skew
Another use of volatility skew is when comparing the implied volatility of out-of-the-money calls and puts on the same underlying. When making these comparisons, strikes are compared that reflect the same degree of moneyness. For example, if a stock is trading at $47.50, the $50.00 out-of-the-money call strike and the $45.00 out-of-the-money put strikes are compared. With no market bias, we would expect the implied volatility and therefore the extrinsic premium values would be the same. In other words, there would be no skew as shown the chart below:

No Volatility Skew: Symmetrical Chart
The chart reflects calls and puts with the same values and showing no market bias. These charts existed prior to the market crash of 1987 but no longer as long stock investors look to hedge their portfolios.
How do investors hedge their portfolios
Two common ways this is accomplished is to buy puts to protect on the downside or sell calls where long calls are closed or sold to generate income. The put-buying raises put prices and call-selling lowers call prices. Market bias is currently generally to the downside.
Post-1987 volatility skew chart for puts and calls

Volatility Skew: Downside Bias
As a result of crash concerns, puts have become more expensive than calls which is reflected in the higher implied volatility of puts.
What is a reverse skew?
When there is bullish speculation, a reverse skew can occur (but it is rare). In these scenarios, calls are purchased, and puts are sold. The chart looks like this:
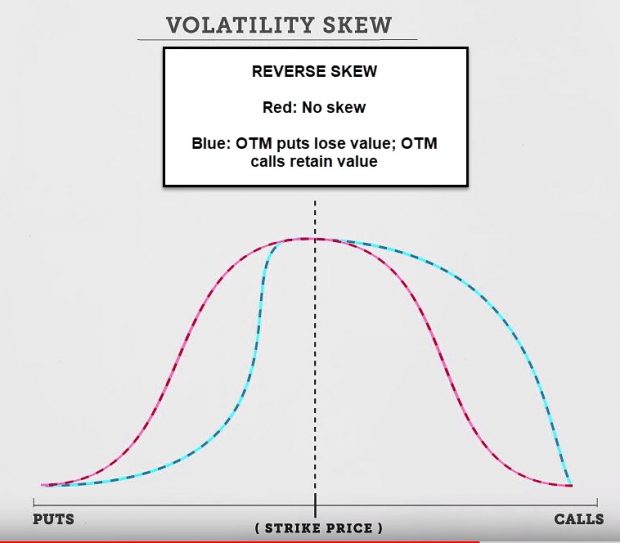
Reverse Volatility Skew
These are more common in volatility products like VIX which normally are inversely related to the S&P 500 so when markets move down, VIX moves up causing a reverse volatility skew as calls are purchased and puts sold.
Downside volatility skew example

Put Volatility is Greater than Call Volatility
Both strikes are (about) 100 out-of-the-money but put price and volatility is much greater than that of the out-of-the-money call.
Upside volatility skew example
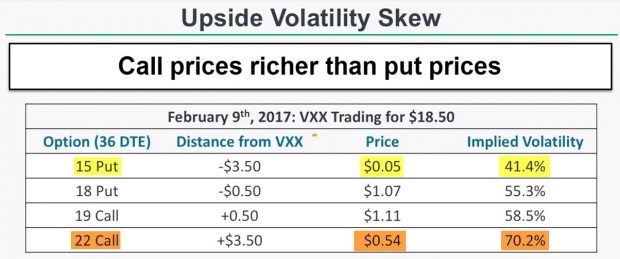
Call Volatility is Greater than Put Volatility
Both strikes are $3.50 out-of-the-money but call price and volatility is greater than that of the out-of-the-money put.
Discussion
Volatility skew is one way to explain why put premiums are generally higher than call premiums for out-of-the-money strikes. This reflects the market bias to hedge long-stock positions after the lessons learned from the market crash of 1987.
Upcoming event
May 13th – 15th
Las Vegas Money Show
Bally’s/ Paris Hotel
Speaking schedule to follow
Your generous testimonials (new feature)
Over the years, the BCI community has been incredibly gracious by sending our BCI team email testimonials sharing stories as to what our educational content has meant to their families. Moving forward, we have decided to share some of these testimonials in our blog articles. We will never use a last name unless given permission:
Alan,
I am a fully retired GI doc and we live in West Palm. You are doing a great service for the average investor and I appreciate this. I am very concerned about the market given all the political, debt and recession issues and I think that using options will help me. Every time I use a money manager, I see they cannot beat the S&P.
I very much admire your skill set and organization!!!
Best,
Steve
Market tone
This week’s economic news of importance:
- Factory orders Nov. -0.6% ((-0.2% expected)
- Markit services PMI Jan. 54.2 (54.2 last)
- ISM non-manufacturing index Jan. 56.7% (57.4% expected)
- Trade balance Nov. -$49.3 billion (-$53.7 billion expected)
- Weekly jobless claims 2/2 234,000 (225,000 expected)
- Consumer credit Dec. $17 billion ($22 billion last)
THE WEEK AHEAD
Mon Feb. 11th
- None scheduled
Tue Feb. 12th
- NFIB small business index Jan.
- Job openings Dec.
Wed Feb 13th
- Consumer price index Jan.
Thu Feb 14th
- Weekly jobless claims 2/9
- Produces price index Jan.
- Business inventories Nov.
Fri Feb. 15th
- Retail sales Jan.
- Import price index Jan.
- Industrial production Jan.
- Business inventories Dec.
For the week, the S&P 500 moved up 0.05% for a year-to-date return of 8.02%
Summary
IBD: Market in confirmed uptrend
GMI: 4/6- Bullish signal since market close of January 31, 2019
BCI: I am favoring out-of-the-money strikes 2-to-1 compared to in-the-money strikes.
WHAT THE BROAD MARKET INDICATORS (S&P 500 AND VIX) ARE TELLING US
The 6-month charts point to an improving market tone. In the past six months, the S&P 500 down 5% while the VIX (15.72) moved up by 45%.
Wishing you the best in investing,
Alan and the BCI team
Alan, excellent explanation. My question is regarding the next step of how to apply volatility skew to our trading strategy. I know you prefer CCs over CSPs but this skew might suggest a preference for CSPs due to higher premiums for the same risk.
This is the best explanation of volatility skew I have ever come across. One of Alan’s many talents. However, Steve Zoller’s question above is a very good one. I am looking forward to Alan’s response. Sea Ya!
Steve,
You always bring out excellent points.
Let me start with the etiology of this article. We had a few of our astute members (an adjective we can apply to most BCI members!), ask why the premiums for calls and puts with the same degree of moneyness were different. This article was written to respond to those inquiries.
Now, viewing this explanation, one would come to the conclusion that we should favor puts over calls. However, in my humble option, the opportunity to generate share appreciation income from out-of-the-money strikes in normal and bull market environments, outweighs the skew edge given to puts.
Being on the sell side of calls or puts can be strategies that generate amazing and consistent results once the 3-required skills are mastered. I give a slight edge to ccw but certainly a case can be made for put-selling.
Alan
Alan, thanks for the perspective. I haven’t commented in quite awhile. Glad you remember me. 🙂
Alan speaking at the Money Show in the Omni Orlando Resort at Championsgate.
CLICK ON IMAGE TO ENLARGE & USE THE BACK ARROW TO RETURN TO BLOG.
Alan,
If in PMCC Calculator ‘Initial Trade’ (Calculated Results) value is negative, does it means we need to avoid trade?
Thanks,
Sunny
Sunny,
You are 100% correct. The trade initiation requirement for the PMCC is that the difference between the 2 strikes + the initial short call premium must be greater than the cost of the LEAPS options. This assures that if the trade must be closed because of strong price appreciation, it will close at a profit.
See pages 117 – 133 in “Covered call Writing Alternative Strategies” for more detailed information on trade initiation requirements for the PMCC.
Alan
Alan
Hi
I can not see on the premium members site the new weekly stock screen. The last One for me is the 02/01.
Is it only me?
Federico,
,
We sent out an email on Wednesday with the ETF notification to our premium members that this week’s report would be published on Monday (slight chance of late today) due to seminar travel and flight restrictions.
My team will send out our usual email when the report is uploaded to the member site and we’re working hard to get it ready as soon as possible.
Catching up from our return from Orlando Money Show with emails and blog questions.
Alan
thanks Alan and sorry
Quinnipiac GAME Forum:
I will be speaking at the Quinnipiac GAME Form at the NY Hilton in NYC on March 29th. This is an amazing event where college and graduate finance majors gather from around the world… a really impressive group. It’s an honor for me to be part of it. If anyone has a relative attending, please have them look me up.
Alan
HI Alan,
Can you please explain to me the following concepts:
(1) In the WHAT NOW worksheet, what is meant by and how is it calculated for “NO BOUGHT UP VALUE” under CELL J80
(2) Also, on CELL N80 (Without upside potential column), I do not see why we are deducting the “NO BOUGHT UP VALUE” figure. I thought by deducting the cost of buying to close the option, that is all we need to figure out the true return for “without upside potential”
Thank you,
Mazin
Mazin,
When rolling our options and using the “What Now” tab of the Elite Covered Call Calculator or Basic Ellman Calculator, the “bought up value” represents the amount of share appreciation we receive by removing the previous short call strike. Since we are paying intrinsic value to buy back the near-month short call, we must calculate that amount as part of the rolling benefit.
For example, if we buy back a $50.00 call when a stock is trading at $60.00 for $10.10, we have an option debit of $10.10 but our share value now moves from $50..00 (our obligation to sell) to $60.00 (current market value). This results in a net debit of $0.10.
A reading of “No bought up value” implies that the strike was not in-the-money, eliminating the need to roll the option in most circumstances.
Alan
Hi all
I m trying to implement for a part of my portfolio the “High dividend stock and covered call strategy” Alan wrote about. I m really sorry this become a long post, but I really would like to use this strategy and any help will be greatly appreciated.
So I checked the High dividend stock list we can find on the Premium site and defined a list of company that suit my criteria.
But I keep making to myself many questions and I would like the help of Alan or a more experienced BCI member to help me out.
For instance one of those stock with high yields I m interested in is “T”, attached you can find the option chain for LEAPS on T. As I m writing the price of T is 29.55
Calls (EXPR: 01/17/2020) See JPG attached
As Alan Explained (if I understood properly) the main risk of this strategy is to have your option exercised prior to the ex-dividend and this will happen if :
1)the time value of the option is less than the dividend
2) the delta is 0.95 or higher
Now the 1/17/20 chain of T clearly shows that 15/18/20 strikes have a delta of 1 and therefore will be exercised
The 23 strike has a delta of 0.7982 which seems good but what about the time value ?
Time value is: the part of the premium above the intrinsic value (in an ITM call) so for STO 23 strike the premium is 6.55 (using the last trade recorded) 23.00 + 6.55 = 29.55 so this means that there is no time value in this strike only intrinsic value. One more time this means that the option holder will exercise the option prior the ex dividend.
The 25 strike has a last price of 4.9 (using the last trade record) so 25.00+ 4.9 = 29.90 since the price of the stock is 29.55 the time value is 0,35. But this is not enough since the quorter dividend from T is 0,51, this means that the option holder still has interest in exercising the option since dividend (0,51) is higher than 0,35 time value.
Now the 28 strike has enough time value but is too close to the stock price and therefore the increase in dividend is very marginal (no worth).
May be is better to watch at the 1/15/2021 exp. (attached) With stoke price at 29.55
For 15.00 strike delta is ok but no time value (15.00 + 14.30) = 29.30
For 18 strike delta is ok but no time value (18.00 +11.35) = 29.35
For 20 strike delta is ok but no time value (20.00 +9.5) =29.50
Now it is a bit better if I use the ask price and not the last price, but how much better?
For the 15.00 strike (15.00 + 14.8) = 29.80 here we have a bit of time value (29.80- 29.55 = 0.25 of time value) but it is less than the 0,51 dividend the option holder would get from exercising the option.
For the 18 strike (18.00 + 11.80) is the same as above
Indeed neither the 2021 expiration seems to offer good trades
Calls (EXPR: 01/15/2021) see JPG attached
So I start to think I m really missing something big. For sure I made some silly mistake, Alan or a more experienced member can you kindly point me in the right direction and show me my mistake?
P.S. there is someone who is using or used this strategy? What about your results with it?
Thanks
federico
Federico,
My sincere compliments on your command of options, the Greeks, price fluctuations, market mechanics and all the moving pieces that comprise this crazy game. You are clearly a well educated guy who has done his home work deserving applause and success! Seems to me you are not missing anything not to mention something big. Your command of topic is complete.
Maybe it is just me getting grey in the beard and long in the tooth but as time goes by I simplify. I no longer churn my portfolio. Too much work. I keep core holdings, over write them when premium is there, leave them alone when not and trade small in my speculative portfolio. That works for me. But the key is finding and feeling good about what works for you!
Only experimentation, beatings, bruises and sleepless nights will get you there. I wish there was a short cut through the woods :)! – Jay
I am no where near your league at number crunching. I wish I had your brain power! To me an investment either makes sense or it doesn’t. If it does hold it and over write a part of it each month for loss protection.
Well, e-mail is a clumsy medium and it is always funny to see how I goof it up :)! Sorry for the mid thought sign off – Jay 🙂
Dear Jay I m honored by your kind words.
My feeling is that i m a young scolar with a great teacher (Alan) and many very good mates from whom i can learn a lot (you for sure and all the experts BCI members).
I m still looking for an answer, I can not belive that this strategy does not work.
May be the answer is that the optinon holder of a LEAPS wants to become an option seller, i mean he is interested in the capital appreciation of his long position and is not willing to have the stock only to get the quorter dividend.
really don t know.
May be Alan can be so kind to clarify this point.
thanks
federico
Federico,
You hit the nail on the head. Most option buyers just want to be option sellers, not share owners to capture a dividend.
Now, if there is a time value component to the LEAPS premium, it almost never pays for the holder to exercise to capture that dividend. Many retail investors are not aware of that fact and may mistakenly “pay $1 to make $0.50” If this occurs, the Options Clearing Corp[oration randomly sends that notice to a broker…could be ours. Our broker randomly assigns the notice to one of its clients…could be us.
Let’s look at the chart attached to your exceptional inquiry:
With T trading at $29.55, the $23.00 LEAPS had a bid price of $6.75. If exercised, we sell our shares for $23.00 + the premium of $6.75 = $29.75, a $20.00 per-contract profit…less than the dividend, but a profit nonetheless.
Now from the LEAPS holder perspective:
Exercise the call (worth $6.75) and buy shares at $23.00 ($29.75 cost-basis) to capture a $0.51 dividend, or:
Sell the LEAPS for $6.75, buy the shares for $29.55 and capture the dividend of $0.51. Exercise ends up benefitting $20.00 per-contract less.
Worst case scenario is we break even or make a slightly smaller profit than the dividend. Best case (and more likely scenario) is that we capture the dividend at a much lower cost-basis.
No strategy works all the time but we do favor those that work more often than not.
Alan
Premium Members,
This week’s Weekly Stock Screen And Watch List has been uploaded to The Blue Collar Investor premium member site and is available for download in the “Reports” section. Look for the report dated 02/08/19.
Also, be sure to check out the latest BCI Training Videos and “Ask Alan” segments. You can view them at The Blue Collar YouTube Channel. For your convenience, the link to the BCI YouTube Channel is:
http://www.youtube.com/user/BlueCollarInvestor
Since we are in Earnings Season, be sure to read Alan’s article, “Constructing Your Covered Call Portfolio During Earnings Season”. You can access it at:
https://www.thebluecollarinvestor.com/constructing-your-covered-call-portfolio-during-earnings-season/
Best,
Barry and The Blue Collar Investor Team
barry@thebluecollarinvestor.com
Premium Members,
A revised and updated Weekly Report has been uploaded to the Premium Member website. The GMI has been corrected.
It initially read “Bearish”, now corrected to “Bullish”. Look for the report dated 02/08/19-RevA.
Thank you, Tom!
Best,
Barry
Alan,
Just wanted to let you know that you are such a great teacher that I am able to sell covered calls and manage my trades so well that I don’t even need to do an analysis when the market moves…I just intuitively do what needs to get done according to the rules of the strategy. Lastly, I have taught my 21 year old son how to do this, and I’m convinced he is going to be at least independently wealthy or at best a millionaire by the time he is 35. I can’t thank you enough. Xoxoxo.
Joanna,
Thanks so much for sharing your story. Passing your knowledge and trading success to your son takes all your hard work and due-diligence to an even higher level.
Congratulations!
Alan
New Blue Chip Report (Dow 30 stocks):
Has been uploaded to the premium member site. 4 stocks were removed and 2 new equities were added from last week’s report for the March contracts.
Alan
I met Alan Ellman at the Money Show and I bought all of his books that were available. I had no idea what to expect for a seasoned trader and book Author and I was pleasantly surprised that I read 3 of his books and working on the other 2 and they are the best that I have ever read. They are so easy to read and he is an awesome writer. I thought I knew it all and learned I had a lot to learn. I learned quickly that Alan is a genius and knows more than anyone I have ever met. Thanks for writing the books.
Alan A
Alan,
You certainly made my day. Thanks for taking the time to write such a generous note. I’m going to pour some ice water on my head as it seems to be swelling up a bit.
Alan
Hi Alan,
It has been a few months since I last emailed you of my progress.
I decided to keep papertrading until the end of 2018′(from Sep), so that I would then have final years % results to show you.
And I thought that I may as well, since I already had practiced for the majority of the year, also of questions I still needed understand during last year.
So I had calculated each months return and last years papertraded return I calculated to an unbelievable “29.57% (compounded)”, or “30.90% .(non-compounded.)”
Now these results could have been higher still, the reason is because when I papertraded every month I didn’t even ‘play the B/A spread’. I will most definitely do this skill on real orders, but just liked to work with minimum figures, plus it saved a bit of time.
Because I would likely compound my trades, then my best months result was in May at 6.42%, – which also happens to be the best since I started. I can say also last year, perhaps it was because it was a good one for the S&P500, that I had 11 out of 12 positive returns with the only loss being for April at a -2.51%.
Even in past years of 2016 and 2017, my years % returns also came in at ‘11.87%’ and then ‘16.15%’, – I did forget to tell you this, but anyway I definitely know I am alot more skilled and competent at this option strategy then I used to be! (the 2 years prior to this were no good at all.)
I had utilized the use of protective put options a few times, and after selling a stock I would leave the put option in, then by using Hrly charts I could try trading it to potential support levels to cash out,- this strategy of mine had helped boost some past monthly results.
So yeah with returns that high I actually can’t wait to try CC’s in real-time. I have decided on a smartphone to buy, but first just want more insight on the trading platform before opening an account, and I will tell you again soon how it is all going.
Adrian
Hi Adrian,
Thanks a million for sharing your stellar results. Great to see that all your hard work and due-diligence is paying off.
Alan