Covered call writers hold two positions. We are long (own) the stock and short (sold) the call option. It is intuitive to investors that it is to our advantage if the stock price accelerates or at least does not decline in value. There are five possible outcomes in the stock portion of our trade:
- Stock price rises significantly
- Stock price rises moderately
- Stock price does not change
- Stock price declines but less than the option premium amount
- Stock price declines significantly
Covered call writers enjoy positive results in all but the last of these scenarios and that’s where our position management skills are called upon to mitigate. It is apparent that buying low and selling high on the stock side of our trades is one of our goals and that is why we work so hard to develop a screening process that will throw the odds in our favor for a positive outcome. This article will highlight why this objective also applies to the option side of our trades.
Outcomes after selling options (overall percentages)
- Option is exercised and our shares are sold (about 10% of the time)
- Options are closed or bought back (about 55% – 60% of the time)
- Expires out-of-the-money or worthless (about 30% – 35% of the time)
Theta is our friend
After generating our initial option premiums, Theta (time value erosion) begins depreciating the value of our options. This is a positive in the event we decide to buy back our options. Since Theta is logarithmic in nature for near-the-money strikes, the value declines slowly initially (yellow field) and then much faster as expiration approaches (brown field) as seen in the screenshot below:
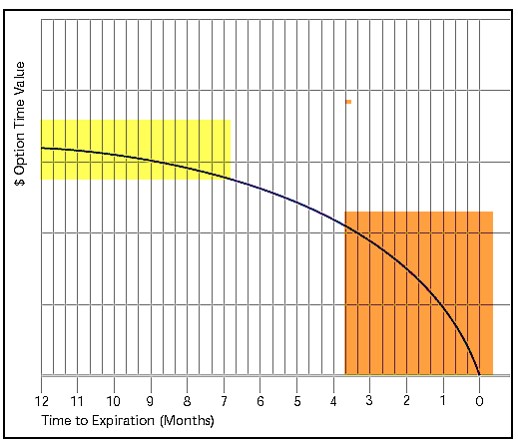
Theta Impact on Option Premium
Acquisition and sale dates for option-selling
When we buy and then sell a stock, the purchase date comes first. When we sell an option and then buy it back (buy-to-close or BTC), the sales date comes prior to the acquisition date (Buy-to-close). Here’s how it looks in the Schedule D of the Elite version of the Ellman Calculator (free to premium members and for sale in the BCI store):

Elite Calculator Code D3
Code D3 of the Schedule D of the Elite Calculator represents a scenario where a stock is purchased, a call option is sold and then bought back prior to contract expiration. It represents the option side of the trade only. Note the following:
- This is a 1-month trade with 2 possible outcomes
- The option was sold for $2.00 ($200.00 per contract) on 2/19/2018. This is the sale date.
- If the option is closed (bought back) for $0.40 ($40.00 per contract), there is a 400% capital gain on this option trade
- If the option is closed for $2.50 ($250.00 per contract), there is a realized capital loss of 20%
- The options were bought back or closed on 3/16/2018. This represents the acquisition date.
- Both scenarios are short-term capital gains (losses) as shown in the brown fields
***Frequently, we have a short-term capital loss on the option side but an unrealized capital gain on the stock side, resulting in a net unrealized capital gain on the overall trade.
The Basic Ellman Calculator (no Schedule D) is available for free by clicking this link.
Discussion
Covered call writers benefit from stock prices that accelerate and option values that decline. Mastering stock screening supports the former goal and Theta benefits the latter. It is instructive to realize that the acquisition (sale) date for option-selling occurs after the sale date.
Upcoming event
AAII National Investor Conference: Las Vegas Nevada
October 26 @ 8:00 am – October 28 @ 1:00 pm
October 26th – 28th, 2018 (Friday through Sunday)
Alan’s presentation: Saturday October 27th at 9:30 AM
Visit Alan, Barry and the BCI team in the exhibit hall Friday, Saturday and Sunday
Market tone
This week’s economic news of importance:
- Consumer credit July $17 billion ($9 billion last)
- NFIB small business index August 108.8 (107.9 last)
- Job openings July 6.9 million (6.8 million last)
- Wholesale inventories July 0.6% (0.1% last)
- Producer price index August -0.1% (0.2% expected)
- Real median household income 2017 $61,372 ($60,309 last)
- Weekly jobless claims 9/8 204,000 (210,000 expected)
- Consumer price index August 0.2% (0.3% expected)
- Core CPI August 0.1% (0.2% expected)
- Retail sales August 0.1% (0.3% expected)
- Industrial production August 0.4% (0.3% expected)
- Consumer sentiment September 100.8 (97.0 expected)
- Business inventories July 0.6% (0.1% last)
THE WEEK AHEAD
Mon September 17th
- Empire State index September
Tue September 18th
- Home builders’ index September
Wed September 19th
- Housing starts August
- Building permits August
- Current account deficit Q2
Thu September 20th
- Weekly jobless claims 9/15
- Philly Fed index September
- Existing home sales August
- Leading economic indicators August
Fri September 21st
- Markit manufacturing PMI September
- Markit services PMI September
For the week, the S&P 500 moved up by 1.16% for a year-to-date return of 8.65%
Summary
IBD: Market in confirmed uptrend
GMI: 6/6- Bullish signal since market close of July 9, 2018
BCI: Selling an equal number of ITM and OTM strikes for new positions. Tariffs still a concern.
WHAT THE BROAD MARKET INDICATORS (S&P 500 AND VIX) ARE TELLING US
The 6-month charts point to a bullish tone. In the past six months, the S&P 500 was up 7% while the VIX (12.10) down by 30%.
Wishing you much success,
Alan and the BCI team
Good Morning friends,
I am happy to get this blog started. My next best selling book is titled “How to Buy High and Sell Low. Consistently”.Kidding.
But funny how it often seems that way when trading. My book will discuss everything not to do in the market because I have experience and done every bone head thing possible :).
Yet I do think we learn more on fumbles than touchdowns. We learn more in “oh sh##” moments than we do in celebration.
And in the end learning and getting better is what it is all about.
Hi Jay,
I hope there will be a Kindle version.
I always purchase and read books on my old Kindle before I buy the paper version if I like it.
Good luck – Roni
Hi Jay,
I agree:
“Yet I do think we learn more on fumbles than touchdowns. We learn more in “oh sh##” moments than we do in celebration.”
I believe that if we can survive through our “fumbles” and get the principles and fundamentals down pat we become a Master.
At that point we make our decisions to enter trades based on these two items. That doesn’t mean that all of the trades will work out. There is no magic bullet! As we analyze our losers we must determine if we made the right decision with the info we had at the time of initiating the trade and if we exited the trade at the appropriate time.
If we did these two things right and still lost then there was nothing to learn except that we did it right. If we didn’t do these two things right we should figure out why and learn to not do it again.
For covered call and cash secured put selling these principles and fundamentals are set out for us at BCI. We just need to study and learn.
For those of us who additionally buy calls or puts I have not seen a comparable organization. I believe this is because buying calls and puts is much more risky.
Alan listed the five possible outcomes above and we know that in covered call selling we only lose in with the last outcome. With call buying we lose with three and possibly four of the five outcomes.
Thus, as I think you may have said before, we need rules not guidelines. I may be wrong it might have been Roni.
With call, or put, buying we must get two things absolutely right. (1). The price direction of the underling must be accurately determined. (2). The time frame must be accurately determined.
If you can get both of these right the rewards can be tremendous!
I have found that I need to initiate several positions to end up with one or two real winners. What needs to be mastered, assuming correct principles in underling selections, time frame selection and strike price selection is risk management or as Alan says position management. That is exiting quickly with minimal losses on those trades that turn against you and reducing a position appropriately when a trade is really going in your favor. It can be done but it requires much effort and discipline.
My problem is not following my rules, usually because of greed. Also the risk really goes up with weeklies. My experience with weeklies is the underling selection is the most critical skill. I usually only deal with ATM strikes or one step ITM strikes but most of my winners have been ATM.
I can’t tell you how much it means to me to have this blog to share and learn.
Sorry for the epistle form of this post.
Thanks for all you contribute.
Hoyt T
Hoyt,
Quoting what you said:
“What needs to be mastered, assuming correct principles in underling selections, time frame selection and strike price selection is risk management or as Alan says position management. That is exiting quickly with minimal losses on those trades that turn against you and reducing a position appropriately when a trade is really going in your favor. It can be done but it requires much effort and discipline.
My problem is not following my rules, usually because of greed.”
Very true…
Interesting to note there are two sides of every trade, where one side generally is smiling widely and the other is grumpy.
The battle is to wisely take the steps so you are mostly on the winning side of your house.
Mario
MarioG,
Thanks for the reminder.
One of my sons used to “dig at me” in regards to my stock trading by saying that I was participating in a zero-sum game. Since I had tremendous respect for how he had conducted himself in life it got me to thinking. I finally wrote him a long epistle on why that was not the case. I listed all of the reasons I could think of as to why Wall Street with all its faults was still the most efficient way to deploy capital ever devised. There is a high cost in dealing with WS and some capital is destroyed by being deployed to entities that waste it. But the good use of it far outweighs that which is destroyed.
I will not repeat all those reasons why stocks are not a zero-sum game or why we really do need a stock market that is as liquid and transparent as possible but his comments also got me to thinking about options.
So I ended up with a second “Letter to the Children” in which I outlined why options were also not a zero-sum game. I will not list all those reasons, but basically I tried to explain how speculators, his description of me, provided the liquidity for all kinds of legitimate reasons for people and organizations to hedge their positions with options and futures.
Unlike those of us who have gone “deep in the weeds”, he, like most of the general public, had no idea of how the stability of our economy depends on (that bad word) derivatives. They only see the bad results when derivatives become too esoteric and are misused.
So here is a toast, “To those Speculators, I have heard them referred to as Gunslingers, who provide the liquidity for the stability of our free market economy. May they continue their good work and their ranks always be refilled by those brave and sometimes foolish souls who by trying to do what accrues benefits to them personally unknowingly benefit all of us”.
Hoyt T
Premium Members,
This week’s Weekly Stock Screen And Watch List has been uploaded to The Blue Collar Investor Premium Member site and is available for download in the “Reports” section. Look for the report dated 09/14/18.
Also, be sure to check out the latest BCI Training Videos and “Ask Alan” segments. You can view them at The Blue Collar YouTube Channel. For your convenience, the link to the BCI YouTube Channel is:
http://www.youtube.com/user/BlueCollarInvestor
Best,
Barry and The BCI Team
barry@thebluecollarinvestor.com
To all my friends.
The way I see it, Alan’s article above, explains the BCI core methodology:
Sell the options HIGH, and buy them back LOW during the first part of the contract, or let them go worthless after one month or so, which is lower than LOW.
Even if the underlying shares are exercised/assigned, you end up with the forecasted gain from buying the options LOW and selling them HIGH.
You may have lost from the overall trade, but certainly less than someone who bought the underlying without selling the options.
Roni
One more thing.
You may have gained less than someone who did not sell the options, and the underlying went sky high, but still, you have gained handsomely.
Roni,
How true.
In the past I have have used covered call writing on bio techs with with very high valued options. Some may remember one of Alan’s articles on AAOI.
I bought one, Blue Bird I believe, maybe Puma. Anyway I bought 100 shares at $35.00 and sold 1 contracts at $9.00. One morning within a week it opened at $78.00 and I was assigned that day. Why someone would rationally do that is beyond me but it happened.
When I told someone about it they were shocked at my ineptness in selling the option. To them a loss of $3300.00.
I told them I would never have owned the stock if it had not come up on my screening for this type of stock and that I was totally satisfied with a $900.00 profit in one week.
Take care,
Hoyt T
Hoyt,
that’s it, 26% frofit in one week? Annualized = 1,350% ?
More than fantastic !!!
Roni
Alan,
I hope that today is a profitable one for you. I’m trying to organize myself and my trading strategy. I am reading some of your material and watching the free videos. I am looking to start a watch list. I see you vet stocks in your premium membership. You also recommend IBD for evaluating fundementals. Would I need to subscribe to IBD and your membership to fully engage the markets and your strategy?
Thanks,
Harry
Harry,
No need to subscribe to IBD if you become a member. We’ll do all the screening for you on all sites.
Alan
Premium Members,
The Weekly Stock Screen and Watch List has been revised and uploaded to the Premium Member website. Look for the report dated 09/14/18-RevA. The reason for the revision is updated risk data. No stocks were impacted by the updated data.
Best,
Barry
Alan,
I have a question regarding a covered call strategy, I have sold covered calls with some success on NFLX, of course NFLX is an expensive stock and I was wondering if a strategy where I would purchase a deep in the money call say 4 or 5 months to expiration with a Delta approaching 1.0 then sell weekly calls NTM or In the money depending on outlook. In this case the long call would move almost dollar for dollar with the underlying and even if the stock soared the short call could be bought back at expiry without a loss, do you think this is an acceptable strategy?
Thank you.
Keith
Hi Keith,
just like you I was trading NFLX several times with success until it became too expensive for me.
I still like the stock, but it exceeds my present trading level, so I believe that the best way is to wait.
Maybe they will split and we can come back, or maybe we become more wealthy and can increase our trading level.
Good luck – Roni
Keith,
The strategy you are referencing is commonly known as “The Poor Man’s Covered Call” or technically the “long call diagonal debit spread”.
Like all strategies, there are pros and cons to the PMCC and is much more than simply “covered call writing, but cheaper” as marketed in some resources.
The best approach is to educate ourselves regarding any strategy we are considering and then paper-trading before risking even one penny of our hard-earned money.
The PMCC is one of the 3 strategies highlighted in our latest book, “Covered Call Writing Alternative Strategies” Here is a link for information on the book:
https://thebluecollarinvestor.com/minimembership/covered-call-writing-alernative-strategies/
We have also created a calculator specifically for the PMCC:
https://thebluecollarinvestor.com/minimembership/poor-mans-covered-call-calculator/
Take your time with the education and paper-trading process and then an appropriate decision will be easy.
Alan
Regarding your comment in latest weekly report:
BCI: Selling an equal number of ITM and OTM strikes for new positions. Tariffs still a concern.
What do you mean by equal number of ITM and OTM strikes? Is it if you had 10 positions 5 are ITM and OTM? Or each position half is ITM and other is OTM?
If the first how do you determine which stocks are ITM vs OTM?
Thanks again,
Alvin
Alvin,
The ratio breakdown of strikes in the weekly stock report is based on the total portfolio. If I have sold 100 contracts that month with an equal ratio, 50 are ITM and 50 OTM. I will favor OTM with stocks that have the strongest chart technicals (stocks in bold in our reports).
“Laddering” strikes should also be considered. For example, if mildly bullish and selling 5 contracts for a particular stock, we may sell 3 OTM and 2 ITM. If strongly bullish, we can move to 4 and 1 or all 5 OTM.
Stocks with mixed technical signals will generally favor ITM strikes when bearish, mildly bullish or neutral on market outlook.
Currently, I am selling an equal number of ITM and OTM strikes on new positions as the impact of tariffs is a concern.
Alan
Hi Alan,
I felt compelled to let you know that in 13 days (Sept 6) these are my gains:
FTNT – 2 contracts – $582.00 3.4%
NFLX – 1 contract – $1,181.00 3.4%
CRM – 1 contract – $421.00 2.8%
VEEV – 2 contracts – $1,310.00 6.5%
Total Gains: $3,494.00 (4.0%) Capital Used: $86,520
If the market is good tomorrow (9/19) I will close these, take gains, and look to double by redeploying in this same October cycle.
I know we are in a bull market and I am worried about the elevator shaft down on any given day. But I’m only using $143,000 of my $500,000 IRA and giving myself some downside protection on about half of my underlyings. I’m still holding PANW (collar) and just put a new trade on today in WWE . I’m also in BABA (not on BCI Premier list) as I liked the last quarter gains and the drop off it had. I thought it might bounce back but the tariff talks have this stock spooked and it is currently flat for me. I just may exit and find a new one tomorrow.
I think I may have found my new retiree job.
So, thank you Alan, this for me is by far the safest and most efficient way to be the CEO of my money.
At some point next month I hope you can address the upcoming midterm elections. I think a change in the balance of leverage in congress could very well be the elevator shaft I worry about on the morning of Nov 7th. I may just sit that cycle out or maybe buy some puts, just to be engaged.
Cheers Alan,
Jim
Jim,
Thanks for sharing. You are addressing all 3 required skills (stock selection, option selection and position management) while also factoring in overall market assessment and that bodes well for long-term success.
We have been in a bull market since March of 2009. For most of that run, our government has maintained its system of checks and balances. I believe the market is anticipating the House flipping to Democrats with an outside chance of the Senate flipping as well. Either way, a return to our system of checks and balances is likely to some extent and that has existed for most of this bull market run.
That said, taking a defensive portfolio posture for the November contracts is a reasonable approach and one that I frequently take prior to major events like the mid-term elections.
Alan
Premium members:
This week’s 8-page report of top-performing ETFs and analysis of ALL Select Sector Components has been uploaded to your premium site. The report also lists Top-performing ETFs with Weekly options as well as the implied volatility of all eligible candidates.
New members check out the video user guide located above the recent reports.
For your convenience, here is the link to login to the premium site:
https://www.thebluecollarinvestor.com/member/login.php
NOT A PREMIUM MEMBER? Check out this link:
https://www.thebluecollarinvestor.com/membership.shtml
Alan and the BCI team
I am a follower of the blue collar investor and thank you for sharing your knowledge with us. I own most of your books. This is an opinion question. With the Federal Reserve probably raising rates next week, should I treat it like an earnings report and temporarily exit the stock market? What is your opinion?
Thanks,
Rocky
Rocky,
The market is anticipating the likelihood of a rate hike next week and it is already factored into the market pricing. The Fed will raise rates when the data suggests that the economy can support such an increase. The commentary associated at the next Fed announcement is an unknown that can impact the market in either direction.
The Fed meets 8 times a year so exiting the market is not practical. Taking defensive postures if and when concerns are high is an alternative approach.
Alan