Options calculations are an integral part of our BCI methodology both in guiding us in making the best investment decisions and also in determining our trading success. To assist in achieving these goals I developed the Ellman Calculator six years ago and with the benefit of your suggestions my team and I have been enhancing the tools and information this spreadsheet provides. In this article, I will describe the additions we are proud to announce for the 2014 additions of both the Basic and Elite versions of the Ellman Calculators.
Enhancements to both the Basic and Elite versions of the Ellman Calculators
Multiple tab
We have added a breakeven column, based on the feedback of many of our members. This is quite different from the downside protection column which applies only to in-the-money strikes where the intrinsic value of the premium protects the time value of the premium. In the screenshot below, I have highlighted the breakeven column which is the price paid for the shares minus the entire option premium.

Ellman Calculator: multiple tab showing breakeven column
In the top row, we paid $128.02 for the stock and sold the $125 call for $7.10 resulting in a breakeven of $120.92. Once the share price drops below $120 92 can have an unrealized loss.
What now tab for rolling options
This tab is used for calculating our returns when rolling options on or near expiration Friday. We have added a statistic for the percentage of downside protection we generate when rolling out or rolling out and up to an in-the-money strike as shown in the screenshot below:
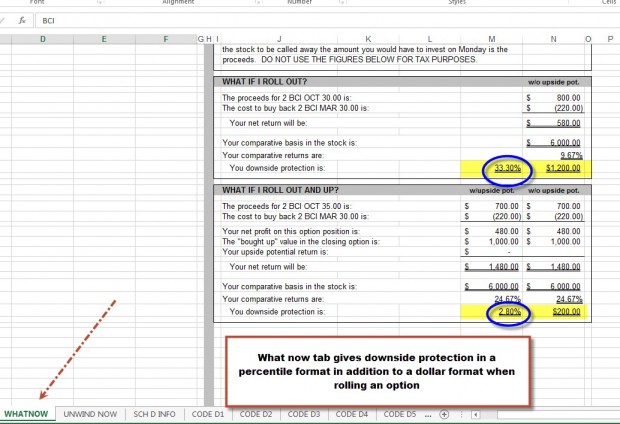
What now tab showing % of downside protection
The past versions of the Ellman Calculator showed only a dollar amount per contract of downside protection. For example, if a stock was trading @ $32 and we rolled out to the $30 call, our downside protection showed as $200. With this enhancement, it will also show as 6.25% ($2/$32), similar to the downside protection column used in the multiple tab. In the above screenshot, the downside protection for rolling out (next month’s same strike) came to 33.30% and rolling out and up to the next month’s higher in-the-money strike came to 2.80%. This is the percentage amount the intrinsic value of the premium protects the time value of the premium.
Enhancements only to the Elite version of the Ellman Calculator
Unwind now tab
This tab is used to determine if the mid-contract unwind exit strategy (see pages 264 – 271 of the Complete Encyclopedia for Covered Call Writing) makes sense. This is when the stock price rises well above the original strike sold and the time value of the option approaches zero. The goal is to close the entire position at little or no cost and use the cash to generate a second income stream in the same month with the same cash (see pages 264 – 271 of the Complete Encyclopedia For Covered Call Writing). The enhancement we created is the time value cost to close and the percentage of the cost basis we are paying to close this position. We can then determine if the cash freed up by closing can generate a significantly higher return than the cost to close. Below is a screenshot of this enhanced tab in action:
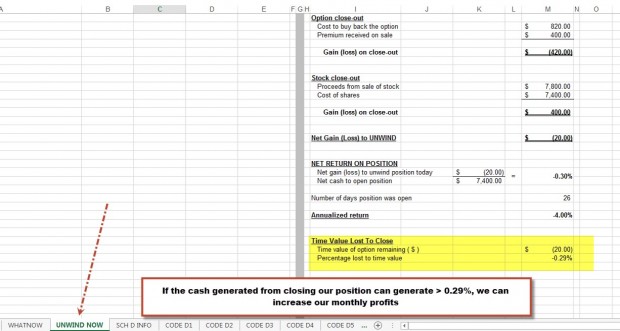
Unwind now tab of the Ellman Calculator 2014
In this case, the cost to close is $20 or a fraction of 1% (0.29%). If the cash generated from the sale of the stock can produce > 0.29%, then it makes sense to unleash the mid-contract unwind exit strategy.
Schedule D entry codes
Previous versions of the Elite Calculator showed dollar amounts of gain (loss). We have now added two columns on the right side of the page that will calculate % gain (loss) and annualized % gain (loss) as demonstrated in the graphic below:
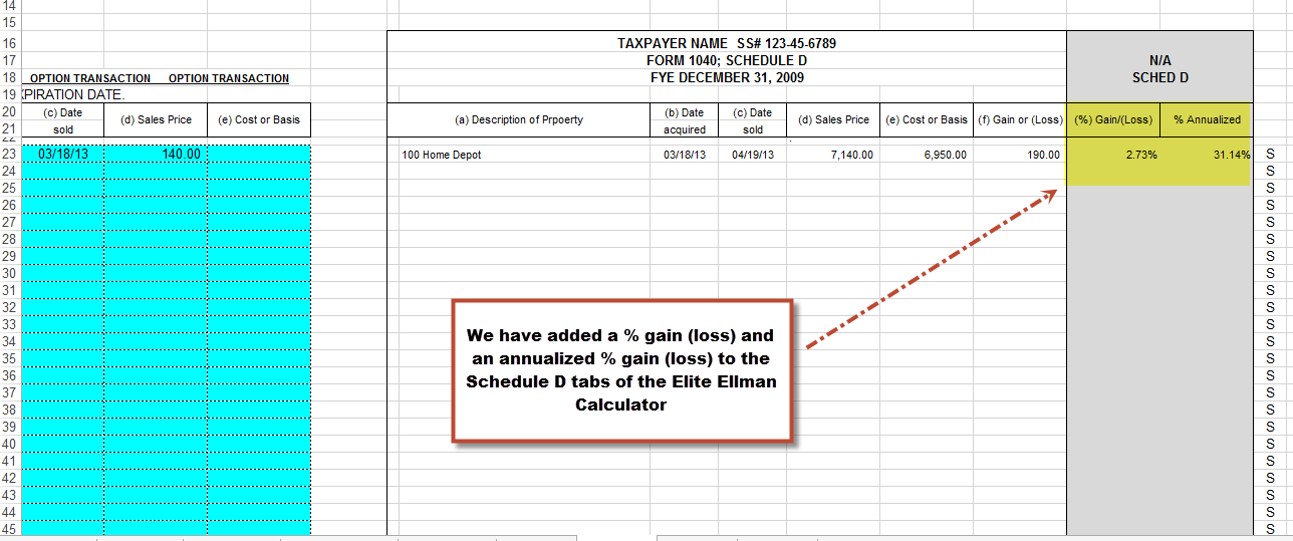
The Elite Calculator- Schedule D enhancements
The original versions, the calculator showed only a gain of $190 per contract. Now we can visualize this return as a 2.73% return which annualizes to 31.14% based on the number of days the trade was on.
Where can I get these calculators?
The Basic Ellman Calculator is free to all and can be downloaded to your computer directly from the “free resources” link located on the top black bar of these web pages. Just put in your email address and you’re in. The Elite version of the Ellman Calculator is available for purchase in the Blue Collar store or free to premium members in the “resources/downloads” section of the premium site. Just scroll down to “Elite Calculator”
Join our mailing list:
There are many perks involved in joining the BCI mailing list. Find out about upcoming seminars and free webinars as well as new products and discounts for both premium and general members. If you are receiving the weekly newsletter, you are already part of our growing list and thank you for that. If not, the best way to opt in, is to sign up for the free newsletter as shown below on the blog page:

Join our BCI mailing list
Market tone:
Despite the Commerce Department’s 3rd and lowest estimate for the 1st quarter GDP, where the economy shrank to 2.9% on an annualized basis, the financial markets appeared resilient and positive. The reason has to do with the unusual circumstances of severe weather, loss of temporary benefits for the long-term unemployed and unusual buildups of business inventories in the 2nd half of 2013:
- The Conference Board’s Index of Consumer Confidence (a gauge of consumers’ attitudes about the present economic situation as well as their expectations regarding future conditions. Consumer confidence tends to have a strong correlation with consumer spending patterns) rose to 85.2 in June, the highest level since 2008 and ahead of the 83.5 reading expected
- According to the Commerce Department, sales of new homes rose by an impressive 18.6% in May, a 6-year high. This represents an annualized figure of 504,000, well above the 400,000 predicted by experts
- The median price for new homes rose to $282,000 in May from $269,700 in April
- On a year-to-year basis, new home sales were up 16.9% and the median price of those homes rose by 6.9%
- The number of new homes on the market in May declined to 4.5 months of supply, down from 5.3 months in April
- According to the national Association of Realtors, existing home sales rose by 4.9% in May, the best showing in 3 years. This represents an annualized rate of 4.89 million units compared to the 4.73 million analysts were projecting
- Supply of existing homes fell to 5.6 months in May from 5.7 months in April
- In May, the median price of existing homes rose to $213,400 from $201,500 in April
For the week, the S&P 500 was unchanged for a year-to-date return of 7.2%
Summary:
IBD: Confirmed uptrend
BCI: Moderately bullish favoring out-of-the-money strikes 2-to-1
Wishing you the best in investing,
Alan (alan@thebluecollarinvestor.com)
www.thebluecollarinvestor.com


Alan,
I recently did a trade on TRN. At the day of expiration, the stock split 2-1, I think. How does that work in a covered call on the expiration Friday?
Here are the details. on 5/30/2014, I purchased 100 shares of TRN at 87.43, and sold 1 Jun 90 call for 1.20. On 6/6/2014, I closed the call option for 0.20, and on 6/9/2014 I open 1 Jun 85 call for 1.00.
On June 21, the option expired with the TRN stock at 42.23, so on 6/23/14, I sold 1 Jul 45 call for 0.55. As of June 27, the stock is at 43.08 in a range-bound direction.
Comments?
Mike M
Mike,
I’m quite impressed with the skills you have demonstrated with these trades. Here are my comments:
1- You used the “rolling down” exit strategy to generate an additional $80 per contract. That’s $80 more than you would have had had you not taken that action.
2- When the stock split 2-for-1 the number of contracts doubled to 2 and the strike of the $85 call was halved to $42.50.
3- The price of the stock closed @ $42.23 below the strike so you retained the shares.
4- You then sold the $45 call (hopefully 2 contracts?) and the stock is trading @ $43.08. slightly below your original split-adjusted cost basis of $43.71.
5- You will also be eligible to collect a $15 per contract dividend on 7-11-14 (see comments column on premium Member Stock Report).
6- Your 1-month return thus far is 3.5% or 3.9% including the dividend.
7- Final returns will be dictated by share price @ expiration plus any other exit strategies that may be used should the opportunity arise.
All in all, a very skillful series of trades.
Keep up the great work.
Alan
Thank you. My paper trade account with TOS has not accounted for doubling my shares, so I was not able to sell two contracts.
I have all three books, and covered calls is one of the income columns in my financial fortress.
Hi Alan,
I am new to your membership and am really enjoying it. I have two questions.
There seems to something really strange in my option chain that appeared yesterday.
AFSI 40 call July 14 2.40 ask 1.95 bid last .05.
The previous day all seemed normal.
When I checked the options volume on BigCharts.com it showed three contracts traded at that price.
Is this just some weird anomaly? or is something else going on?
My second question is asks for your advice regarding my position.
AFSI bought share 200 @ 42.50 now 41.55
Sold call @ 40 for 3.10 now 2.40
Bought put @ 37.50 for .30 now .24
Ex dividend date was yesterday.
Thank you in advance.
It’s really great getting advice from an expert like you.
Roy
Hi Roy,
Welcome to our premium member community.
I can respond to your first question and comment on the 2nd (I cannot give specific financial advice in this venue…I hope you understand).
1- It appears that there may have been incomplete information in BigCharts.com. See the screenshot below that shows a “last” price between the bid and ask which is what we would expect for such a highly-liquid option.
2- In your trade you took an extremely conservative position by both selling an in-the-money strike ($2.50 ITM) and buying a protective put. Nothing wrong with that if this is what your personal risk-tolerance dictates. The question is whether the initial returns meet your goals and only you can decide that. So let’s break this down and calculate:
The time value (initial profit) for the $40 call is $3.10 – $2.50 = $0.60. The cost of the put is $0.30 leaving you with a net options credit of $0.30. Using the intrinsic value of the call to “buy down” the cost basis from $42.50 to $40, your initial 1-month return is $30/$4000 per contract or 0.75%, less than 1% This annualizes to 9% per year. You will also capture a $20 per contract dividend which partially accounts for the share depreciation.
The price of the stock is still well above the strike sold so if the trade closed today you would end up with a modest profit.
CLICK ON IMAGE TO ENLARGE & USE THE BACK ARROW TO RETURN TO THIS BLOG.
Alan
Thank you Alan,
That was a july14 option, so I still own the stock
I not sure I made that clear in my question.
Roy
Thanks Roy…yes, that was my understanding so final results are not yet in (IF the trade closed today…).
Alan
Alan,
What is the best way to use the calculator to get the return and annualized return were for a covered call trade when it expires or is called on expiration day?
I used the “Single” sheet on the Elite calculator to evaluate a covered call trade on Sanchez Energy on 6/2. The return on the option and the return if called was good and I entered the position that day.
The stock was called on the 6/20 expiration date. I wanted to see what the return was, but when I looked back at the Single sheet template I noticed it has a formula for “Today’s Date”, and the date cell is protected, so I could not see the return. I made a copy of the sheet, unprotected the copy, and entered the original 6/2 date as today’s date. This gave me the return and annualized return, but I suspect there is a more efficient way to do this. I later entered this on the Multiple tab and was able to see the return, but it doesn’t show annualized return.
Is there a simpler way to get the return and annualized return of a completed trade?
HS,
Yes, absolutely. The first 5 tabs of the Elite version of the Ellman Calculator were created to help us make the best cc writing decisions at any given point in time. The 6 tabs in the Schedule D are used for final returns, both short and long-term capital gains (losses). In the 2014 version of the Elite version of the Ellman Calculator, we added just what you are asking for as shown in the screenshot below (may have to slide the bar at the bottom of the computer screen to see this in the actual article). Please focus on Entry Codes D2, D3 and D4 for % returns and annualized % returns for our cc trades. CLICK ON IMAGE TO ENLARGE & USE THE BACK ARROW TO RETURN TO THIS BLOG.
Alan
Premium Members,
The Weekly Report for 06-27-14 has been uploaded to the Premium Member website and is available for download.
Also, be sure to check out the latest BCI Training Videos and “Ask Alan” segments. You can view them at The Blue Collar YouTube Channel. For your convenience, the BCI YouTube Channel link is:
http://www.youtube.com/user/BlueCollarInvestor
Best,
Barry and The BCI Team
Running list stocks in the news: CAR:
Avis Budget Group has been on the Blue Collar running list for 10 weeks. It’s share price has doubled in the past year and is up 45% year-to-date.
Our premium Stock list shows an industry (leisure) rank of “B”, a beta of 1.88 and adequate near-the-money option liquidity.
Over the past 3months analysts have been raising earnings estimates pretty much across the board and 4 of the 5 past earnings reports have been positive as shown in the screenshot below.
CLICK ON IMAGE TO ENLARGE & USE THE BACK ARROW TO RETRN TO THIS BLOG.
Alan
Dear Alan,
I have a question and appreciate receiving your expert opinion. I bought 400 shares of WYNN at $200 and sold 4 contracts of July 19, $200 calls at $5. Now, the stock is at 207.50 and the option at 10.20. What is the best for me to do to maximize my gain? Also, do you offer option advisory services?
Thank you,
Hassan
Hassan,
When you entered this trade you sold an at-the-money strike which generated an initial 1-month return of 2.5%. You are obligated to sell @ $200 and as long as share value remains above $200, you will have maxed out this trade.
In the BCI methodology we do have a “mid-contract unwind exit strategy” where in certain circumstances, we can generate higher than a max return. This information is detailed with examples on pages 264 – 271 of the Complete Encyclopedia for Covered Call Writing and in both BCI DVD Programs. In this strategy the time to act is when the time value of the option premium approaches zero. In this case, the time value is well above zero @ $2.70 ($10.20 – $7.50). This can change if the price of the stock continues to rise.
We are an educational and stock screening site and do not offer specific financial advice but do offer a valuable phone (skype) mentoring program for educational purposes. Here is the link for more information:
https://www.thebluecollarinvestor.com/investment-coach/
Congrats on a nice trade thus far.
Alan