Setting up our covered call writing and put-selling portfolios requires common sense analysis once our watch lists have been established. Considerations include proper stock and industry diversification, appropriate cash allocation to each position and. strike selection that will maximize our returns and reflect personal risk-tolerance and overall market assessment. In this article, I will dissect the very first covered call writing portfolio established by one of our members who we will call Carl E Olson…CEO for short.
Stocks purchased on 5/21/2018
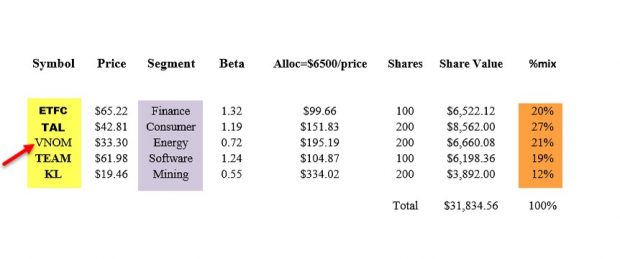
Covered Call Writing Stock Portfolio
- Yellow field: 5 different stocks selected
- Purple field: 5 different industries represented
- Brown field: Cash representation per position ranged from 12% to 27%
Report card
“A” – The 12% – 27% range isn’t bad considering the limited funds available.
Options sold on 5/22/2018
Uh oh. The stocks should be bought and the options sold at (relatively) the same time. let’s move on and look at the position spreadsheet:

Portfolio Mix with Options Sold
- Red arrow on far left: VNOM is the only stock that is not in bold, and therefore has the weakest technical parameters of the 5 underlyings (still not bad from a technical perspective)
- Yellow field: 2 ITM strikes (blue arrows) and 3 OTM strikes selected, reflecting a neutral to slightly bullish market assessment
- Red arrow in center: An OTM strike was used for VNOM, the only non-bold stock
- Brown field: An initial time value return of 4.25% was generated, before trading commissions
- Blue field: An initial time value return of 4.10% was generated after trading commissions
- Note that TAL has an especially low ROO (initial time value return on the option) of 0.30%
Report card
“B” – Options should be sold when shares are purchased. This would have resulted in even higher initial 1-month returns than 4.10%. Also, when splitting OTM and ITM strikes, VNOM, the only non-bold stock, should have been affiliated with an ITM strike. Overall, an excellent first portfolio set-up for our friend, CEO.
Discussion
When setting up our option-selling portfolios after our watch lists have been established there are several considerations that need be factored in to elevate our final returns:
- Stock purchase and option sale must be done simultaneously unless using stocks already in our buy-and-hold portfolios
- Stock and industry diversification
- Cash allocation per position
- Technical analysis of underlyings: bullish or mixed
- Strike price selection based on chart technicals and market assessment as well as personal risk tolerance
- Calculations must meet our initial return goals
Upcoming event
February 7th – 10th, 2019
Orlando Money Show
Omni Orlando Resort @ Champions Gate
February 7th – 10th 2019
Speaking schedule:
1. Getting Started with Stock Options: Creating Monthly Cash Flow with Covered Call Writing
February 8, 2019, 3:10 pm – 3:40 pm
2. Getting Started with Stock Options: How to Select the Best Options in Bull and Bear markets
February 9, 2019, 2:00 pm – 2:45 pm
Market tone
This week’s economic news of importance:
- NFIB small-business index Oct. 107.4 (107.9 last)
- Federal budget Oct. -$100 billion (-$63 billion last)
- Consumer price index Oct. 0.3% (0.1% last)
- Weekly jobless claims 11/10 216,000 (210,000 last)
- Retail sales Oct. 0.8% (0.6% expected)
- Philly Fed Nov. 12.9 (20.0 expected)
- Business inventories Sept. 0.3% (0.5% last)
- Industrial production Oct. 0.1 (0.2% expected)
THE WEEK AHEAD
Mon Nov. 19th
- Home builders’ index Nov.
Tue Nov. 20th
- Housing starts Oct.
- Building permits Oct.
Wed Nov. 21st
- Weekly jobless claims 11/17
Durable goods orders Oct.
Existing home sales Oct.
Consumer sentiment Nov.
Leading economic indicators Oct.
Thu November 22nd
- None- Thanksgiving Day
Fri November 23rd
- Markit manufacturing index Nov.
- Markit services index
For the week, the S&P 500 moved down by 1,61%% for a year-to-date return of 2.34%
Summary
IBD: Market uptrend under pressure
GMI: 1/6- Bearish signal since market close of November 11th, 2018
BCI: Selling only in-the-money strikes until market recovery is confirmed. Remain confident in long-term health of the stock market. No change from last week.
WHAT THE BROAD MARKET INDICATORS (S&P 500 AND VIX) ARE TELLING US
The 6-month charts point to a bearish tone. In the past six months, the S&P 500 was up 1% while the VIX (18.14) moved up by 35%.
Wishing you much success,
Alan and the BCI team
Alan:
My understanding is that weekly options contracts list starting Thursday of the week preceding the week during which expiration takes place. But actually I see weeklies listed for example, for ULTA, several weeks out.
Assuming an options selling pattern of selling weeklies when is the best time to sell the option for the upcoming week? Put another way : The Nov16 calls for ULTA expired today (Friday Nov 16). Assume that based on the price of ULTA being way much lower than the breakeven for the option I sold for the Nov 16 call, I don’t expect to be assigned and its say 2 pm on the expiration Friday. Assume further that the current price for the option is less than 10% or even 20% of the premium I obtained. Is it correct to buy to close and then sell an option for the next week on the preceding Friday? Or should I just allow the option to expire and sell the call on the upcoming Monday? This goes to the question of how much time value do I lose for a weekly OTM strike if I sell on Monday of the week it expires as opposed to Friday, or even Thursday, of the week when the previous weeks option expires.
At the risk of being rude I repeat myself maybe in a more understandable way. From the beginning : Sell ULTA NOV 16 315 call on Monday, by Thursday or Friday the call is worth, say 10% of the initial premium. Should I buy to close on Friday Nov 16 (or even Thursday Nov 15) and then, on Nov 15 or 16 immediately sell NOV 23 call at appropriate strike? Or should I let the NOV 16 call expire and sell a NOV 23 call on Monday NOV 19? Do I lose significant time value for the weekly call if I wait to sell it on the Monday as opposed to the previous Friday?
This question is also relevant in that the report for stocks for the next week is generally delivered on Saturday or Sunday. I realize that my question is not too relevant for the monthly options selling scenario as the time decay over initial 2 or 3 days of the month is very low.
Perhaps you may wish to include this question (condense as you like) in an Ask Alan video.
Best regards,
Ed
Ed,
Most Weekly options are part of the expanded Weeklys program, a topic I wrote about 5 years ago in this blog:
https://www.thebluecollarinvestor.com/weekly-options-standard-and-expanded-expirations/
You are very astute in considering time value factors relating to closing and opening positions…well-done. Here are reasons why I prefer allowing a deep OTM option to expire worthless and write the new call on Monday:
1. Theta (time value erosion) is based on 7 calendar days spread over 5 trading days. Market-makers factor in weekend erosion on Thursday or Friday of the current week and so there is little time value advantage of entering new trades on Friday rather than Monday (from a time-to-expiration perspective).
2. We are able to factor in weekend news when establishing our new positions on Monday.
3. One less trading commission.
Please see our file, “Weeklys Pros and Cons” when deciding on expiration time frames.
An “Ask Alan” video on this topic is an outstanding idea…I’ve made a note.
Alan
Premium Members,
This week’s Weekly Stock Screen And Watch List has been uploaded to The Blue Collar Investor Premium Member site and is available for download in the “Reports” section. Look for the report dated 11/16/18.
Also, be sure to check out the latest BCI Training Videos and “Ask Alan” segments. You can view them at The Blue Collar YouTube Channel. For your convenience, the link to the BCI YouTube Channel is:
http://www.youtube.com/user/BlueCollarInvestor
Since we are in Earnings Season, be sure to read Alan’s article, “Constructing Your Covered Call Portfolio During Earnings Season”. You can access it at:
https://www.thebluecollarinvestor.com/constructing-your-covered-call-portfolio-during-earnings-season/
Best,
Barry and The BCI Team
barry@thebluecollarinvestor.com
Is selling a cash secured put to enter into a covered call position a good way to trade?
Thanks,
Jozef
Jozef,
Yes, I particularly love this approach in bear and volatile market environments. In my books and DVDs, I refer to this as the PCP (put-=call-put) strategy:
https://www.thebluecollarinvestor.com/alan-ellmans-selling-cash-secured-puts/
Alan
Alan,
What is your thoughts on BULL PUT SPREADS? I find this strategy appealing as initially it requires less capital on margin accounts. Also if underlying declines we can sell the long leg for a profit and turn the short leg to a cash secured put. After taking an assignment we could write a covered call on it.
Am I getting it right?
Thanks,
Sunny
Hello Sunny,
Yes, I agree, the Bull Put Spread (BPS) is a very nice trade. Although we don’t currently teach that strategy, you can use our Weekly Premium Stock Report to find good BPS candidates. However, we are thinking about adding this strategy to our toolset in the future although no decisions have been made on this.
The exit strategy you describe can work but the usual approach to a BPS is to closely manage the trade and not get assigned. Many professional traders recommend that you exit the trade when you achieve 75% to 80% of your maximum return. If you are, in fact, assigned, then:
– The approach you mentioned can work depending on how far the stock has dropped.
– After assignment, you can immediately sell both the long put and the stock.
– After assignment, you can exercise your long put and sell the recently assigned stock…assuming the stock hasn’t dropped too far.
You need to be careful with a BPS because one losing trade will impact your overall profitability from multiple past trades. BPS tend to work better with higher priced stocks in order to get decent premium. However, if you are assigned, it can get very expensive. With credit spreads in general, careful trade management is critical with the objective of not getting assigned and completely changing your trade plan for the position.
Take a look at the article from Investopedia for additional ideas:
https://www.investopedia.com/articles/optioninvestor/05/051005.asp
Best,
Barry
Barry,
Thanks for your insights and link. BULL PUT SPREADS is more sophisticated strategy, I hope you and Alan will teach it some day!
Sunny
Alan:
When, as a result of the application of the “Show or Fill Rule” the MM opts to not fill the order, where/how is the order published as required? Is this the value I see noted as “Last”?
Thanks for your assistance, as always.
Paul
Paul,
During normal market trading hours, if the market-maker does not execute a limit order that “improves the market”, the “offer” is reflected in the bid-ask spread. Let’s say the spread is $2.50 – $3.00 and a limit order is entered at $2.70 to sell a call. If the order is not executed, the spread will change to $2.50 – $2.70 (when meeting requirements of the “Show or Fill” rule).
The “last” stat represents the amount of the last trade for that security and will not change unless the limit order is accepted and executed.
Alan
Alan.
My complements to you and your team for evolving the Screening-Watch List tool with the addition of the OBV and MAR metrics.
I do, however, have a question regarding MAR. From almost everything I’ve read about Analysts ratings, there is a clear bias on their part to rate stocks as Buys versus Sells. As I’m sure you know, many Analysts are hesitant to issue sell ratings on a stock as the Investment Banking side of their firms provide financing deals to these same companies. Additionally, when Sell ratings are issued its often long after a stock has had a significant price decline. In other words, there is an inherent conflict of interest in the ratings many Analysts provide.
With that in mind, is MAR really an appropriate metric to add to the Screening-Watch List tool? I would appreciate your thoughts on this.
Thanks and regards,
Mike
Mike,
There is an apparent conflict of interest when an analyst is evaluating a corporation that is doing business with the institution there the analyst is employed. That said, there are definite advantages and value in factoring in MAR (mean analyst rating) into our premium stock reports:
It adds an institutional component to our screening process:
Since institutional investors (hedge funds, mutual funds, banks and insurance companies) are responsible for most of the price movement of the market, it is important to view their take on stocks and industries. When there is an analyst upgrade or downgrade, we see movement in the underlying in the corresponding direction…so we know they pay attention to these ratings.
The BCI team only eliminates stocks with MAR ratings >3
Assuming a “buy bias” on the part of analyst ratings, a stock with a MAR between hold and strong sell should be a security viewed with extreme concern. See the screenshot below:
Ubiquiti Networks, Inc. (UBNT) shows no “buy” or “strong buy” ratings and an overall 3.20 MAR. This is a stock that would not survive the BCI screening process.
Analysts can rank corporations 1 – 3 and not reflect a “sell rating”:
If we are considering 2 stocks that are similar from fundamental, technical and common-sense perspectives, and had MARs of 1.5 and 2.9, this metric may guide us to the former.
You decide:
Much like the “industry rank” metric, each investor can determine how much weight he or she wants to give to MAR. It is simply another metric the BCI team is making available to our premium members that offers an institutional component to our screening process. A favorable MAR will never, in and of itself, cause a stock to become “eligible for option-selling” but can be utilized to confirm or distinguish a stock that has passed all other rigorous screens.
CLICK ON IMAGE TO ENLARGE & USE THE BACK ARROW TO RETURN TO BLOG.
Alan
Alan,
I viewed your video below related to covered call writing on the VOO. Personally, I would choose the SPY because of it’s large open interest even on most weekly’s.
Have you ever tested this strategy?
When you set your goal at .5% monthly, or 6% annually, is this achievable considering you have some months where the market rises and others where it falls. Of course I am assuming one would manage their positions according to your rules. Since the SPY pays close to 2% in dividends, the return would be 8%.
Is there an optimum goal for the SPY?
Would you consider a technical timing criteria to change your strike price or stay out of the market altogether?
I have a difficult time emotionally with large drawdowns, however I see that covered call writing certainly smooths out the performance graph.
(For example, I am thinking of one position this month that went against me. I rolled down once thereby picking up two premiums. It expired OTM and the stock rose today so I am currently positive on the overall position. I was personally pleased!)
Thanks for your support, Jake
Jake,
The video relates to “portfolio overwriting” where we plan to keep the underlying for the long-term, frequently for tax purposes and dividends. If this is the case,. a decline in share price will not detract from the additional option premium…share price would have declined with or without the option component.
Our risk is in share price accelerating well beyond the out-of-the-money call strike. The deeper out-of-the-money we go, the lower the premium and the lower the chance of having to close the short call.
A 6% annualized goal is reasonable as long as strike selection and position management skills are mastered.
Glad your trade was a successful one. In normal market conditions there will be many more.
Alan
Hi Jake,
A concept I had to get clear in my head early on was the difference between “cash flow” and “income”. Interest on a CD and a paycheck are income. Dividends and options premiums are cash flow.
We can overwrite SPY for 6% annually and get a 2% divy for 8 % cash flow but if SPY goes down 10% in the same year it’s just 8% loss protection for a 2% net loss and not “income” at all since our account went down. But only a fifth of what it would have gone down without the cc’s!
Similarly on the upside when we cap it with cc’s and SPY goes up 20% chase as we may we likely won’t match that unless nimble and skilled.
I have been on a long search for a “free lunch” in the market and am still hungry :)! There are always trade offs…. – Jay
Hey Jay,
Exactly right for tax qualified accounts. IRA. 401-K, etc.
There is no “free lunch” unless you are a politician and you have “friends” who in the old days would back date the trade when the product, usually pork bellies, would go up in price at the end of day. You remember the high profile politician who made $100,000.00 in one day and by the way had never traded futures before?
As for the rest of us, we must determine the most appropriate risk reward approach. In my case it’s the most appropriate fear greed approach.
As I said to Alan, if we can arrive at our optimum risk level then with cc writing we can choose the appropriate strike price whether ITM or OTM depending on our market assessment. In any event as you described above we forgo “home runs” and choose a lot of “singles” and an occasional “double”. Sort of the hare vs. the tortoise approach.
Now if I could only practice what I preach. This morning I bought AMZN $1535 Nov 23 ’18 Calls. Bought too early and paid $19.93. They promptly fell to $12.75. As i write this they last traded at $16.25.
Take care,
Hoyt
Thanks Hoyt,
I enjoyed your note to Alan and his reply below. I agree with you that of the various authors, coaches, trading services I have read and tried over the years I have learned the most from the simple, conservative and common sense approaches Alan teaches. I trust him.
You mention risk. I have commented a couple times that I see my investing as a risk based pyramid. At the base are my core holdings I don’t plan to trade or sell unless all hell breaks loose! I over write some of that and some I leave alone. Next tier are more aggressive niche theme holdings in areas I like such as robotics or cloud computing or even defense spending. Next tier is credit and debit spreads on directional things I like a month or two out. At the top with tiny amounts is day trading expiring SPX contracts M/W/F and option buy speculation like your AMZN.
Like you, I have this stuff in my blood and it is my main retirement hobby. I have some open csp’s as part of my base investing for Dec. I did not write any cc’s since we were at market lows Monday and yesterday and I suspect we will be in much better shape by Dec expiry. We shall see :)!?
AMZN by Friday close may not let you down. The truncated Friday session is usually the most single consistently bullish day each year and I wish you luck!
A Happy Thanksgiving to all….- jay
Jay,
We have very similar investing philosophies. You are more sophisticated, particularly with the SPX M/W/F. I have looked at them but I’m like the guy on the TD Ameritrade commercial “It’s just complicated” 🙂
Have a great Thanksgiving,
Hoyt
Alan,
While I am sitting on the sidelines(finally), not initializing any new positions, I thought I would tell you something I have been thinking about for several weeks now.
I have tremendous respect and appreciation for your having created what I believe to be the best investing strategy I have seen in the 40+ years I have been trading stocks. If I were starting out now as a new investor I would go full Monty on your methods. That is as I see it to buy stocks monthly and sell either calls or puts on those stocks. Using the BCI Watch List I would follow your diversification rules for the stocks and pick strikes prices based on my personal risk tolerance: lower return goals for lower risk and higher return goals for higher risk. Then manage my exit strategies based on your rules. Would I never lose money? Of course not. But in the long run I believe I would generate a greater return versus the risk employed.
But I am even more impressed and respectful of your blog work. To answer questions quickly and be so supportive of all the people who ask questions is awesome. You are truly a servant leader. May God bless you.
Your taking care of your mom is also impressive as I has taken care of my mother for 49 years, the last 14 in my home while she has had dementia.
I bet you were a damn good dentist too.
Keep up the good work.
Hoyt
Hoyt,
I am humbled by the generosity of your comments.
The contributions my team and I (it is a total team effort) are providing to the retail investor community is returned to us tenfold in the form of friendships, speaking opportunities and testimonials all over the world.
The secret to our success is you…our members, who provide support to our new members, ideas for blog articles and videos and who have put BCI on the financial map…thank you.
Wow, what a great way to start the day! Now, let’s see if we can straighten out this crazy market.
Alan
Hoyt,
Amen !!!
Roni
Premium members:
This week’s 8-page report of top-performing ETFs and analysis of ALL Select Sector Components has been uploaded to your premium site. The report also lists Top-performing ETFs with Weekly options as well as the implied volatility of all eligible candidates.
New members check out the video user guide located above the recent reports.
For your convenience, here is the link to login to the premium site:
https://www.thebluecollarinvestor.com/member/login.php
NOT A PREMIUM MEMBER? Check out this link:
https://www.thebluecollarinvestor.com/membership.shtml
Alan and the BCI team
A happy, healthy and safe Thanksgiving holiday to all members of our BCI community…our extended family.
I am planning on taking a day off tomorrow from the insanity of the market in expectations for a return to normalcy for the remainder of the year…keeping an eye on the Fed announcement in December. The market fundamentals are all in place for a move upward.
Now to family, food and the best that life has to offer.
Alan, Barry and the BCI team