Covered call writers or cash-secured put sellers who use ETFs (as opposed to individual stocks) tend to be novice put writers, more conservative investors, or have limited funds or time. If you fall into any of these categories, knowing your risk level is critical to your investment decisions and specifically, to which underlying securities you select. One way to evaluate this risk level is to view the current implied volatility (IV) of the associated options. IV is the forecast of the underlying security’s volatility as implied by the option’s price. The implied volatility is calculated by taking the market price of the option, entering it into an option-pricing model and back solving for the value of the volatility. The higher the implied volatility, the greater the option premium will be but also the more risk incurred regarding potential downward movement of share price. The figure below is an example of the implied volatility stats we provide to our members in our premium reports (which can also be gleaned for free online as well at www.ivolatility.com) and their comparison to the overall market (S&P 500):
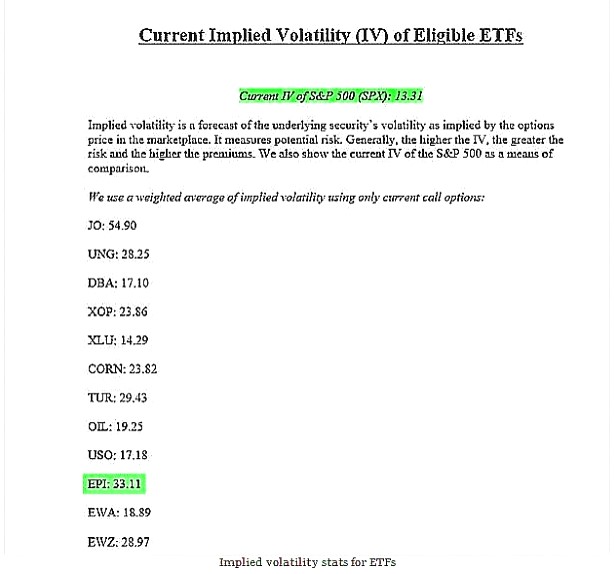
Implied Volatility stats from the BCI premium member ETF report
Another way to view implied volatility is the anticipated market view of the percentage change in the price of the security on an annualized basis in either direction. In the chart above, we see that EPI has an IV of 33.11 or about 33%. If the price of EPI was $21, then the market is anticipating a price range of $14 to $28 over the next one year ($7 in either direction or 33% of $21). The higher the IV, the more risk we are incurring for a potential price decline. As a comparison, at the top of the chart, we see the IV of the overall market (S&P 500) at the time was 13.31.
Summary
ETFs and stocks can be used as the underlying securities for covered call writers and cash-secured put sellers. The major drawback to selling options backed by ETFs is that the return or premium generated from the sale of ETF-backed options tend to be lower than the returns produced from the sale of stock-based put options (given that ETFs typically have lower implied volatility than individual stocks). In the context of writing options, ETFs tend to be more appropriate for the conservative investor, the investor with limited time or capital, or the novice investor. Personally, I prefer to write options that are associated with stock in my portfolio, however ETF-backed options are the preference when I invest for my mother’s (more conservative) portfolio. It is up to you, the reader, to determine which is best for your portfolio based on finances and risk tolerance.
Next live seminar:
Denver, Colorado
Monday May 18th…click for details.
7 Pm – 9 PM
I will be focusing on covered call writing but will also provide a segment on selling cash-secured puts.
New Put-Selling DVD program coming soon

Put-selling seminar in Plainview, New York
My recent seminar in NY was professionally filmed and will be part of our new DVD Program based on my latest book, Alan Ellman’s Selling Cash-Secured Puts. Look for discount promo codes for early bird ordering within the next couple of months.
Market tone
With one-third of S&P 500 companies reporting first-quarter earnings so far, 71% have exceeded lowered expectations. However, profits were weakened by the strong US dollar, which gained 23% during the year ended 31 March. Only 44% of companies have topped revenue forecasts. This week’s reports:
- Orders for non-military capital goods excluding aircraft, a proxy for business equipment spending plans, fell 0.5% in March, the seventh straight month of declines
- Overall durable goods orders rose 4.0%, driven by a 31% rise in bookings for non-military aircraft and a 5.4% increase in automobile orders.
- Existing home sales rose 6.1% in March to a seasonally adjusted annual rate of 5.19 million, the highest level in 18 months
- New single-family home sales had their largest drop in the same time period, declining 11.4% to an annual rate of 481,000 units. However, sales of newly built homes rose 19.4% year-over-year
- Initial claims for US unemployment benefits rose 1,000 to 295,000 for the week ended 18 April
- Continuing claims rose 50,000 to 2.33 million for the week ended 11 April
For the week, the S&P 500 rose by 1.1%% for a year to date return of 3.2%, including dividends.
Summary
IBD: Confirmed uptrend
GMI: 6/6- Buy signal since market close of January 23, 2015
BCI: I am upgrading my defensive posture due to better-than-expected earnings reports and using an equal number of in-the-money and out-of-the money strikes. This may be adjusted as we close out this earnings season.
Wishing you the best in investing,
Alan, as I had selected some ETF’s over the previous W/end(18th+19th Apr) off the report that was out few days prior to this, had seen the returns are O.K so decide to use these, but come Monday morning the S&P500 is down and technicals for all ETF’s are negative then what should I do?, – also like if there’s only a select few stocks(because of ER’s) that are in my price range but for those ones technicals/returns no good either.(so hence my reluctance to use these -instead of the ETF’s initially)?
I have 4 more questions about stock management and returns here too:-
2. In your book you said that if the technicals are a cause for concern that we should immediately close position and sell the stock,- but can you please explain what you mean by this as a recent article says to first wait for the 20%/10% option values to be reached first, and then it is at this point determine whether to sell or rolldown, etc? (but not prior to this time, – I haven’t fully understood this rule)
3. Do you have a maximum return limit for ATM strikes on ETF’s,- like no more than 2% maximum?
4. What goal should we aim for as the total end of month return?(still 2 -4% or a lower goal?)
5. Also what would be the cheapest priced stock/Etf that we should use, any minimum price you recommend?
That’s just a few things I had to cover about both stocks and Etf’s for my trade plan. Thanks for your help.
Adrian,
1- There are many more candidates this week because we are 1/3 of our way through earnings and the market had a decent week last week. In a pinch, you can look to the Select Sector SPDRs which will give instant diversification with the best performing sectors of the S&P and “settle” for 1-2% for the month. Management is handled as detailed in my books/DVDs.
2- We always close our short options position first using the 20/10% guidelines. If the technicals have broken down significantly, we then also sell the stock as opposed to rolling down or looking to “hit a double”
3- As a guideline, I rarely accept a return of more than 6% for an ATM strike of a stock or 3% for an ATM strike for an ETF. This is based on my personal risk tolerance and each investor should set a limit based on personal risk tolerance.
4- My end of month (and annual) goal is to significantly outperform the market. The numbers will depend on market performance that month. My initial goals are 2-4% for stocks in my accounts and 1-2% for ETFs in my mother’s account.
5- We will rarely find a quality stock priced under $15, usually $20 and higher. There are exceptions. “Cheap” stocks are cheap for a reason.
Alan
Alan,
I wanted to share this with you. I checked what commissions are at Merrill Edge. The assignment charge if the stock is taken away from you is only $6.95. (the same as there option trade). I think that is pretty good (and the best I have seen so far).
At Tradestation their assignment fee is $16.95 (same as my Scottrade account). Their option trade is $1
I had 400 shares of AAPL taken away from me yesterday, but that is ok, I must have sold the covered calls on them about 4x at a decent premium. Also had 100 shares of AFSI taken away.
Joe
Alan,
This is a bit off topic. This may have been addressed is a more recent blog. I am still a couple years away from being current on all blog atricles. In your older blogs, when you show option chains, the strike prices are typically in $5 increments. Currently the same underlying may have 50 cents strike increments. How does this factor into your strike selection? Have you adjusted to ‘nearer’ to ATM strikes or do you go out several increments to further strikes?
Joe M
Joe,
Over the years options have become wildly popular and supply & demand has set in increasing the number and types of products available. We now have weeklys, minis, quarterlys, many more strike prices and much more.
Strike selection takes place after selection of the underlying security and is based on market assessment, personal risk-tolerance, chart technicals and monthly goals. For example, if we are bullish on a stock currently on our watch list and look to generate a 2-4% initial return, simply find the out-of-the-money strike that generates that return. If we can’t, move on to another security that does.
Alan
Premium Members,
This week’s Weekly Stock Screen And Watch List has been uploaded to The Blue Collar Investor premium member site and is available for download in the “Reports” section. Look for the report dated 04/24/15.
Also, be sure to check out the latest BCI Training Videos and “Ask Alan” segments. You can view them at The Blue Collar YouTube Channel. For your convenience, the link to the BCI YouTube Channel is:
http://www.youtube.com/user/BlueCollarInvestor
Since we are in Earnings Season, be sure to read Alan’s article, “Constructing Your Covered Call Portfolio During Earnings Season”. You can access it at:
https://www.thebluecollarinvestor.com/constructing-your-covered-call-portfolio-during-earnings-season/
Best,
Barry and The BCI Team
Premium Members,
The Weekly Report has been revised and uploaded to the premium member site. MCO was mis-classified in the Stock Screen Section (front section) and has been revised. It was correct on the Running List so it should not have impacted any trading decisions. MCO reports on Friday, 5/1/15, as highlighted. Look for the report dayed 04/24/15-RevA.
Best,
Barry and The BCI Team
Alan, so for that first answer you gave me is it alright to use just one “ETF” or one “Select Sector SPDR” to trade with, or would you still suggest that I should hold at least 5 of one or the other?(even though there already is diversification in them)?
– So too I guess when there not many good stocks listed in my price (up to $50), that my options are that I have either got to increase my price range up to like the $80 – $100 range to have more choices, or wait for ER’s to pass – possibly being up to a week (don’t really favour this too much as may wait for a bad ER, and/or technicals could deteriorate in this time), or to go to the ETF’s/Select Sector SPDRs to hope to see either one(?), or up to 5 or so that are up to $50 – and if not then to up my price range higher again?(are these all the options I would have?)
I have now found 5 Etf’s in use in papertrade right now, but of course one day my trade selection may have to be done a bit differently to the difficulty it’s been at start of the contract this time. Thanks
Adrian,
The 5-stock guideline is based on our rule that no one stock or industry should represent more than 20% of our entire portfolio. The Select Sector SPDRs (and many other ETFs) will give us that diversification. One is okay…two or three are better. I would not force trades during earnings season if there aren’t enough candidates available in a specific price range.
Another way to circumvent this issue is to use weekly options which will allow us to trade a security up to the week before the report and then re-start the week after the report. Keep in mind that not all eligible securities have weeklys (shown in our “running list”) and the commissions will increase.
Alan
Hi Alan,
When writing covered calls, do I use the stock buy price or the current stock price? The current stock price is about $3.00+ above the bought price.
Thanks.
Giri
Giri,
If you own a stock in your portfolio, your covered call writing returns are based on the current price of the stock,. This will allow you to compare “apples-to-apples” when comparing this strategy to others. For tax purposes, on the other hand, original cost basis plays a significant role.
Alan
New seminar just added:
Northern New Jersey
Tuesday October 13th, 2015
6:45 to 8:30 PM
Milburn Public Library
FREE
The Basics of Covered Call Writing with a Brief Discussion of Put-Selling
Hi Alan
I have avidly read your great Complete Encyclopedia and totally enjoyed it. I received a comprehensive insight of the subject in a manner that provides me with a complete set of tools to become a successful independent covered call writer. And it is fun and entertaining to the last page.
As I see it today it is one of the best investments on education I have made in my life.
I also feel that the BCI Premium Membership is an excellent time-saving/value for money tool, and I am committed to join.
I have one question: when do you issue the weekly reports and watch lists? Melbourne time is 14 to 16 hours ahead of US ET. when it’s 9am Monday in NYC it’s 11pm Monday or 1am Tuesday in Melbourne. I am trying to figure out optimal trading times for me, without having to become a night owl!
Also, thanks to your help and suggestions, I was able to locate a convenient online broker-Interactive Brokers-which has a well developed branch in Australia and allows to trade in AU$.
Many thanks Alan, I hope to take part in one of your seminars and meet you in person one day
Kind Regards,
Paolo
Paolo,
Thanks for your generous remarks and for sharing this information. We have many of our international members using Interactive Brokers.
Our stock reports are published on the premium site over the weekend. We promise prior to market open on Monday but most reports are published late Saturday to mid-Sunday ET. My team begins formulating these reports once market closes at 4 PM ET on Friday.
Our ETF Reports are published mid-week, usually on Wednesday evenings ( anew one is coming out this evening) with data as of market close on Wednesday. We send out email notification to our premium members once these reports are uploaded to the premium site but you will have access to the site 24/7 so you can check any time. You will also have access to at least 4 additional reports in case you want to access previous reports as well.
It would be my pleasure to meet you in person at one of my presentations.
Alan
Premium members:
This week’s 6-page report of top-performing ETFs and analysis of ALL Select Sector Components has been uploaded to your premium site. The report also lists Top-performing ETFs with Weekly options.
For your convenience, here is the link to login to the premium site:
https://www.thebluecollarinvestor.com/member/login.php
NOT A PREMIUM MEMBER? Check out this link:
https://www.thebluecollarinvestor.com/membership.shtml
Alan and the BCI team
Hi Alan, I had 2 questions on the 28th that I just needed confirmation from my first questions, if you could please give me your helpful advise again. thanks