Rolling Down Our Put Positions: When and Why?
When selling cash-secured puts, our breakeven stock price is the (out-of-the-money) strike price less the put premium. Our exit strategy guideline as to when to close the short put (buy back the put) is when share value declines to more than 3% below the strike price. Once we execute the buy-to-close trade, we no longer are committed to an option obligation and the cash used to secure the put is now freed up to secure another put. Recently, Kevin C sent me an email asking why not routinely roll down when share price declines below the 3% threshold price? Rolling down is one of our standard exit strategy considerations when share price declines in our covered call positions so why not with puts? This article will address when and why to roll down with puts and scenarios when this is not our best choice using NetApp, Inc. (NASDAQ: NTAP) as a real-life example.
Initial put-selling trade with NTAP
- 12/18/2017: With NTAP trading at $58.50, sell the slightly out-of-the-money $58.00 put for $2.00
- Breakeven is $56.00 ($58.00 – $2.00)
- Threshold for 3% guideline to buy back the puts is below $56.26
- 1/2/2018: Share price declines to $55.32
Initial trade calculations using the single-column BCI Put Calculator
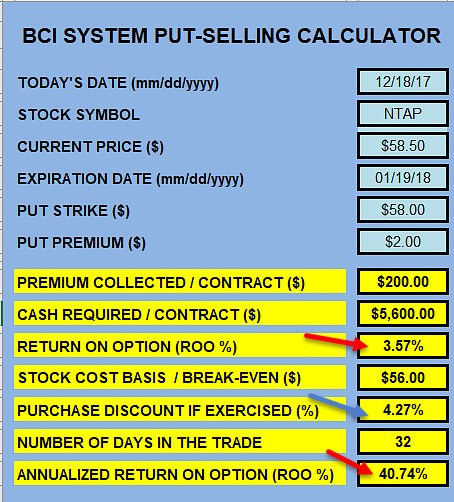
NTAP: Initial Put-Selling Calculations
Note the following information gleaned from the BCI Put Calculator:
- Initial 1-month time value (unexercised) return is 3.57% (40.74% annualized) a shown by the red arrows
- If the option is exercised, shares are purchased at a 4.27% discount from share price when trade was entered
Checking the option chain when closing the initial short put
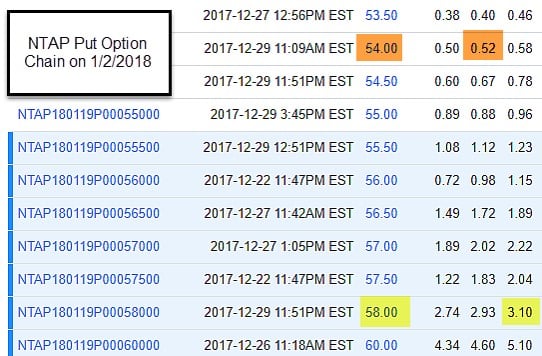
NTAP Put Option Chain on 1/2/2018
Note the following:
- The cost buy back the $58.00 put is $3.10 as shown in the yellow fields
- To roll down to the out-of-the-money $54.00 put strike we would generate $0.52 per share as shown in the brown fields
- If share price remains above the $54.00 put strike our net option loss is $0.58 per share ($2.00 + $0.52 – $3.10)
- Rolling down cuts the option loss almost in half ($1.10/$0.58)
Do we roll down routinely to mitigate losses when trades turn against us?
No. Although rolling down should definitely be in our exit strategy arsenal, there needs to be a thought process before making a decision to execute such a trade. With covered call writing, we own the underlying so to close a position in its entirety we would need to both buy back the option and sell the underlying. With put-selling, once we buy back the short put, we have no option obligation and do not own the underlying. Selling another option while early to mid-contract is a no-brainer, but using the same underlying is not. It is instructive to remember that the stock in question has already under-performed our expectations. Do we want to stay committed to this now under-performer? The guideline I use is a comparison of the recent performance of the stock compared to that of the S&P 500. Let’s have a look at a comparison chart of NTAP compared to the S&P 500 over the time frame of the trade to date:
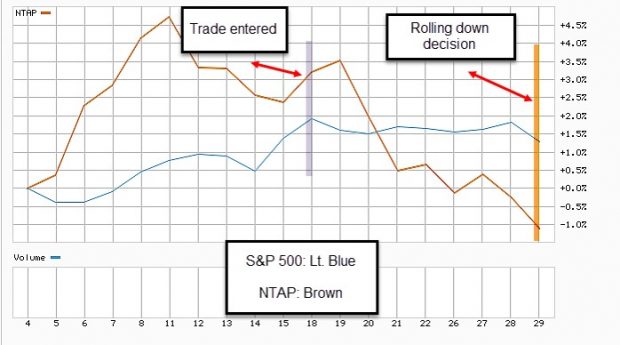
Comparison Chart of NTAP and the S&P 500
Note the following:
- When the trade was entered (purple bar), NTAP (brown line) was trading above the S&P 500
- On December 20th, there was a bearish movement of NTAP price movement to below that of the S&P 500
- On 1/2/2018 (gold bar), NTAP price continued to decline and remains under the price action of the S&P 500
- Had the price movement of NTAP remained above that of the S&P 500, I would strongly consider rolling down
- In a case like this one, I would reject rolling down and enter a new put sale with a different underlying to mitigate the current loss of $1.10 per share ($3.10 – $2.00)
Discussion
Rolling down a short put is part of our position management arsenal but should be mainly implanted in scenarios when declining share price is out-performing the overall market.
Ask Alan #148: Why is this Great-performing Stock No Longer Eligible?
A new Ask Alan video has been added to the Premium and Video Member sites. Only premium and video members have access to our entire library of (now) 148 Ask Alan videos. A new video will be added each month, all based on questions received from members of the BCI community.
Upcoming event
Chicago Stock Trader’s Expo: All Stars of Options
Sunday July 22nd 12:30 PM – 1:15 PM
“How to Select the Best Options in Bull and Bear Markets”
Hyatt Regency Hotel @ McCormick Place
2233 South Dr. martin Luther King Jr. Drive
Chicago, IL 60616

Our new book, Covered Call Writing Alternative Strategies and the 3 new calculators associated with the 3 strategies highlighted in this book (Portfolio Overwriting, The Collar Strategy, The Poor Man’s Covered Call) are now available in the BCI store. We are offering early-order discount promo codes for the book and the 3-calculator package through July 20th:
newbook5: $5.00 off the price of the new book ($27.00 – $5.00 = $22.00). The book will cost $35.00 when available on Amazon.com.
3calculators20: $20.00 of the price of the 3-calculator package ($79.00 – $20.00 = $59.00)
To receive both discounts, place 2 separate orders.
***Discount codes expire on July 20th
Covered Call Writing Alternative Strategies (new book)

-Portfolio Overwriting- using stocks in buy-and-hold portfolios
-The Collar Strategy- using protective puts
-The Poor Man’s Covered Call- using LEAPS options
Covered call writing is a cash-generating strategy that lowers our cost basis thereby improving our opportunities for successful investments. One of the many benefits of incorporating this strategy into our investment portfolios is that the system can be crafted to meet our trading style, market assessment, portfolio net worth and personal risk tolerance. This book details three such covered call writing-like strategies that will highlight:
-Option basics
-Practical application
-Calculations
-Real-life examples
-Role of brokerages
-Pros and cons of strategies
-Option Greeks
-Exit strategies
-Flow charts
-Calculator user guides
-And much more
The Calculator Package includes:

3 spreadsheets:
-PMCC Calculator
-BCI Collar Calculator
-BCI Portfolio Overwriting Calculator
These calculators are designed to determine initial trade structure and status as well as various position management price point considerations the exit strategy price buyback points to buy back the short calls based on the 20%/10% guidelines detailed in the BCI books and DVD Programs.
Book information: Promo code: newbook5
Calculator package information: Promo code: 3calculators20
***Discount codes expire on July 20th
Market tone
This week’s economic news of importance:
- Consumer credit May $25 billion ($10 billion last)
- Job openings May 6.6 million (6.8 million last)
- Producer price index June 0.3% (0.2% expected)
- Wholesale inventories May 0.6% (0.1% last)
- Weekly jobless claims 7/7 214,000 (226,000 expected)
- Consumer price index June 0.1% (0.2% expected)
- Core CPI June 0.2% (as expected)
- Import price index June-0.4% (0.9% last)
- Consumer sentiment index July 97.1 (98.9 expected)
THE WEEK AHEAD
Mon July 16th
- Retail sales June
- Business inventories May
Tue July 17th
- Industrial production June
- Home builders’ index July
Wed July 18th
- Housing starts June
- Building permits June
- Beige book
Thu July 19th
- Weekly jobless claims through 7/14
- Philly Fed July
- Leading economic indicators June
Fri July 20th
- None scheduled
For the week, the S&P 500 moved down by 1.50% for a year-to-date return of 4.78%
Summary
IBD: Market in confirmed uptrend
GMI: 6/6- Bullish signal since market close of July 9, 2018
BCI: Using an equal number of in-the-money and out-of-the-money strikes. Tariffs and global relationships are concerns. Anticipating another favorable upcoming earnings season.
WHAT THE BROAD MARKET INDICATORS (S&P 500 AND VIX) ARE TELLING US
The 6-month charts point to a neutral to bullish tone. In the past six months, the S&P 500 was up 0% while the VIX (12.17) moved up by 5%.
Wishing you much success,
Alan and the BCI team


Alan,
Questions from your new book:
1. How do we monitor calls and put strike prices on a daily basis for collar trades in order to initiate an appropriate exit strategy based on 20/10% guidelines?
2. Schedule D – We use schedule D to calculate profit or loss on covered calls. How do we work out the final return on collar trades for all the scenarios in schedule D?
Thanks,
Duminda
Duminda,
1. The short call is the active leg of the collar trade as it relates to exit strategies. The BCI Collar Calculator automatically computes the short call buyback points when the initial structuring information is entered as shown in the screenshot below. This can be managed automatically after the initial trade is entered. For example, if the short call is sold for $2.00, the spreadsheet will show buyback points of $0.40 (20% guideline) and $0.20 (10% guideline). After entering the trade, we can set a limit order to buy-to-close the short call at $0.40 and change to $0.20 midway through the contract. Short calls will be closed automatically if the thresholds are reached. Then we can decide next steps based on our exit strategy arsenal. The red arrows in the screenshot show 20% buyback points and the blue arrows show the 10% buyback points.
2. Schedule D from the Elite version of the Ellman Calculator:
Final returns are computed by entering a net credit (call premium – put premium) instead of just the call premium. Adjustments can be made if the put is sold:
[(call premium – put premium) + put premium]
CLICK ON IMAGE TO ENLARGE & USE THE BACK ARROW TO RETURN TO BLOG.
Alan
Alan,
Like a kid waiting for Christmas I can not wait for your and Barry’s new book to arrive!
As a hobbyist who loves this blog interacting with the nice people here I would like to add an extra emphasis to the point you made above about constant comparison to the S&P (SPY).
I worked for a big company. We had scorecards and metrics for everything – probably too many :)! To me in this game the only relevant benchmark is “am I beating SPY on a consistent basis?” Because if not plowing my retirement egg into SPY and doing something else would be more beneficial!
I am not talking day to day or week to week. But on a monthly basis I find it helpful to measure how I am doing against SPY and think about any fine tuning I need to make. I hold TLT and GLD over writing them most of the time just for portfolio diversification. I carve them out and look at pure stock holdings and options trades to see how I do.
In my case the results when I started doing that were eye opening, They led me to trade less, hold fewer positions, turn them over less frequently, don’t sell calls on everything and use large caps and index ETF’s for option selling letting my hot stocks run for the roses!
There is a balance out there somewhere to fit each of us we can only find through experience. – Jay
Jay,
I agree with you. I have always compared my pro-active returns versus those I could achieve from a broad-market, low-expense ration index fund. If I couldn’t consistently beat the index, why bother with active investing? Well, it’s been over 2 decades and there still hasn’t been a year when I haven’t out-performed the S&P 500, many years significantly.
Option-selling, or any other strategy for that matter, is not for everybody. But for those who embrace these strategies, our goal is to continue to provide information and a forum to assist retail investors in elevating those return to the highest possible levels.
My team and I also want to thank you for your valuable contributions to our blog.
I hope you enjoy and benefit from our new book.
Alan
Thanks for your always kind words, Alan.
Like watching a pot boil where is that damn mail man when you are waiting on him :)? I am conversant on portfolio over writing but look forward to getting smart about collars and PMCC’s adding them to my tool box.
I started selling options in 2013 after reading your original Encyclopedia and retiring that year. I set up two main accounts: one I would trade actively and one I would invest passively using index funds.
You will recall 2013 was a banner year for the S&P. My passive account clobbered my active account. But I was new to the game. My exit strategy and position management skills were lousy – in fact non existent. I just pouted as high flying stocks got called away for less than market price month after month.
That’s when I knew I needed to do more homework, pay more attention and really master exit strategies and position management. I was doing what the covered call ETF’s do: just buy stocks, sell calls, and let it all expire. Those funds rarely beat the index.
With the help of you, Barry this community and better study at my end I am happy to report my active account now consistently out performs my passive one! Hope everyone has a pleasant week and successful close out of the July expiry. – Jay
Hi Jay,
I am happy to hear that you are beating the S&P consistently.
Congrats. It is a huge feat.
Funny thing is I never even check the relationship between my portfolio results as compared to the S&P.
I am not in a competition.
I guess each investor has his parsonal goals.
My personal goals are 4 :
FIRST – I do not want to lose my hard earned money.
SECOND – I wish to get a better yield than mutual funds offer us.
THIRD – I want to see my yearly graph going steadily up, from the lower left corner to the upper right corner.
AND LAST, but not least, have fun while doing it every day.
Roni 🙂
Hey Roni,
When you achieve your 4 goals you will beat the S&P even if by “accident” :)!
I find SPY a useful yard stick to measure myself against to make sure all this trading is worth the fuss :). – Jay
Jay,
I know that you are right, and Alan agrees.
So I will start watching the S&P too.
Roni
Hey Roni,
An easy way to follow both SPY and QQQ – my two favorite indexes – is to save them on Yahoo Finance and check them using the chart feature every day. Click to have the 50 and 200 day moving averages show.The MACD always shows below.
At the moment the market looks rosy but beware the Ides of August and September :)! – Jay
Thanks Jay
Hey Jay,
you are right again.
I did the calculations, and if they are correct, the S&P is up aprox. 14% in the last 12 months.
My total market value today is up 18% in the last 12 months. 🙂
let’s see how I do in the next 12 months.
Good stuff, Roni, way to go!
Nice numbers, Roni. Something to smile about!
Mario
Mario and Jay,
thank you.
Roni
Premium Members,
This week’s Weekly Stock Screen And Watch List has been uploaded to The Blue Collar Investor Premium Member site and is available for download in the “Reports” section. Look for the report dated 07/13/18.
Also, be sure to check out the latest BCI Training Videos and “Ask Alan” segments. You can view them at The Blue Collar YouTube Channel. For your convenience, the link to the BCI YouTube Channel is:
http://www.youtube.com/user/BlueCollarInvestor
Since we are in Earnings Season, be sure to read Alan’s article,”Constructing Your Covered Call Portfolio During Earnings Season”. You can access it at:
https://www.thebluecollarinvestor.com/constructing-your-covered-call-portfolio-during-earnings-season/
Best,
Barry and The BCI Team
barry@thebluecollarinvestor.com
Premium Members,
The Weekly Report for 07/13/18 has been revised and uploaded to the Premium Member website. Look for the report dated 07/13/18-RevA. The reason for the revision is that we received updated risk/reward data today.
Two stock pass/fail decisions were impacted. Both BIDU and ZTO went from “Pass” to “Fail”
Best,
Barry and The Blue Collar Investor team
Hello Dr. Ellman
I’m doing some writing covered calls. One on VSH and another on KR. I’m out of the money on VSH August 17th expiration at 25 strike. I bought the stock 100 share and sold the covered call for .85 at one contract. Hopefully it will hang in there. I have a buy working order .10 if it goes South to roll out.
On the KR, I bought 100 share at 27.80 and the next morning with beta a .68, I sold July 20 call at 28 strike in the money for 1.98. It’s looking good so far and if it goes South I have a working order in for .20. Hopefully the KR and VSH will bring on 400 dollars.
I’ve been a premium member now for a couple weeks and read up on everything. Hopefully I’ve made myself clear. If you see something wrong like my concern is VSH earnings report in August let me know. I slipped on that one.
Don from Lexington KY.
Don,
As of market close today, both strikes are in-the-money…congratulations. Now, VSH is scheduled to report on 8/7 so to avoid the risk of a disappointing report, the short call and long stock positions should be closed prior to the report.
Alan
Alan,
In the past, you have said that it’s okay to own a stock through and earnings report and then write the call after the report passes. When would this be a consideration?
As always, thanks for your response.
Marsha
Marsha,
Holding a stock through an earnings report represents heightened risk, pure and simple. It is not part of traditional covered call writing in our BCI methodology. However, I realize that in a practical sense, there may be stocks we particularly like and want to retain in our ccw portfolios. In these cases, we write the call after the report passes or use Weeklys when available.
This may be a consideration for stocks that historically have had positive surprises, usually due to muted guidance given in the previous earnings release. Over the long haul, we will see more positive surprises than negative ones because corporations do not want to disappoint their investors. When the upcoming report looks bleak, the Board of Directors may pre-announce the bad news and hope for a positive response to the actual report…the games corporations play!
So, if our personal risk-tolerance is such that we are willing to take on the earnings report risk and if the company has a history of positive surprises, holding a stock through an earnings report is a consideration. These should be kept to a minimum.
Alan
GPS has been removed from our “banned” stock list as it no longer report same store sales on a monthly basis.
Alan
Premium members:
This week’s 8-page report of top-performing ETFs and analysis of ALL Select Sector Components has been uploaded to your premium site. The report also lists Top-performing ETFs with Weekly options as well as the implied volatility of all eligible candidates.
New members check out the video user guide located above the recent reports.
For your convenience, here is the link to login to the premium site:
https://www.thebluecollarinvestor.com/member/login.php
NOT A PREMIUM MEMBER? Check out this link:
https://www.thebluecollarinvestor.com/membership.shtml
Alan and the BCI team
DISCOUNT CODES EXPIRE THIS FRIDAY:
I want to issue a final reminder to our members that the early-order discount codes for my new book, “Covered Call Writing Alternative Strategies (co-authored by me and Barry Bergman) and the 3 new calculators associated with the strategies detailed in the book are expiring this Friday.
Link to new book:
https://thebluecollarinvestor.com/minimembership/covered-call-writing-alernative-strategies/
Use discount code: “newbook5” for a $5.00 discount.
Link to 3-calculator package:
https://thebluecollarinvestor.com/minimembership/calculator-package/
Use discount code: “3calculators20” for a $20.00 discount.
To take advantage of both discount codes, enter the orders as 2 separate orders as the site only accepts 1 discount code at a time.
I hope you enjoy and benefit from our new educational products.
Alan and the BCI team
I really like your service. Unfortunately, some of my covered calls have increased far above the strike price and others have lost money. I also made a couple of accidental mistakes. However, I am fine-tuning my trading, and I am optimistic about next month.
Thanks,
Al
Al,
Let me share with you my philosophical view of scenarios you are describing. If we buy a stock for $48 and sell the $50 call for $1.50, our maximum 1-month return is $1.50 (option premium) + $2.00 (share appreciation to the strike). If achieved, the maximum 1-month return would be 7.3%. This max return is realized whether the stock price ends at $50 or $150.00 per share. We are not losing money but rather achieving our maximum return.
Covered call writing should consistently out-perform the overall market because we are lowering our cost basis when selling the options.
Continued success,
Alan