Our stock options strategies have a new product to consider: mini options. These options have a deliverable 10 shares of underlying security instead of the traditional 100 shares. The options symbol for these minis begin with the security ticker followed by the number 7:
- AAPL7
- AMZN7
- GOOG7
- GLD7
- SPY7
The 5 securities above are the only ones currently available with mini options although many more will follow. These new products allow average retail investors to sell covered call options without having to layout huge sums of money to purchase the underlying shares. For example, to sell 1 covered call option for Apple Computer would require us to invest over $50,000 to enter the long stock position. With minis that investment would be reduced to $5,000.
My initial concern, as with the introduction of all new products, is the liquidity of trading and how that impacts the bid-ask spreads. My second, specifically with minis, is the question of commissions. Will the brokerages reduce commissions since the per share amount would be 10x greater if they didn’t…they didn’t. In today’s article I will use Apple Computer to demonstrate the impact that lower liquidity, higher bid-ask spreads and higher per share commissions have on our annualized returns. At the time that I am writing this article AAPL was trading @ $545.78 and the March, 2014 monthly contracts were 5 weeks away from expiration. Here is the options chain for the traditional monthly contract with 100 shares deliverable:
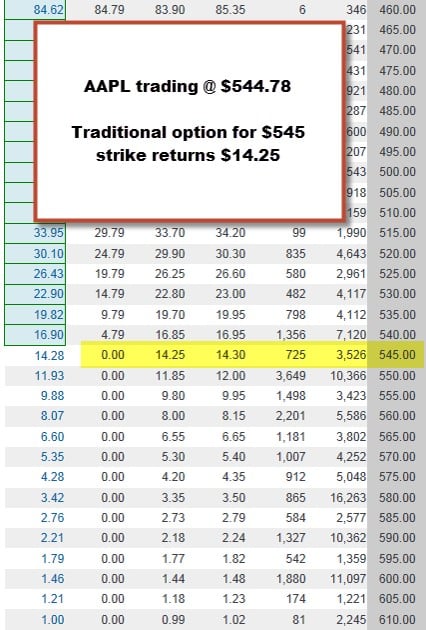
AAPL traditional contract
Please note for the near-the-money $545 strike:
- High open interest of 3,526 contracts
- Tight bid-ask spread of $0.05 ($14.25 – $14.30)
- Premium generated from sale of a covered call is $14.25 per share
Next, let’s take off our shoes and socks and do some math per contract:
- ROO (before commissions) = $1425/$54,478 = 2.62%, 5-week return
- ROO (after a $10 commission) = $1415/$54,478 = 2.60%, 5-week return, 26% annualized
- Commission resulted in a return reduction of 0.02%
***ROO = initial return on option or initial profit
Next, let’s have a look at the options chain for the minis, also for March, 2014 expiration with 10 shares deliverable:
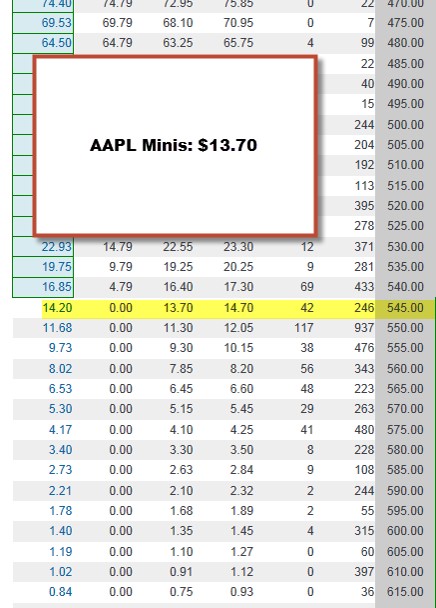
AAPL mini options chain
Please note for the near-the-money $545 strike:
- Significantly lower open interest of 246 contracts
- Much wider bid-ask spread of $1.00 ($13.70 – $14.70)
- Premium generated from sale of a covered call is $13.70 per share, $0.55 less than the traditional option
Next, let’s calculate:
- ROO (before commissions) = $137/$5447.80= 2.51%, 5-week return
- ROO (after a $10 commission) = $127/$5447.80 = 2.33%, 5-week return, 23.3% annualized
- Commission resulted in a return reduction of 0.18%
Annualized difference in returns:
- Traditional: 26%
- Minis: 23.3%
- Traditionals outperform minis by 2.7%
AMZN stats:
I then ran the same process using AMZN as the underlying when the stock was trading @ $357.20 and looking at the $360 strike for both the traditional and mini options. The result was even more significant with the traditionals out-performing the minis by an annualized rate of 4.7%
Conclusion:
Using the mini options at the current time will allow us to take positions in the 5 securities with a much lower cash investment. However, the returns will suffer because of the impact of commissions and wider bid-ask spreads due to lower option liquidity. I do believe that this liquidity will increase as time goes by, thereby decreasing bid-ask spreads and perhaps brokerages will lower commissions for these products. In the interim, choosing other underlying securities that will generate higher returns may be the prudent approach.
Live seminars coming up in March:
NEW YORK
Long Island Stock Traders Investment Group
Monday, March 10th
6:45 PM – 9:30 PM
Plainview Old Bethpage Library
999 Old Country Rd, Plainview, NY
FLORIDA
Delray: March 18, 2014
Fort Lauderdale: March 19, 2014
http://www.aaii.com/localchapters/pdfs/Southeast%20Florida%20140318.pdf
Webinar in March:
E-Money Show webinar
March 25th DATE CHANGE TO APRIL 22nd.
3:20 – 4:20 PM ET
Link to register will be posted on this site once we receive it from The Money Show
Market tone:
Although I study the economic reports each week and summarize them for you in these blog articles, I am going to partially ignore the negative tone to this past week’s series of reports. That is because many were adversely impacted by the severe weather conditions which I consider an aberration:
- The minutes from last month’s Fed meeting reiterated that the Fed would not raise short-term interest rates until unemployment fell far below 6.5% as long as inflation remains below 2.0%
- The Conference Board’s index of leading economic indicators (a composite index of ten economic indicators that typically lead overall economic activity. The index includes indicators such as housing permits, new orders for consumer goods, consumer expectations, and performance of the S&P 500 Index) rose by 0.3% in January due to strength in the financial sector and declining jobless claims. This continues to reflect an economy expanding at a moderate pace
- The Producer Price Index (PPI- a measure of what businesses receive for goods and services) rose by 0.2% in January, more than the 0.1% expected, due to weather-related increases in natural gas. This was 1.2% more than a year ago
- The Consumer Price Index (CPI- a widely followed indicator of inflation. The CPI is a measure of the average change over time in the prices paid by urban consumers for a fixed market basket of consumer goods and services. The “core” CPI excludes food and energy prices, which account for roughly one-quarter of the broad CPI and tend to fluctuate widely, providing a truer reflection of inflationary trends) rose by 0.1% in January (as expected) due to higher energy costs
- Consumer inflation increased by 1.6% year-over-year
- New home construction declined by 16.0% in January, the largest drop since February, 2011
- Housing starts are down 2.0% from a year ago
- Housing permits dipped by 5.4% in January
- The sale of single-family homes declined by 5.1% in January, the lowest level in the past 18 months
- Inventory levels rose by 2.2% in January to 4.9 months of supply
- The median price of existing homes rose to $188,900 in January up 10.4% from a year ago
For the week, the S&P 500 declined by 0.1%.
Summary:
IBD: Confirmed uptrend
BCI: Cautiously bullish, favoring out-of–the-money strikes 3-to-2
My best to all,
Alan (alan@thebluecollarinvestor.com)
www.thebluecollarinvestor.com
Premium Members,
The Weekly Report for 02-21-14 has been uploaded to the Premium Member website and is available for download.
Also, be sure to check out the latest BCI Training Videos and “Ask Alan” segments. You can view them at The Blue Collar YouTube Channel. For your convenience, the BCI YouTube Channel link is:
http://www.youtube.com/user/BlueCollarInvestor
Best,
Barry and The BCI Team
To roll or not to roll with AGN: recent Q&A with Jon:
This past Friday, AGN was trading @ $125.07 and Jon had sold the $120 February call:
Price: 125.07
“Negotiating” bid-ask prices as detailed in my books/DVDs should get you better returns than the worst case scenarios I am presenting here:
BTC Feb 120 call @ 5.20
Shares are worth 120
STO March 120 call @ 6.50
Net credit = 1.30 = 1.1%, 1-month return with 4.1% downside protection
STO March 125 @ 3.60
Option debit of (-)1.60
Share value appreciates $5 (120 to 125)
Net credit is 3.40 = 2.8% with negligible downside protection of this profit and no upside potential
If either of these returns meet your goals, then you should roll. If not, allow assignment.
Alan
Have a plan before you enter any trade. If its a CC decide if you are looking to be assigned or are you looking to get a credit off the stock you own month after month. If you looking for monthly income and want to keep the stock roll the position a lot sooner.
Greg
Premium Members:
This week’s Weekly Stock Screen And Watch List has been revised and uploaded to The Blue Collar Investor premium member site and is available in the “Reports” section. The typos in the first few stocks in the “Mixed Data…” section have been corrected.
Look for the report dated 02-21-14-RevA.
For your convenience, here is the link to login to the premium site:
https://www.thebluecollarinvestor.com/member/login.php
Best,
Barry and the BCI Team
CBM: Calculations:
One of our premium members, Daniel, asked me about the calculations for CBM, a stock on our current running list. Below is a screenshot I created showing the 1-month calculations using the multiple tab of the Ellman Calculator. CLICK ON IMAGE TO ENLARGE AND USE THE BACK ARROW TO RETURN TO BLOG.
Alan
Dr. Eric Wish article: Selling weeklys on GLD:
http://wishingwealthblog.com/
Professor Wish teaches a finance class @ The University of Maryland and wrote the foreword for my most recent book, “Stock Investing For Students” A link to his excellent website is located on the right side of this blog page.
Alan
Alan this is exactly what I was looking for thanks so much… just one question…
is there another way of doing this on just one transaction and one commission instead of having to pay twice something like a vertical kind of?
Adrian
Adrian,
Yes, many brokerages have “buy-write combination forms” where a stock is purchased and an option sold simultaneously. The trade is best executed using a “net debit limit order” For example, if you buy a stock @ $29 and sell the $30 call for $1, we enter the trade as a net debit limit order of $28. This means we will pay $28 ($2800 per contract) or less + commissions to execute the trade.
The caveat here is that many times we will find ourselves executing only one leg of the trade as we execute exit strategies as detailed in my books/DVDs. So it’s important to learn “legging in” as well. A free file of online discount brokers is found on the top black bar of this website in the “free resources” link.
Alan
Alan,
Thanks for the link to Dr Eric Wish’s website. I spent a few hours last night reading and found it informative and educational in the sense that is has broadened my understanding of how to look at the overall market. In particular I like his GMI indicator, interesting idea, but he’s got lots of other ideas too that made me think (RWB rocket patterns, etc). He has a somewhat different perspective than what I am comfortable with but none-the-less it’s good to see different perspectives.
Dave,
I agree, a great site. Dr. Wish and I will be presenting a dual seminar in Arlington, Virginia on July 19th hosted by the Washington DC Chapter of The American Association of Individual Investors. I’m really looking forward to this event.
Alan
Premium members:
This week’s 8-page report of top-performing ETFs and analysis of ALL Select Sector Components has been uploaded to your premium site. The report also lists Top-performing ETFs with Weekly options as well as the implied volatility of all eligible candidates.
For your convenience, here is the link to login to the premium site:
https://www.thebluecollarinvestor.com/member/login.php
NOT A PREMIUM MEMBER? Check out this link:
https://www.thebluecollarinvestor.com/membership.shtml
Alan and the BCI team