When selling call and put options, the liquidity of these securities must be evaluated to determine their eligibility. There are two measures of investor interest in options, Vol(ume) and Open Interest (OI). Vol represents the number of times a particular contract is bought or sold in a particular day. Open interest, on the other hand, represents the number of contracts that are currently outstanding (unexercised, not closed by an offsetting contract or not yet expired). Open interest stats are cumulative and not reset to zero each day as are Vol stats. Therefore, it makes sense that open interest will (almost) always be higher than Vol stats.
Location of OI in an options chain

Facebook Options Chain: May, 2016
There is no way of knowing the amount of open interest contracts represented by buy or sell orders.
Why is OI important?
When options have large open interest we know that there are a significant number of buyers and sellers and a robust secondary market increasing the odds of a favorable price execution for our options. This is why we use a guideline of a minimum of 100 contracts of OI and/or a bid-ask spread of $0.30 or less when evaluating the eligibility of options.
How is OI calculated?
When options are bought or sold they can be an opening or closing transaction. Open interest is calculated at the end of a trading day by the Options Clearing Corporation (OCC)after pairing opening and closing positions. The screenshot below shows how these calculations are done per contract:
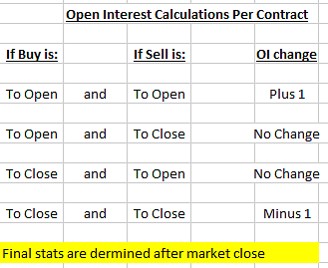
Calculating Open Interest For Options
Discussion
Evaluating option liquidity is essential for all option traders. Open interest has the advantages over Vol(ume) in that it is a cumulative stat (not reset daily as is VOL) and provides a window into the extent of the secondary market for a specific option. OI calculations depend on whether buyers and sellers are opening or closing positions.
Upcoming live events
September 10th, 2016
Silicon Valley (San Francisco) California
8:30 AM – 12 PM
I am the 2nd of 2 speakers
Registration and information link
September 29th, 2016
9 PM ET
Blue Hour webinar 2: “Using Put Options to Buy and Sell Stock”
FREE to premium members and available for purchase to general members
Registration links and more information to follow
October 17th, 2016 (originally 10/24)
Austin, Texas
Registration link to follow
November 5, 2016
Plainview, New York
Saturday morning 3-hour workshop at the Plainview Holiday Inn. I am the only speaker and plan an information-packed presentation covering 5 actionable ways to make money or buy a stock at a discount using both call and put options. Discounted fee through 8/31/16.
Save the date: Our next Blue Hour webinar, FREE to all Premium Members, will be broadcast on 9/29/2016 at 9 PM ET. The topic is Using Put Options to Buy and Sell Stock. This a new presentation which will be presented for the first time on September 29th. Registration will open in a few weeks. You will receive notification.
Premium members: Blue Chip Portfolio
Based on the recent premium member survey many of you responded to, there is an interest in a report specifically geared to blue chip stocks for option-selling strategies. The BCI team is considering adding an additional quarterly report where we screen the 30 Dow Jones Industrial stocks for price performance in 3-month and 1-year time frames and select those that have out-performed the S&P 500 in both screens.
The report will include price at the time of report publication, % returns in both time frames, earnings report dates, dividend yield and ex-dividend date information.
I have placed a draft of this report in the “Resources/downloads” section of the member site (right side of page). Scroll down to “B”…Blue Chip Report: 8-2016. Let us know your thoughts to help us to decide if we will be adding this report to our member benefits package (at no additional membership charge). Thus far the feedback has been extremely positive.
Send your feedback to:
info@thebluecollarinvestor.com
Market tone
Global stocks were flat on the week, with many investors waiting for US Federal Reserve Chair Janet Yellen’s remarks from Jackson Hole on Friday morning. The Chicago Board Options Exchange Volatility Index (VIX) rose to 13.65 from 11.8 a week ago. Crude oil fell to $47.65 from $48.00 a week ago. This week’s reports and international news of importance:
- Speaking at the Federal Reserve Bank of Kansas City conference in Jackson Hole, Wyoming, Fed chair Yellen prepared markets for a hike in the federal funds rate perhaps as early as the next Federal Open Market Committee meeting in September, depending on the outcome of next Friday’s US employment report. Markets are assuming a hike by the end of 2016
- A poll of more than 7,000 German businesses saw a decline in confidence among those surveyed. The Ifo index fell to 106.2 in August versus 108.3 a month earlier, the steepest fall in more than four years. The weakening sentiment was blamed on a delayed reaction to the UK’s June Brexit vote
- Sales of new homes in the US surged 12.4% in July to the highest level since October 2007, and 31% compared with a year ago
- However, sales of existing homes, which outnumber new home sales by a factor of eight, fell 3.2% in July
- 2nd quarter US GDP was revised modestly lower, to an annual rate of 1.1% from an initial 1.2% reading
- The US trade deficit shrank in July to $59.0 billion from $63.3 billion in June
- Durable goods orders were surprisingly strong, rising 4.4% in July versus a consensus estimate for a 3.7% rise. Core capital goods orders rose a robust 1.6%
- UK Consumer sentiment rebounded strongly in August, more than reversing the post-Brexit shock from July, jumping to 109.8 from 106.6. The rise was the largest in over three years
- A week ago, the oil market rallied on hopes for an OPEC production cap. This week, OPEC member Iraq said it will boost production by 150,000 barrels per day, or roughly 5% of output
- Urjit Patel was named this week to succeed Raghuram Rajan as the new governor of the Reserve Bank of India. Patel was deputy governor in charge of monetary policy prior to his appointment to the top spot, and is well known to the markets
- Credit rating agency Standard and Poor’s downgraded its outlook for Mexico’s sovereign debt rating this week, citing disappointing economic growth and a rising debt load
THE WEEK AHEAD
- The US reports personal income and spending and the core personal consumption expenditures price index, the Fed’s preferred inflation measure, on Monday, August 29th
- The eurozone economic sentiment index is released on Tuesday, August 30th
- The harmonized index of consumer prices for the eurozone is released on Wednesday, August 31st
- Global manufacturing purchasing managers’ indices are released on Thursday, September 1st
- The US August employment report is released on Friday, September 2nd
For the week, the S&P 500 declined by 0.68% for a year-to-date return of +6.12%.
Summary
IBD: Uptrend under pressure
GMI: 6/6- Buy signal since market close of July 1, 2016
BCI: Moderately bullish favoring out-of-the-money strikes 3-to-2
WHAT THE BROAD MARKET INDICATORS (S&P 500 AND VIX) ARE TELLING US

Premium Members,
This week’s Weekly Stock Screen And Watch List has been uploaded to The Blue Collar Investor premium member site and is available for download in the “Reports” section. Look for the report dated 08/26/16.
Also, be sure to check out the latest BCI Training Videos and “Ask Alan” segments. You can view them at The Blue Collar YouTube Channel. For your convenience, the link to the BCI YouTube Channel is:
http://www.youtube.com/user/BlueCollarInvestor
Best,
Barry and The BCI Team
Alan, From what I know now off your headlines the FED was contemplating on whether to raise interest rates soon.
What I wondering is when there is going to be news of a possible interest rate rise(or decline), then should I be more conservative by closing-out positions in stocks from those sectors that would likely be affected when rates may rise(decline)?
Or would you think it may be better to buy protective put options instead?
(I have 2 rolled-out ETF’s of GDXJ and XME which have both fallen quite a bit down to support levels. These are in a sector don’t benefit when rates rise. If had I known at the August expiry the consequences of interest rates on this particular sector, then my probable decision would have been to buy puts on both these 2 ETF’s for the protection.)
Do you have any idea what things I can do at this moment for these trades.(I have so far only bought back the GDXJ option)?
Your advise is much appreciated. Thanks
Mike,
Last week, Janet Yellen spoke about a strengthening of economic indicators making a rate hike likely by the end of the year, perhaps even in September. Now we’re talking 25 basis points so although there may be an initial over-reaction, things should settle after that. If not the Fed watch than there will always be some other event that we have an eye on.
Regarding what to do after buying back an option (in general), we have some choices:
1- Wait for a recovery to sell the same option (“hit a double”). This is favored earlier in the contract
2- Roll down (2nd half of contract)
3- Sell the security and put the cash into a different security (when significantly under-performing)
There are still 3 weeks to expiration of the September contracts so we can anticipate lots of price movement. The direction of that movement will dictate which position management track we take. Non-emotional decisions should rule the day.
Alan
Alan,
Just wondering if your approach is to first wrtie a Put and then if assigned, write a Covered Call. Or do you just start off by doing Buy-Writes. I din’t see any info on Put writing so I was just wondering what your preferred approach is.
Thank you for your time and the many free tutorials. I have already recommended your veryy useful website to others.
Changis
Changis,
Both are great strategies. My go-to strategy is covered call writing. I have been successful with this strategy for more than 2 decades. I do use cash-secured puts when I look to buy a stock at a discount in lieu of limit orders and in a bear market environment, I will sell a put to enter a covered call trade (PCP strategy).
See pages 231 – 237 in my book, “Selling Cash-Secured Puts” for more information on this strategy.
Alan
Alan:
A quick question:
Last week I placed positions in stocks and sold calls based on the report issued last Sunday. This week’s report shows several of those positions failed this week’s report. Should I stick with these positions until or unless they reach the 20-10%? If the options are purchased following the rules should the stock be sold or held? Sorry it was two questions.
Thanks,
Larry
Larry,
Once a position is entered, it is managed as per our exit strategy arsenal described in my books, DVDs and videos, not based on its disappearance from of premium stock list. Certainly, if we need a replacement stock mid-contract, it should be selected from our most recent list. The 20/10% guidelines are extremely important. Appropriate action is an asset, over-reaction is not.
Alan
As Charles Dicken’s would have said: these are the best and worst of times for options sellers. Premium is low but more consistent.
Interest rate discussions dominate 24 hour news dulling minds with the same ceaseless repetition as the Presidential election.
it is understandable, if not tempting, to go to cash. Then come back around Thanksgiving to get a seasonal bounce after whatever rate hike and election shock may or may not occur.
But big corrections do not happen when retail guys like me are cautious :). They happen when I am ebullient! Legend has it Joseph Kennedy Sr. sold all his stocks avoiding the 1929 crash when he got a stock tip from his shoe shine boy!
So what to do between now and Thanksgiving? I suggest nothing dramatic. If you have large gains in an IRA take some. Hold the cash for later. If you are selling monthly covered calls take note Alan is now ratcheting down his strike mix.
The search for yield drove utilities, staples and telecom this year. Those are good places to take profits or sell in the money calls. Buy some Tech. Let it run half covered.
Healthcare/Bio is a political hot potato. But a demographic gem for longer term investing. Sell ITM against current holdings until after the elections. Buy coal and oil stocks if you think Trump will win. That is my two cents, anyway….
Hope everyone has a great week. – Jay
Hi Jay
Thank you for these interesting observations. I am always eager to learn.
To stay away from the game until Thanksgiving is really no fun.
Also you would be missing many oportunities to generate income.
Betting on elections outcome is always a gamble.
The way I remember the story, Kennedy sold all his stocks when the shoe shine boy told him that he was investing in the stock market. This piece of information made him realize that everybody was insane, and therefore the market would crash.
I do not believe that we are in such a buble today, and also, I only have a relatively small portion of my holdings in this fascinating endeavour.
Roni
Hey Roni,
Thanks for the kind reply! Hope all is well with you.
I agree it’s never fun to be out of the market. There are always ways to flex strikes, exit strategies, etc.. I am just having a tough time getting conviction to enter new positions against the background noise of the season.
I should learn to tune that out. It’s always there.
The major indexes are above moving averages. The Fed won’t do anything dramatic. They are talking about new stimulus tools. Elections will be what they will be.
You are likely on the best track with reasonable allocations. Jay
All is well Jay, thanks.
Brazil’s economy can recover, now that the communists are finally gone from power.
Roni
Mr. Ellman,
I am re-reading segments of your book on covered calls and have several questions that may have been answered somewhere in your book, but I missed it.
1. What is the definition of mixed technicals?
Not sure if you mean the MACD going down while the STO is going up, or both of these headed in the opposite direction of the 20 & 100 EMA.
Or something else entirely.
2. On p. 133 prior to rolling out and up it stated we are obligated to sell our shares @ $80 – why? Would seem comparative basis in the stock would be then be $8,300, if we sold the stock.
3. Also, is the Delta utilized to determine which way the market is headed / leaning?
Thank you for all of your help.
Larry
Larry,
My responses:
1- Mixed technicals (to me) is when moving averages are neutral to bullish but one or more of the momentum indicators (MACD, Stochastic oscillator) are showing bearish signals.
2- Prior to rolling the option, the $80.00 call obligation is still in place.
3- I do not use Delta to make my overall market assessment but rather :
Chart of S&P 500
Chart of VIX
Evaluation of weekly economic reports
GMI Index (Dr. Wish’s indicator)
Alan
Alan,
Was wondering if you ever did an article on investing in the Stock Market versus Real Estate (rental property)?
I know you invest in Real Estate so I would be interested in your perspective in comparing the 2.
For instance…If someone has $100K to invest, they could utilize the Blue Collar system to conservatively earn 2-3% per month ($2000-$3000). You could also use the 100K and purchase rental property (maybe 1 or 2 with some leverage), but I don’t think the rental income would generate the 2-3% per month…I may be wrong. I realize there are other benefits with RE (tax deductions, depreciation, so on), as well as some headaches.
So with everything in life there are trade-offs,and I was wondering with your experience if your ever touched on this topic.
Thanks! Enjoy your Site!
—Gary
Gary,
Years ago, I wrote about real estate because it was such a big part of my life with both commercial and residential properties in several states in the US. I do believe in asset allocation but my favorite investment strategy by far is covered call writing. That’s the world where I spend most of my investment time now although real estate does have a presence. I do not consider myself an expert in real estate although I have a good amount of experience in this arena. That’s why I don’t write about it in this venue and no longer accept speaking requests related to real estate. For old times sake, here is a link to an article I wrote almost 10 years ago:
https://www.thebluecollarinvestor.com/commingling-of-asset-classes-plus-history-tells-us-not-to-worry/
Alan
I’ve been doing this for the last 5 months and have averaged a 24% return (annual). This is better than the .0000000001% I was getting on my cash in the bank.
Question: how does this strategy tend to perform during market slumps? Is there a way to remain invested and just go deep into the In the Money calls?
Mark
Mark,
There are several strategy adjustments we can implement in bearish markets:
In-the-money calls
Out-of-the-money puts to enter covered call positions
Low-beta stocks
Conservative ETFs
Inverse ETFs (extreme bear markets only)
Exit strategies for bear markets
With rare exceptions, I am fully invested in most market conditions.
Keep up the good work!
Alan
Premium members:
This week’s 8-page report of top-performing ETFs and analysis of ALL Select Sector Components has been uploaded to your premium site. The report also lists Top-performing ETFs with Weekly options.
For your convenience, here is the link to login to the premium site:
https://www.thebluecollarinvestor.com/member/login.php
A warm welcome to the hundreds of BCIers who have joined our premium member community over the past month and a grateful thank you to those loyal members who have subscribed over the past 10 years.
Alan and the BCI team
Alan,
How much more risk is there in writing weekly covered calls than a naked covered call assuming I take a bullish view and my strike price is above what I think the market will bear for the stock. If I write a naked call to sell apple, (trading at 100 per share and my strike price is $120 with a 4.50 premium) on Monday and the expy is friday does that not mitigate much of the risk of the stock rising rapidly. Also could you put a buy to close if the stock hit a certain price say 107 in our example and buy back the option?
Dennis
Dennis,
Let’s start with this: Most retail investors should not be trading naked options. Now in your hypothetical, a 4.5% 1-week return is generated and we lose only if share price moves up more than $24.50 in 1 week. So far, this does seem pretty safe but let’s explore further.
A 4.5%, 1-week return annualizes to 234%. Is this realistic? I’ll give one of my hints…NO!
Let’s look at the other side of the trade. Why would a sane trader pay 4.5% with a stock trading at $100.00 with a positive outcome only if share price moves above $124.50 in 1 week? Only if the market is anticipating some sort of seismic event that will rock the share price one way or the other. Even earnings reports wouldn’t create returns like this.
So to sum up: Naked options are only for sophisticated, experienced investors with high risk-tolerance. I agree, that in your hypothetical and on initial glance the trade appears to be a good one. The problem is that the statistics are not reasonable so there is no lesson to learned. Below is a screenshot of a 6-day return for AAPL for a strike currently $19 above market value…a far cry from 4.5%
Early on in my investment career I was enticed by trades that appeared too good to be true…they were. I learned (the hard way) that there are no free lunches.
(Your overall thought process though is excellent).
CLICK ON IMAGE TO ENLARGE & USE THE BACK ARROW TO RETURN TO BLOG
Alan