The initial main step for covered call writers is to select the best underlying security. This choice will vary from investor to investor based on goals and risk tolerance. Some of our members prefer exchange-traded funds (ETFs), a strategy I use in my mother’s portfolio. ETFs offer the advantages of instant diversification, less volatility (in most cases) and less management time required. The main disadvantage is the lower returns generated by these securities because of the lower implied volatility and therefore time value of the option premiums.
To keep the process even simpler, some covered call writers will write calls against a broad market index ETF like SPY. This will give the writer exposure to the entire S&P 500 which historically appreciates 7-10% per year. As an example, I created a screenshot of the options chain for SPY with about 3 1/2 weeks remaining in the July, 2014 contracts:
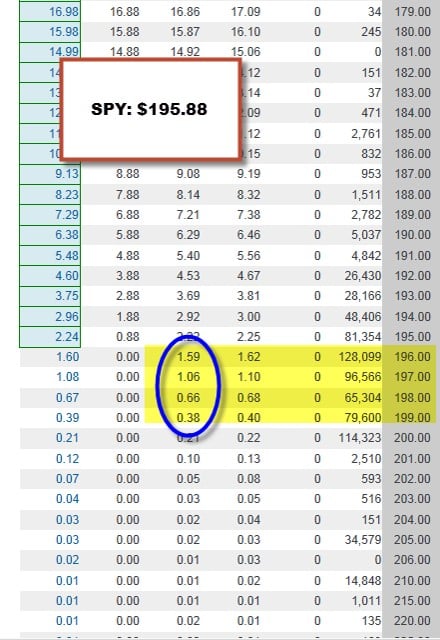
SPY options chain
With SPY trading @ $195.88, we will view the out–of-the-money $196, $197, $198 and $199 strikes.
We feed this information into the “multiple” tab of the Ellman Calculator to see if the results meet our goals:

SPY- calculating covered call returns
With upside potential (share price moves up to strike price by expiration) the 3 1/2 week returns range from 0.9% ($196 strike) to 1.8% ($199 strike). The more bullish we are on the overall market, the deeper out-of-the-money strikes should be favored.
Now another, and perhaps even better, approach to this type of investing is to use the best-performing Select Sector SPDRs. These securities are unique ETFs that divide the S&P 500 into nine sector index funds. They have the diversity of a mutual fund, the focus of a sector fund, and the tradability of a stock. Together, the nine Select Sector SPDRs represent the S&P 500 as a whole. However, each Select Sector SPDR can also be bought individually, providing you with exposure to a particular sector or industry group.
These securities all have options and can be used with our covered call strategy. Each week the BCI Team will do a 3-month technical analysis of the linear price chart of each sector and compare it to the performance of the S&P 500 itself. The top 3 funds outperforming the market benchmark will be listed and considered to be among the best candidates for covered call writing in the near-term. We will also show a chart of all sector components. Below is a recent screenshot showing the 3 best-performing Select Sector SPDRs as of 6-18-14:

SelectSector SPDRs-top performers
Summary:
In the cases of both SPY and the Select Sector SPDRs, we have the advantages of exchange-traded funds as long as we are targeting the lower (but still significant) returns they generate compared to individual stocks. By using the SPDRs, we are limiting our exposure to the best-performers at any given point in time and can rotate in and out of them much like institutional traders do.
***For a free copy of the Basic Ellman Calculator use the “Free resources” link on the black bar at the top of this page.
Website issues
Several members of my tech team have been working to upgrade the servers that support both the general and premium sites to accomodate the increased traffic (thank you for that!) we have been experiencing recently. This process should be completed sometime next week. Some of you have noticed slowdowns or downtime as a result of the site enhancement and I want to express my apologies for that but feel it will ultimately create a stellar site experience for all our members. Thank you for your support and understanding. I will keep you updated especially when we will need to shut down the site for a few hours to finalize the upgrade.
Market tone
This was just another slow summer week with not much happening except an escalating mid-east crisis, a catastrophic downed Malaysian airliner, Janet Yellen’s testimony before the Senate Banking Committee and a mixed, but mostly favorable, series of economic reports:
- The Federal Reserve Beige Book described an economy with “moderate to modest expansion”
- The Conference Board’s index of leading economic indicators rose by 0.3% in June, the 10th increase in 11 months
- Initil jobless claims for the week ending July 12th came in @ 302,000 below the 310,000 expected
- Retail sales increased by 0.2% in June but still left sales near its lowest levels since January but up 4.3% year-to-year
- Industrial production was up by 0.2% in June, the 4th increase in the past 5 months
- Construction of new homes fell by 9.3% in June, the weakest showing since September, 2013
- Permits for single-family homes increased for the 2nd month in a row and up 7.5% from a year ago
- Business inventories rose by 0.5% in May
- The Producer Price Index rose by 0.4% in June as the Fed watches for any hint of inflation reaching its 2% target to consider raising short-term interest rates
For the week, the S&P 500 rose by 0.5% for a year-to-date return of 8%, including dividends.
Summary:
IBD: Uptrend under pressure
BCI: Moderately bullish but cutting my bullish trading stance slightly selling out-of-the-moeny striles 2-to-1. My concerns are relating to the 2 major global conflicts and mixed signals from the housing industry.
My best to all,
Alan (alan@thebluecollarinvestor.com)
Alan, If at the end of the month the price of a stock is under the strike price, then is it alright to use this same stock again the following month, or would you rather it was always ITM at near expiry for using again the following month?
– Also just wondering what do I do if there is no ‘Y/N’ for the NTM options of the premium report.(I just eliminate these ones – hope that’s the best thing to do)? Thank you
Adrian,
Yes, it is okay to continue to include a stock that closed under the strike price the next month as long as it meets system criteria especially no earnings report. Also, make sure that the intial calculation returns (ROO) meet your goals.
Consider a blank space in the OI column of our premium reports the same as an “N” and eliminate as you have been doing. As a matter of fact, I’ll ask my team to make all entries in these 2 columns either a Y” or an “N” to avoid confusion in the future.
Alan
Alan,
After watching your money show webinar, I’m wondering does the buy and hold covered call strategy works with growth stocks like I have in my portfolio?
In your example you were talking about using dividend stocks.
Can I still increase my return by 6% a year?
Would having growth stock affect which call you would sell? I would assume you would want to sell strictly out-of-the-money calls?
If there is earnings in the next period would it
affect the call your selling?
Thanks,
Mark
Mark,
Covered call writing can be manipulated to accomodate many different forms of investing. Here you want to increase returns in a buy-and-hold portfolio of growth stocks. Most of the time portfolio overwriting is used in a portfolio of blue chip, dividend-yielding stocks. As I always say…one size does not fit all.
Although I have never done this, there are certain obvious adjustements you will need to make to accomplish your goal of an additional 6%/year.
First, check but chances are you will not have to worry about dividends on most securities because most growth companies are re-investing extra cash into R&D (research and development). If a company also distributes a dividend, use the guidelines I gave in the webinar.
Since growth companies have a higher implied and statistical volatility than dividend-yielding blue chip stocks and since your goal is to retain the stock in addition to generating higher returns you must look at strikes further out-of-the-money.
You can use the same formula I gave in the webinar where you look @ strikes out-of-the-money that generate 1-month returns of 1/2%
Earnings reports should be avoided in terms of writing the call…let the report pass and then write the call.
Alan
Premium members:
This week’s stock report will be a bit delayed today because IBD unexpectedly revamped its website making location of data points a bit more time-consuming than usual (this one time). My team is working feverishly to make up for lost time. We expect publication this evening but hope to get it out sooner.
It ceratinly will be available prior to our promise of “before market opens on Monday” but later than the usual late Saturday to early Sunday.
Thanks for your understranding in this matter.
Alan
Premium Members,
This week’s Weekly Stock Screen And Watch List has been uploaded to The Blue Collar Investor premium member site and is available for download in the “Reports” section. Look for the report dated 07-18-14.
Also, be sure to check out the latest BCI Training Videos and “Ask Alan” segments. You can view them at The Blue Collar YouTube Channel. For your convenience, the link to the BCI YouTube Channel is:
http://www.youtube.com/user/BlueCollarInvestor
Since we are in Earnings Season, be sure to read Alan’s article, “Constructing Your Covered Call Portfolio During Earnings Season”. You can access it at:
https://www.thebluecollarinvestor.com/constructing-your-covered-call-portfolio-during-earnings-season/
Best,
Barry and The BCI Team
Premium members:
Please note that the first 10 stocks on our current “running list” (mid-report) report earnings in the first week of the August contracts. Assuming that the report meets or exceeds expectations and does not have a precipitous price decline after the announcement, these stocks will be eligible after the report passes and price volatility subsides.
Alan
Alan, I have just sent you emails for not seeing the Premium report,etc yet so hope you can help me get them.
– A question also, if when you sell a stock that is underperforming, then do you do this the next morning(after the market price close), or could it happen anytime during the day after a review of chart analysis?
I am unsure what would be best for me to do in this situation, as I live in the different time-zone of New Zealand?, maybe set up an alert system of some sort at a given sell price be the right thing? Thanks
Adrian,
We are in the process of upgrading our server. Please send me your email address and I will send you your copy of the Weekly Report. My email address is – barry@thebluecollarinvestor.com
Best,
Barry
Adrian,
If you are selling an under-performer you must first close the short options position. This can be automated. Once you enter your initial cc position, set a buy limit order to buy back the option. Here’s an example:
Buy BCI @ $48
Sell $50 call @ $1.50
Set up a GTC (good-till-cancelled) buy/limit order @ $0.30 or less
This meets our 20% guideline
Change to $0.15 in the 2nd half of the contract
This meets our 10% guideline
If executed, ask your brokerage for email notification. Now you can decide which of our exit strategies to favor as detailed in my books/DVDs.
Setting buy/limit orders on the short options positions will be particularly useful to our international members who reside in different time zones from US exchanges but probably useful to many US residents as well.
Alan
Alan, thanks for clarifying with that answer. So after I setup a buy/limit order for when the option price meets the % guideline, then my brokerage company should send out an email notification to me. But would this email notification always be a reliable way, – what if they forget?, or does an alert then come out for them?
– And in my imagination here it seems that by the time I get to read the email notification(if any), that in my time-zone the ‘US market’ has already closed and then in my evening(after work) I would be thinking of implementing one of the exit strategies, when still in my evening here I enter in the next order – can you confirm this is alright to do?
Now the other option of course would be for me to have some audible alert on computer/phone, and then I wake up each time during my night to enter an exit strategy order,- I thought this is probably what I should do when a stock underperforms – as maybe by next morning some stock may have opened much lower?
Not quite sure if waiting after market closed for email checks is the appropriate plan here, if you can advise the best thing.Thanks
Alan –
I have a question pertaining to option cycle start, and maximizing return using theta.
I continue to paper trade select SPDR ETFs (and others) from the BCI premium members’ watch list. I’m having success, regularly ‘pocketing’ 1-2% per month. My confidence is growing, but I’m continuing to learn before going live.
I have a question about theta and option cycles. On page 158 of your Encyclopedia for CC Writing, the first paragraph mentions selling your option early in the option cycle in order to take advantage of theta (time value erosion). I understand this concept.
What I’m having trouble understanding is this; some of the ETFs have weekly options, (in addition to their standard monthly options). How do I determine if the covered calls that I am selling are being sold early enough in the option’s cycle in order to take maximum advantage of theta?
For instance on July 18th I bought 100 RSX at $25.10/share. That same day I sold the 08 Aug 14, 25.00 ITM strike for $0.70.
There are a total of 22 days from July 22nd to August 8th, am I to assume that the Aug 8th contract began on July 8th? In other words when did this option cycle begin and am I maximizing the advantage that theta offers, or should I have sold this call earlier than July 18th? In general my question is how do you tell when a given option contract began if it doesn’t expire on the 3rd Friday of the month?
I’m assume this will be of even more importance when I move out of trading ETFs and into Stocks when have more capital.
Thanks as always,
Justin
Justin,
As always you are posing an astute question on an important topic. I’m going to give a brief response in this venue and follow-up with a blog article in the near future:
Most of the stocks and ETFs appearing in our Premium member reports which have weeklys are part of the “expanded weekly program” This means that the options are created and made available to us in the current and next months. This is compared to the “standard weeklys” which are created at the end of 1 week and expire at the end of the next. The following weeks “weekly” is then created the next week…make sense? Stated differently, standards are created 1 week at a time while expanded weeklys are created 1-2 months in advance of expiration.
That said, there are 2 points that we need to know in this regard:
1- The date the option was created is much less of a consideration than the date you enter the trade. Both the time value of the option and the impact theta is projected to have is evaluated from point of entry of the trade rather than what it was at some point in the past.
2- Theta (time value erosion) is logarithmic in nature, not linear. The closer to expiration we enter a trade the greater the impact of theta. So if you sell a weekly 4 weeks away, it;’s like selling a traditional monthly. As a matter of fact, there are no weeklys the 3rd Friday of the month because monthlys expiring in a week, are in fact weeklys at that point in time.
Look for a more detailed article in a month or two.
Congratulations on your recent trading success…so inspired to see your progress.
Alan
Hi Alan, my previous ITM options trade expired worthless recently closing below the strike but above my breakeven. I had bought 1,700 DWA shares for $23.95 and sold 17 July19 23.00 strike for $1.50 premium. My breakeven was $22.45.
Today I sold 17 ITM Aug16 contracts again on the same shares but at the lower $22.00 strike for $1.30 premium while the stock was trading below my previous breakeven somewhere between $22.40-$22.44.
I need help understanding two things…
1. How to calculate my losses on the previous trade since I sold options on the same shares?
2. What is my average share price now for today’s trade so I can figure out my new breakeven, time premium, etc..
Thank you,
Peter
Hi Peter,
I’m assuming this is a stock in a longer-term “buy-and-hold” portfolio rather than a stock you selected for a traditional cc writing portfolio because of the weak fundamentals and technicals. If so, cc writing will definitely help to mitigate losses and generate a constant income stream.
Here is how we can view this, now, 2-month trade (not for tax purposes):
The first month resulted in a slight loss but the trade continues into month 2. As you enter the 2nd option sale, your cost basis is now $22.45. Let’s use that as our starting point in this 2-month trade:
You then sold the August $22 in-the-money strike for $1.30, of which $0.45 is intrinsic value which “buys down our cost basis to $22. The time value remaining on the 2nd premium is $1.30 – $0.45 = $0.85 or $85/contract. Your new breakeven = $21.15.
If DWA remains above $22, your 2-month return calculates as follows:
$85/$2200 = 3.9%
Please note that there is an upcoming earnings report next week that can shake things up. That’s why your potential return is still high but so is the risk you are exposed to. I always avoid ERs when selling cc options.
Hope everything works out.
Alan
Alan, I asked you a question to your reply above which you stated:- “Once you enter your initial cc position, set a buy limit order to buy back the option.”
And now I need to ask you again how best to going about applying this next option leg after the Buy limit order. My revised reply is below:-
I am thinking by the time I get to read the email notification (if any), that in my time-zone the ‘US market’ has already closed, and then in my evening after work I would be thinking of and then most likely putting in an exit strategy order. Or should I put in an audible alert on computer/phone, meaning I would then need to wake up to enter this exit strategy order? ( I thought this is probably what I should do when a stock underperforms – as maybe by next morning some stock may have opened much lower?)?
So as you can tell in my position here I’m not quite sure the best thing to do – an order after work or an audible alert?
Thanks again for your understanding.
Adrian,
Once you place your buy-to-close limit order, have an arrangement with your broker for some form of notification, if executed (phone, email etc.). The next step will be based on the parameters set forth in my books/DVDs or the ones you have personally set for yourself:
wait…with a goal of “hitting a double”
roll down
sell stock
Some brokerages also have advanced orders that can be placed called “OTO: or one triggers other. Here you can place an order that if the buy limit order is executed then sell stock or roll down order will be triggered. Check with your broker to see what’s available and which works best for you given the major difference in time zones.
Some brokerages (most) also offer buy/write combination forms where you can close an entire covered call position by setting a net credit limit order where the sale of the stock minus the buy back of the short call must be > than a certain amount determined by you. Again, check with yiour broker to see what’s available and in your best interest.
Alan