Exchange-traded funds (ETFs) offer covered call writers and put-sellers the advantage of instant diversification and generally have a lower implied volatility associated with them compared to individual stocks. Whether we are dealing with stocks or ETFs each security must be evaluated on its own merit before using it as the underlying security. In this article, I am highlighting ASHR (DB X-trackers Harvest CSI 300 China A-Shares) which provides cap-weighted exposure to the Chinese equity market, where foreign investors have historically had very limited access. This is because China has a “mostly closed” capital account, whereby investors, as well as companies and banks, cannot move money in and out of the country except in accordance with strict rules. Capital account liberalization is part of China’s current reform efforts, and the fact that this exchange-traded fund exists is evidence that China is moving to open up its capital markets. The inception of this ETF was 11-6-13 and the security now holds net assets over $1.4 billion.
Technical perspective
This security earned its way onto our Premium ETF Report in late July, 2014 and has remained there ever since. Let’s have a look at the technical chart over the past year:
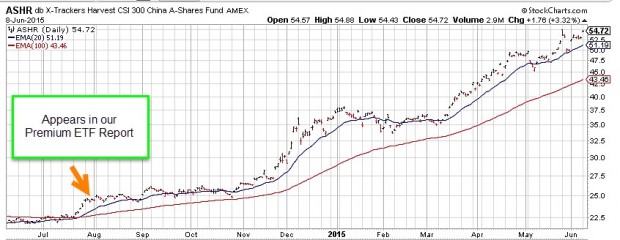
ASHR: One-Year Price Chart as of 6-9-15
ASHR became a staple of the Premium ETF Report in late July, 2014 after the 20-day exponential moving average (EMA) crossed above the 100-day EMA and the price bars continued to remain at or above the short-term EMA. The price in July was $24.00 and as of 6-12-15 it is above $55.00.
Implied volatility both an asset and a liability
Many Chinese securities that trade on US exchanges (American Depository Receipts or ADRs) are highly volatile due to the nature of the Chinese economy and the lack of transparency associated with these stocks or ETFs. This is a factor we must all consider before using ASHR as an underlying security. As of 6-9-15, ASHR’s implied volatility was three and a half times that of the S&P 500 (45.85 compared to 13.50). This means we are incurring more risk to the downside when utilizing this security. The good news is that this high level of volatility results in higher option premiums. On 6-9-15, with ASHR trading at $54.72 I checked the option chains for the July 17, 2015 $50.00, $55.00 and $60.00 strike prices. The results represent five-week returns. Here is the information as shown in the multiple tab of the Ellman Calculator (for a free copy click on the “Free resources” link on the top black bar of this page):
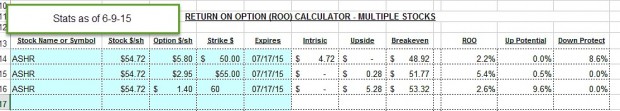
Covered Call Calculations for ASHR
Initial returns
- $50.00: 2.2% or 22% annualized
- $55.00: 5.4% or 54% annualized
- $60.00: 2.6% or 26% annualized
Potential final one-month returns
- $50.00: 2.2% but comes with 8.6% downside protection of the 2.6% profit
- $55.00: 5.9%
- $60.00: 12.5%
Bearish outlook
It would make sense to favor the $50.00 strike price because we are generating a nice 2.6% five-week return which will realized as long as share value does not decline by more than 8.6% by expiration Friday.
Bullish outlook
Both the near-the-money $55.00 and the out-of-the-money $60.00 strikes make sense because both offer favorable initial five-week returns. The $60.00 strike is the most aggressive position to take because it offers the highest potential total returns although lower initial returns than the $55.00 strike.
Breakeven
The calculator also shows us that the higher the strike we select, the greater is our potential total return but also the more risk we are incurring as the breakeven also moves higher.
Discussion
Our Premium ETF Reports will identify securities that are out-performing the S&P 500 and some, like ASHR, can out-perform over a significant time frame. When such an exchange-traded fund is identified, we still need to evaluate additional factors before including it in our option-selling portfolios. We must be certain that the premium returns meet our goals and the implied volatility matches up with our personal risk tolerance. Another decision that must be made regarding ASHR is whether we are comfortable with a Chinese security which is notoriously less transparent than a corresponding US security. If these criteria meet our trading requirements there can be enormous opportunities with an ETF like ASHR.
$30 DISCOUNT + FREE SHIPPING FOR NEW PUT-SELLING DVD PROGRAM: PROMO CODE “PUTREBATE”
New Put-Selling DVD Program
We are offering this deep discount ($125 – $30 = $95) for early-ordering of our newly-released DVD Program which details all aspects of Put-Selling including stock selection, option selection and position management. The Companion Workbook contains 50 all-color pages of all charts, graphs and slides. You will also get a BONUS DVD of the 10 Most Costly Mistakes Made by Put-Sellers and how to avoid them. Here is a link to the course outline:
To order use the link below or visit the Blue Collar store link and scroll down to the bottom right side:
SCROLL ALL THE WAY DOWN TO BOTTOM LEFT & “BUY NOW”
***Be sure to enter promo code PUTREBATE in the box on the right to get your $30 discount @ checkout.
Next live seminar (recently added)
Market tone
Greece’s financial future continues to look uncertain after another week of debt negotiations yielded no significant results. This week’s economic reports:
- US retail sales rose 1.2% in May after a 0.2% increase in April, with gains in 11 of 13 major categories
- The University of Michigan’s preliminary index on consumer sentiment climbed more than expected to 94.6 in June from a final reading of 90.7 in May
- The National Federation of Independent Business’ Small Business Optimism Index climbed 1.4 points to 98.3 in May, the highest reading since December
- US producer prices increased 0.5% in May mainly due to a rise in fuel costs
- Wholesale prices fell 1.1% year-over-year
- An increase in fuel costs pushed US import prices 1.3% higher in May from a year earlier, the largest increase since March 2012 and coming after 10 straight months of declines
- Fuel costs rose 11.8%, the most since mid-2009
- Excluding fuel, import prices were unchanged in May
- The US Bureau of Labor Statistics reported 5.4 million job openings in April, up from 5.0 million in March and the highest monthly reading since data collection began in December 2000
- Initial jobless claims increased 2,000 to 279,000 for the week ended 6 June, the 14th straight week under 300,000
For the week, the S&P 500 rose by 0.1% for a year-to-date return of 1.7%.
Summary
IBD: Confirmed uptrend
GMI: 6/6- Buy signal since market close of May 11, 2015
BCI: Cautiously bullish favoring out-of-the money strikes 3-to-2
Wishing you the best in investing,
Premium Members,
This week’s Weekly Stock Screen And Watch List has been uploaded to The Blue Collar Investor premium member site and is available for download in the “Reports” section. Look for the report dated 06/12/15.
For your convenience, here is the link to login to the premium site:
https://www.thebluecollarinvestor.com/member/login.php
Also, be sure to check out the latest BCI Training Videos and “Ask Alan”
segments. You can view them at The Blue Collar YouTube Channel. For your
convenience, the link to the BCI YouTube Channel is:
http://www.youtube.com/user/BlueCollarInvestor
Members of our team will be traveling out of the country on business next week. The report for next week (report for 6/19/15) will be uploaded Sunday evening.
Best,
Barry and The BCI Team
Alan,
I’ve been doing very well with ashr since early this year (wish i started last year). I find the iv statistics helpful because i use more conservative strike prices with high-iv etfs.
Thanks for information.
Carol
Carol,
Smart investing…you’re a true Blue Collar Investor.
Thanks for sharing.
Alan
Alan,
Good morning!
What exactly does this mean?
BCI: Cautiously bullish favoring out-of-the money strikes 3-to-2
Thanks
Tom
Tom,
“Cautiously bullish” means that I have a favorable outlook on the economy but have short-term concerns like issues in Greece, the Fed watch and recent muted corporate profits. As a result, I am mixing the strikes I use in the percentages of 3 OTM for every 2 ITM. So, if I opened 5 positions, 3 are OTM and 2 are ITM. “Laddering” strikes in this manner in one way to diversify positions based on overall market outlook.
Alan
I started recently and did some covered calls successfully. Couple of them were weekly covered calls. Are weekly covered calls recommended? And if so,how do I find stocks with weekly options? I did GPRO so far.
Jerry
Jerry,
My personal preference are monthlys but we do have many members who use weeklys. Both our stock and ETF Reports highlight securities with weeklys. look in the “running list” (mid-report) for stocks in the 3rd column from the right and in the ETF Report on page 4.
In the “resources/downloads” section we have a file of the pros and cons of weeklys…scroll down to the bottom of that list.
Alan
Alan, thanks for your recent answers, and I first want to say that I think I agree that doing collar trades with put options in place when starting out is what I would likely do. Because while papertrading I have seen that there is still the odd stock that can ruin the profits of all others, maybe through a gapdown from some analyst downgrade,etc (and not just ER’s). It’s these other loss-makers I had concerns for, because they may strike anytime and we are probably unlikely to avoid them – unlike ER’s which we could avoid.
So with that being said I would like to know some things about Weekly options after my last put option question:-
1. If I already own a stock that has put options on them and then I want to do the MCU strategy, then do I need to include the put option bought cost in the calculation, to figure out whether alright or not to unwind?
2. When selling weekly options would there be any need to buy put options at all,- compared to the possibility of using them when selling monthly’s?
3. Does selling weekly options require that person to be monitoring the stock all day long and every hour?,- what’s the best timeframe? (hourly?)
4. Now wouldn’t this mean that some investors(like myself) may need to watch the chart right throughout the night so as not to miss anything?
5. Also after a gapdown I was thinking that wouldn’t it be better for us to try and sell weekly options if we could, as there is more return given back from the trades than using monthly options again?
I have some questions about trade entries to ask next. Thank you
Dear Adrian,
I am certain Alan will reply to you as he does all his members. But I could not resist stepping in because I know you are a regular contributor and I have been in the confused state you are in.
If I may offer a suggestion: simplify. Do not over think it.
Are you bullish or bearish on the stocks you own for July expiration? If you are bearish write covered calls close to the money. If you are bullish write further from the money or not at all. Let them run free!
Maybe even sell some cash covered puts on stocks you would like to own but not at today’s prices. It will pay you to wait.
The beauty of selling options is the flexibility. It is probably not fair to put a series of questions to Alan and expect formulaic answers no matter how hard he tries :).
Investing is like growing a garden. It takes attention but not all the time :). Kindest regards, – Jay
Adrian,
My responses:
1- The cost of the put option decreases your returns. it must be considered to accurately access if your are meeting your goals. When employing the MCU exit strategy your put will be worth very little if anything at all (stock prices has increased significantly). If you sell a call for $2 and buy a put for $1, your initial return is $1. If you close using the MCU exit strategy and sell the put for $0.05, your final return is $1 + share appreciation + $0.05 minus cost to close.
2- If the concern is a gap-down, it can occur at anytime if unexpected bad news comes out whether you are selling weeklys or monthlys. You can buy a 1-month put and sell weekly calls to decrease put expenses and keep monthly commissions to 5-6/month to enter the trades you are suggesting.
3- Monitoring weeklys is similar to monthlys with the exception you have “rolling” decisions up to 5 times a month rather than once a month. It’s like being in the final week of a monthly all the time.
4- We have many members living in countries outside the US when US markets are open overnight where you live. You can set up limit orders to buy-to-close should option value reach the 20/10% guidelines. Positions need to be monitored more closely on Fridays.
5- I would not alter time frames based on a gap-down. If your trading style favors weeklys, stay with weeklys; if monthlys…stay with those.
Many thanks to Jay for your valuable input.
Alan
Alan,
I purchased two of your great books and I have learn a lot about sell Covered Call and Sell Cash secured put options.
Now, I try to develop a strategy that allow me to generate monthly incomes from writing covered put and calls without to be assigned. Pratically I ‘ m interested in collect just the premiuns every months.
At today I use a basic rules when I select the strike price: I chose alway a stike that is 5% over ( for a call) or 5% under for a put with 4 week to expiration. My question is:
did you know a more correct and approprieate way to select a strike OTM that put odds in my side that is more connect with a specific stock? Some empiric roules like using a volatility multiply or ATR multiply?
I know every stock move in a different way and that make difficult to be consistent.
Thanks so much for your help!
Stefano (from Hong Kong)
Stefano,
5% is a reasonable percentage to use given your desire not to have assignment. I would add to that a parameter regarding the time value initial return because that percentage is directly related to the implied volatility of that security. A reasonable 1-month return goal would be 1 – 1 1/2% Once the position is entered we have our exit strategy arsenal prepared in case we need to take action. Here’s a link to an article I published that you may find useful:
https://www.thebluecollarinvestor.com/portfolio-overwriting-selling-covered-calls-on-stocks-you-want-to-keep/
Alan
Thanks Alan,
if I understand correctly the premium of the option is higher when the IV is hight. I found difficult to found premium that pay 1 to 1, 1/2 % in return if I look to low IV stocks. My portfolio is build on solid stock that have in average 10% to 20% implied volatility, and that lead that a 4/5week options give me a premium more likely near to generate 0.3/ 0.5% monthly revenue. Ma be I miss something…
What do you think?
Kind regards
Stefano
Stefano,
You’re definitely on the right track now. The two factors that go into the time value (as opposed to intrinsic value) of our option premiums are time to expiration and the implied volatility (IV) of our underlying security. Since most of us are comparing options with the same time frames (1-week or 1-month), IV is the main factor. The higher the IV, the greater the premium but also the greater the risk on the downside. If you are looking only at low-IV stocks, you will generate smaller premiums…that’s the trade-off. I set an initial goal 2-4% for stocks and 1-2% for ETFs (my Mom’s portfolio) and that will lead to selection of securities with moderate IV. This is a perfect example of how personal risk tolerance factors into stock and option selection.
Keep up the good work.
Alan
Dear Jay, thanks for your little insight on covered calls although some of what you had mentioned I actually already knew.
I am currently papertrading and I certainly do have alot of questions to ask Alan, and fully appreciate the great job he’s done helping me over the past 1-2 years.
But because I dislike logging into Hotmail to pull out 1 question every day, I have therefore chosen to ask a couple at a time instead.(also a great timesaver!)
I guess if anyone really wants to be successful at something then it certainly pays to ask many questions, no matter how long it takes or how silly they can be, until you finally get that understanding you have wanted.
Regards Adrian.
Alan, that was good I now know the answer to that 1st question as I hadn’t included put option costs in a MCU, and will have to go back and re-adjust all my past calculations I had with this in. It’s quite annoying but has to be done correctly.
Moving on now to ask you about the Entries:- and firstly I was thinking of using an Hourly chart to better spot any divergences and trendline breaks. I thought of only using this smaller timeframe chart for specific situations, and for me they are for the ‘hit a double’ strategy at a support level, after a price gapdown, and also at the end of the 3rd(4th)week and the following “expiry week” again for any possible divergences and trendline breaks at a Resistance level.
1. Does this seem like a good way to better prepare for any possible trend reversal in the stock?,- and if so, then shouldn’t I also see the S&P500 Hourly chart at the same time?
2. Do we need to see that a stock is performing better than the S&P500 before buying any stock to use?
3. And would you try and make sure there is some type of support level around your breakeven price points, before considering to put on the trade or not?(this could possibly be the source why some trades have worked out while others don’t!) Thanks
Adrian,
My responses:
1- Technical analysis is an art as much as a science and I have no issues with members who add additional parameters to our screening process or even exchange ones that I use for others. The four technical parameters archived in my books/DVDs are the ones that have worked best for me over the past 2+ decades of selling options. In my view, the most important factors regarding a gap-down or any significant decrease in share price is the reason for the decline (check the news at a site like finviz.com) and the time in the current contract month that the decrease took place (early, mid, late). From there, you can factor in the technical parameters you ultimately choose.
2- Not for stocks although most of the stocks on our Premium Watch Lists will be significantly out-performing the S&P 500. For example, if the S&P is up 15% in the past few months (hasn’t been this year) and a stock is up 10%, it still may be a good candidate based on our three-pronged screening process (fundamental and technical analysis and common sense screens). ETFs on the other hand, we do require to be out-performing the market because we cannot use all the screens for ETFs that we can for stocks (for example, fundamental screens).
3- If a stock meets our 3-pronged screening criteria, it is eligible. If technicals are such that there is concern for a reversal, selling ITM strikes may be an answer. I agree with those who value technical analysis but I do not consider it more important than the other two screens and would not hang my hat on it for all investment decisions. If you get 100 chartists in a room to evaluate one price chart, you will get dozens of different interpretations.That said, it would be a mistake to ignore chart technicals and that is why I devote so much of my material to the topic.
Always have exit strategies ready to go if a trade turns against us.
Alan
Premium members:
This week’s 6-page report of top-performing ETFs and analysis of ALL Select Sector Components has been uploaded to your premium site. The report also lists Top-performing ETFs with Weekly options.
For your convenience, here is the link to login to the premium site:
https://www.thebluecollarinvestor.com/member/login.php
NOT A PREMIUM MEMBER? Check out this link:
https://www.thebluecollarinvestor.com/membership.shtml
Alan and the BCI team
Alan:
I have been mostly selling out-of-the money calls against ETFs like SPY, QQQ, etc things I consider core holdings. For that reason I have owned them thru several one month periods and collected extra income. When I try to evaluate a call for profitability what number should I use for cost of the position? Would it be today’s value, what I paid for the original position or something else. With the market bouncing around in the trading range it’s been in I’ve been able to close the calls out using your rules and haven’t been assigned. I’m getting ready to Sell to Open July 17 calls and don’t know quite how to set the value of the underlying ETF. Any suggestions would be appreciated.
Larry
Larry,
In order to make the best investment decision at any point in time we must use current market value. If we bought a stock for $20 and its now trading at $50 and we are initiating a trade on Monday, June 22nd for a call premium of $1, what is our return? Is it 5% ($20 cost basis) or 2% ($50 cost basis). I say 2% because if we sold the shares and used a different underlying, we would have $5000 per contract, not $2000 per contract.
Now, if you’re trading in a non-sheltered account, the cost basis is not $50 FOR TAX PURPOSES, but that’s an issue for our tax advisors. The Ellman Calculators and the equations I wrote for them were intended to assist us in making the best investment decisions at any point in time. Using a cost basis from the past will only cloud our determinations.
Alan
Alan,
I am excited to share with you the results of my covered call writing for this concluding contract month: +$23,684! (still one day to go actually). I calculate that the cost of your book and my subscription to the Premium service are paying themselves several times over… I maxed out on all OTM transactions, with an average overall return of 3.5%. The amount invested includes capital borrowed on margin, so the real return was actually 6.1%.
The portfolio is up 4.93% during this contract month (not bad considering the S&P was flat over same period), with some positions having appreciated somewhat significantly (IDTI +9%, NTES +7%, DATA+7%). Having no crystal ball, the possibility (or fear?) of a correction in the following contract month is messing with my judgement of whether I should apply exit strategy for these high performing stocks, knowing full well that these stocks are probable candidates for the next contract month. Do you give any weight in your exit strategy decisions to shares that have appreciated significantly?
Thanks
Anton
Anton,
Congratulations and thank you for sharing. Your hard work and due-diligence is paying off.
Rolling considerations are based on chart technicals (all good in these cases), overall market assessment and personal risk tolerance. When we roll out, we always do so to in-the-money strikes because the assumption is the strike is in-the-money or we wouldn’t have to roll the option. Run the calculations and see if the returns meet your goals. Use the “What Now” tab of the Ellman Calculators.
If you are more bullish, consider rolling out and up. Also, be sure to check for earnings dates. Most stocks will be eligible for the July contracts but not for the August contracts so rolling out (not “and up”) will increase the chance of assignment, a positive given the earnings situation.
Alan
Great work Anton! I enjoy seeing such success using the system. It looks like this month paid for a lifetime of premium subscription. 🙂 Results like yours inspire me to save more and know what Allen provided us will set us up for a great financial future (and present).
Also thanks Allen for looking out for the BCIs of the world. I read in one of your articles that some brokers and hedge funds wanted to take you on board but you held true to helping your fellow investors. I believe you have reached many more people and have done more good taking the route you did. Thanks for your empowerment.
Nate,
I can’t tell you how much I appreciate thoughtful feedback like yours. Over the years I have printed these out and placed them in binders which I can view from the desk in my office. Now I have another!
Although the offers I receive from wealth managers and others have been quite generous, if I accepted, I wouldn’t have time to write books, produce DVDs, host live seminars, write blog articles, respond to emails and posts right here. That’s simply not happening. I am having the time of my life working with you, the BCI community, as we learn from each other in our mission to achieve financial independence.
I consider what I do an “honor”, it’s certainly not a “job”
Alan