Covered call writing is a strategy that can be applied in several different manners. I have written about generating monthly cash flow, the main reason we use this great strategy. But it also can be used to augment long-term buy-and-hold portfolios, enhance dividend distributions by decreasing our cost basis and protect us in bear market environments with some downside protection. The common thread is more cash in our pockets in all these scenarios.
Recently, one of our members, Rick from upstate NY, wrote me suggesting a twist to our covered call writing strategy where both in-the-money and out-of-the-money options are sold after buying 100 shares of stock. My reaction was probably the same as yours…we are now “covered” in only half of our short positions. So my initial concerns are:
- We are undertaking added risk
- Will our brokerage approve us for naked call options trading (selling options without owning the stock first)
- Is this an appropriate strategy for the level of risk tolerance we are willing to undertake
For most of us it is not an appropriate strategy nor will our brokerage likely approve us for this level of trading. More sophisticated traders with higher cash accounts will get the broker approval.
Despite this, I do feel that it would be a valuable exercise to set up some hypothetical trades that will give us some ideas as to the risks and benefits of such a combination strategy.
The stock I selected from our premium Watch List is SWKS. Have a look at the beautiful price chart as of the penning of this article:
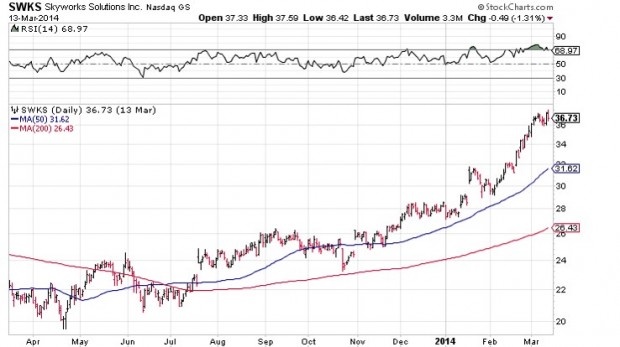
Price chart for SWKS: 3-13-14
Here are the hypothetical parameters I’ll use in this week’s article (initial stats taken from a real options chain for SWKS on March 13, 2014 and a 5-week return):
Initial stats
- Buy 100 x SWKS @ $37
- Sell $35 call @ $2.65 (1.9% return; 5.4% downside protection of the profit)
- Sell $38 call @ $1 (2.7% return; 2.7% upside potential)
Hypothetical closing prices to be evaluated
- $30
- $36.50
- $44
We will evaluate the returns if share price rises or falls by $7 and closes between the two strikes.
If stock price drops to $30 by expiration
- Neither option is exercised
- Unrealized share loss = $7
- Total premiums collected = $3.65
- Net unrealized loss = (-)2.35 = (-)6.4%
- The risk and unrealized loss is magnified as share price declines below $30, if no exit strategies are instituted
If stock price rises to $44
- Both options will be exercised
- We will need to buy 100 shares @ $44 to cover the naked option
- Average cost per share = $40.50 ($44 + $37/2)
- Average sale price = $36.50 ($38 + $35/2)
- Share loss = $4
- Total premiums collected = $3.65
- Net loss = $0.35 = 0.9% ($0.35/$40.50)
- The risk and loss is magnified if share price moves above $44 and no exit strategies are initiated
If stock price closes @ $36.50
- The $35 call will be exercised and generate $35 per share
- The $38 call will not be exercised
- Share loss is $2 per share (buy @ $37 and sell @ $35)
- Total premiums collected = $3.65
- Net profit = $1.65 = 4.5%
Takeaways from these hypothetical trades
- A closing price between the 2 strikes will result in a handsome return
- Extreme share acceleration or depreciation will result in a loss, perhaps a catastrophic loss because half our position was uncovered initially
Conclusion
Adding an uncovered or naked component to covered call writing changes everything. We are incurring more risk for a strategy that is geared to conservative investors with capital preservation as a key requirement. There are many ways to make money in the stock and options markets and each investor must evaluate his (her) own risk tolerance before deciding which of those strategies are appropriate for the family portfolio.
Exit strategy flow chart available on our Premium site
One of our members, Jim M. constructed a flow chart incorporating the position management techniques detailed in our Exit Strategy DVD Program as well as in the Complete Encyclopedia for Covered Call Writing. A lot of time, attention and skill went into production of this tool and Jim gave me permission to share with our premium member community. Look in the “resources/downloads” section of the premium site and scroll down to “Exit Strategy Flow Chart- Entire Month”
Many thanks, Jim.
Upcoming webinar
I will be hosting a 45-minute free webinar for Investor Inspiration on Saturday May 17th @ 12:15 PM EST. To register:
http://investorinspiration.com/live-webinar/
Scroll down to “Session 3”
Upcoming seminar
My next live seminar will be held in Orange County, California on Saturday June 14th @ 9 AM PCT. Details and link to register will follow on this blog once I receive it.
Earnings reports dates
- Historically, EarningsWhispers (EW) has been the most consistently accurate site that we use.
- However, sometimes even that site introduces some inaccuracies.
- As a result, if the ER date that EW gives “looks questionable”, we go to other sites for confirmation. These sites include:
Market tone:
Now that we are past the severe winter conditions, the economic reports are generally presenting a favorable economic picture:
- The US trade deficit (a report of the difference between the dollar value of exports and imports. Foreign trade is an important component of aggregate economic activity, representing a significant portion of gross domestic product. Also, the level of exports is an indicator of the global competitiveness of U.S. industries) decreased by $1.5 billion to $40.4 billion
- American exports rose by $193.9 billion in March, the 2nd highest level on record
- According to the Federal Reserve, consumer borrowing increased by $17.5 billion in March, and has been up every month since August, 2012
- According to the Labor Department, non-farm business productivity (a measure of the growth of labor efficiency in producing the economy’s goods and services. Unit labor costs reflect the labor costs of producing each unit of output. Both are considered indicators of future inflationary trends) fell by 1.7% for a seasonally-adjusted annual basis. This was the sharpest decline in a year
- Initial jobless claims for the week ending May 3rd came in @ 319,000 below analyst’s expectations (325,000)
- The ISM Non-Manufacturing Index moved up to 55.2 from the March reading of 53.1 and ahead of economist’s projections. Readings above 50 indicate expansion of our economy
For the week, the S&P 500 was down 0.1% for a year-to-date return of 2%, including dividends.
Summary:
IBD: Market in correction
BCI: Cautiously bullish but keeping a defensive posture due to global economic and geo-political concerns and selling in-the-money strikes 2-to-1. More conservative investors may also consider the use of ETFs and reducing monthly goals to 1-3% while using less volatile securities until the market calms.
Wishing everyone the best in investing,
Alan (alan@thebluecollarinvestor.com)
www.thebluecollarinvestor.com
Premium Members,
The Weekly Report for 05-09-14 has been uploaded to the Premium Member website and is available for download.
Also, be sure to check out the latest BCI Training Videos and “Ask Alan” segments. You can view them at The Blue Collar YouTube Channel. For your convenience, the BCI YouTube Channel link is:
http://www.youtube.com/user/BlueCollarInvestor
Best,
Barry and The BCI Team
Thanks Rick and Alan for the conversation. I have only been at this about a year. So I have a lot to learn. I was frustrated with my rookie season lagging SPY.
The income each month was head spinning. But the debits created seemed to hold the account back all month long. The “income” got eaten up by stocks that lagged and the winners were no help since they got called resulting in mediocre results. Exit strategies were useful and I am getting better at those.
I was indeed writing calls in the 2-4% range. I just found I was not keeping much of it each month while the index marched inexorably higher.
I am now back to paper trading in a virtual account to examine each and every trade to really know how the peculiar accounting of covered calls works and why I was unable to make the returns I thought I would.
Things I am already seeing is a blend of strike prices and not covering the entirety of every position improves results. If I buy an up trending stock with a Beta greater than 1 I no longer cover all the shares. Let some run!
I have complete confidence in Alan and Barry.
In my career I worked in industry. More often than not when things went wrong it was “Operator Error”. Well, I am the Operator here. I have no doubt the culprit behind my mediocre performance sits at this keyboard wishing the rest of our member colleagues better results! – Jay
Alan,
With AAPL now on our watch list, does it make sense to wait until after the split before using this stock or doesn’t it matter? Historically, is there a lot of volatility after a split like after an earnings report?
Thanks,
Ken
Ken,
If your cash available permits and you have decided that a stock is appropriate for your portfolio, waiting for the split distribution is NOT necessary. The major difference between the split distribution and the earnings report announcement is that we know precisely what will take place with the former…7 shares for 1 in this case. The ER announcement can be good, bad or indifferent. Furthermore, the split is already factored into the current market value. Once the split occurs, many retail investors will be able to purchase AAPL in 100-share increments that couldn’t previously. This will be a minor positive for the stock price.
Alan
Alan,
Although selling naked calls is not part of the BCI methodology, if one choose to sell the uncovered/naked call, they could set a buy-stop-order to buy the stock before it reaches the strike price. In the example you gave, you could purchase the stock at 43.50 or 43.75 to turn the naked position into a covered position if the stock price is rising. In this scenario, the risk is the stock will rise above $44 in the after-hours stock trading session. I’ve found that this method works better on stocks that are trending down with no upcoming earnings report.
Eric
Alan, selling two calls is an interesting idea and thanks for analyzing it. However, as you point out, the uncovered naked call is pretty risky. If one were going to try and get two credits instead of one, I would think selling a put in addition to the call would be better than selling a second call. This too has risks but at least you know in advance what you’re getting into.
Steve
Steve,
I personally don’t like any form of naked option trading for most retail investors but thought it would be interesting to analyze a strategy proposed by one of our members. Even put-selling should be cash-secured for most of us.
Alan
Alan,
I purchased 200 shares of Trinity Industries, Inc. on 05/06/2014 @ $78.48/sh and sold the 80 June 21 calls for $2.41/sh. At the same time, Trinity announced a 2-for-1 stock split issued via a !00% stock dividend. It will be distributed on June 19, 2014 to the shareholders of record at close of business on June 5.
I assume (unless I take a midsession strategy action) that the 400 shares of stock will be called on June 21 if the current price exceeds $40/share. Would you confirm please.
Regards,
Buddy
Buddy,
You are 100% correct. 2 contracts of the $80 strike becomes 4 contracts @ a $40 strike. Should the share price remain above $40 ($80 now) as expiration approaches you can roll the option if the calculations meet your goal. Great trade so far!
Alan