When selling covered call and put options we must first establish our initial time value return goals. We also should factor in upside potential when writing out-of-the-money call options and downside protection of those time value returns in bear and volatile markets. Do we accomplish these parameters based on our total portfolio returns or on an individual stock basis? This article will highlight why all BCI calculators and information located in our books and DVDs manage this aspect of our strategy from an individual stock perspective only.
Stocks evaluated in this hypothetical portfolio based on real-life option chains
- Applied Materials, Inc. (NASDAQ: AMAT)
- On Assignment, Inc. (NYSE: ASGN)
- Five Below, Inc. (NASDAQ: FIVE)
Methodology
Option chains were evaluated for strike selections based on bear market environments (in-the-money strikes), neutral to bull market environments (out-of-the-money strikes) and a third portfolio where the average returns meet our goals. The stated goals for this analysis are 2% – 4% initial time value returns with upside potential or downside protection depending on overall market assessment and chart technicals.
Initial assessment
Even in markets defined as bullish or bearish, there can be individual stocks with chart patterns contrary to overall market performance. This immediately establishes a benefit to evaluating each stock on its own merits rather than part of a total portfolio.
Bullish calculations based on real-life option chains
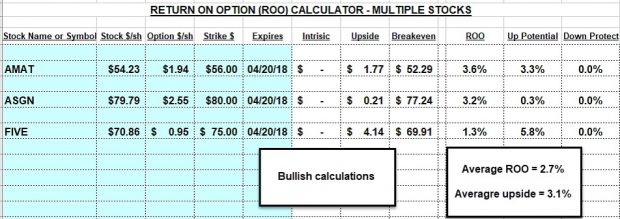
Bullish calculations for individual stocks using the Ellman Calculator
Bearish calculations for individual stocks based on real-life option chains
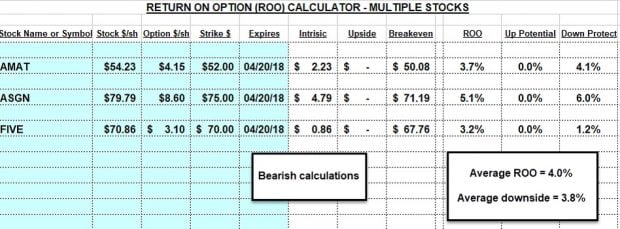
Bearish calculations for individual stocks using the Ellman Calculator
Average portfolio returns based on real-life option chains
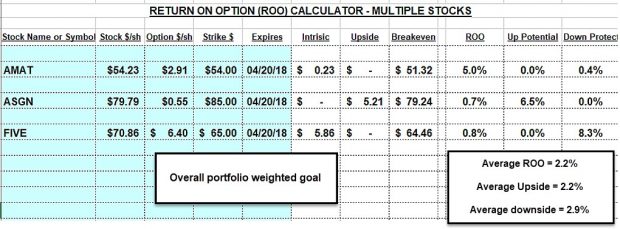
Average Portfolio Returns using the Ellman Calculator
Discussion
Although the total portfolio average returns do meet our stated goals (2% – 4%), there is an apparent under-performance compared to portfolios established on an individual stock basis. In the bullish and bearish portfolios, each stock returned initial time value returns (ROOs) that met or closely approached our requirements. The average total portfolio returns did meet our requirements with a 2.2% ROO but none of the equities fell into our 2% – 4% range. AMAT was well above at 6.0% and ASGN and FIVE were well below at 0.7% and 0.8% respectively. As a result, to maximize our portfolio performance, we always base our strike selections on an individual stock basis rather than on average portfolio returns.
S&P tech sector re-organization this Monday: CNBC video explains
Upcoming event
AAII National Investor Conference: Las Vegas Nevada
October 26 @ 8:00 am – October 28 @ 1:00 pm
October 26th – 28th, 2018 (Friday through Sunday)
Alan’s presentation: Saturday October 27th at 9:30 AM
Visit Alan, Barry and the BCI team in the exhibit hall Friday, Saturday and Sunday
Market tone
This week’s economic news of importance:
- Home builders’ index September 67 (67 last)
- Housing starts August 1.282 million (1.249 million expected)
- Weekly jobless claims 9/15 201,000 (208,000 expected)
- Philly Fed Index September 22.9 (19.6 expected)
- Existing home sales August 5.34 million (5.37 million expected)
- Leading economic indicators August 0.4% (0.6% last)
- Household debt Q2 2.9% (3.2% last)
- Markit manufacturing PMI Sept 55.6 (54.7 last)
- Markit services PMI September 52.9 (54.8 last)
THE WEEK AHEAD
Mon September 24th
- Chicago Fed national activity index August
Tue September 25th
- Case-Shiller home price index July
- Consumer confidence index September
Wed September 26th
- New home sales August
- FOMC announcement/projections
Thu September 27th
- Weekly jobless claims 9/22
- GDP revision Q2
- Durable goods orders August
- Pending home sales August
Fri September 28th
- Personal income August
- Consumer consumption August
- Core inflation August
- Chicago PMI September
- Consumer sentiment September
For the week, the S&P 500 moved up by 0.85% for a year-to-date return of 9.58%
Summary
IBD: Market in confirmed uptrend
GMI: 5/6- Bullish signal since market close of July 9, 2018
BCI: Selling an equal number of ITM and OTM strikes for new positions. Tariffs still a concern with an eye on the upcoming Fed meeting.
WHAT THE BROAD MARKET INDICATORS (S&P 500 AND VIX) ARE TELLING US
The 6-month charts point to a bullish tone. In the past six months, the S&P 500 was up 7% while the VIX (11.68) down by 20%.
Wishing you much success,
Alan and the BCI team


Alan,
My friend owns UVXY and its down a lot. Asked me for advice. I think he should cut his losses, but not sure why there was a reverse split here. Hoping you can help.
Thanks,
Frank
Frank,
This is an exchange-traded fund (ETF) based on market volatility (VIX- CBOE Volatility Index). There are options based on VIX but no “VIX stock” per se. As a result of an unfortunate demand for “VIX securities”, products like this have been created.
There are very few professionals who understand these products, let alone retail investors. Let’s start with this: they go south in the long run (see chart below). This explains the reverse splits which these products are known for. By leveraging reverse splits, the price looks hearty to retail investors and they can maintain their listing status on major exchanges. The reality of its price performance is in the charts which don’t lie.
Since there is no VIX spot market, these products are based on VIX futures contracts…the 2 near month contracts. They target daily returns, not long-term returns so the front month contract is constantly being sold and replaced with the far month contract which usually is worth more (called being in “contango”). This means the ETF is selling low and buying high constantly except in rare scenarios (maybe 12% of the time will this work in favor of the share-holder). Since this is a leveraged ETF seeking 1.5 x returns of the futures contracts, there are margin fees, administrative ETF fees and cost to roll contracts costs that result in a negative drag on the price of the security.
There are very few retail investors that will benefit from this security in the long run. There are rare exceptions.
I hope this helps your friend and others who are considering volatility products.
CLICK ON IMAGE TO ENLARGE & USE THE BACK ARROW TO RETURN TO BLOG.
Alan
Hi Frank,
I am very familiar with products like VXX and the leveraged UVXY. Your friend may be a very knowledgeable investor who took an educated risk owning UVXY. He would be one of rare few retail investors who do that. Most buy it because they see flashy returns when VIX spikes. But they do not truly understand the inner workings of the instrument.
I will state my opinion in stronger terms than Alan did his: these two products have NO place in any retail investor’s portfolio for any period of time beyond a week or two and only if you have high confidence you can time a VIX spike/ big negative market event or anticipate one. Maybe hold a little for something like a Brexit vote or Mid Term elections but get the heck out thereafter whether up or down. These are speculative short term trading vehicles with design features completely unsuited to be investments. – Jay
Alan and Jay,
WOW! Thanks for your detailed responses. I’ve shared your posts with my friend who can’t wait for Monday to dump his shares.
Frank
Hi Alan,
your article confirms mi belief in selecting stocks and respective options which offer me at least 2% ROO, preferably with some protection, and sometimes with up potential.
The market has been bullish for almost 10 years, and I truly believe that the American economy will continue to keep growing and help the market to go up for several years to come.
But I adjust my trading to your weekly summary, IBD, GMI, and most importantly the BCI relationship of ITM/OTM trades.
Anyway, my risk tollerance keeps me NTM most of the time.
Thanks for your guidance – Roni
Good evening Roni,
Hope you and all other friends had a great September expiry! As usual the market fooled me. I played it too conservatively. My October line up is also conservative so maybe I am just not getting the message :)?
I have covered my tech positions for the first time ever, covered the usual stuff like gold and treasuries and even covered some health care positions. I had been letting tech and health care run for a while. I did not cover banks, defense or industrials for October. I covered what little I have in consumer discretionary. I sold 1 crazy csp contract 12 points OTM on GWPH for $510 just to play the pot game but not inhale (an obscure joke only political trivia buffs up here will get!)
I look forward to the new expiry. I hope everyone has a nice Sunday and a profitable week ahead. – Jay
Hi Jay,
Got the reference to “Slick Willy”.
Good luck,
Hoyt T
Got, it as well!
Barry
Hi Jay,
obviously, being so far removed from the US, I did not get the joke, but it contains some logic.
As for expiry weekend, I did extremely well, 4%. A record breaker.
I’m 75% in cash, and will have to work hard to reinvest it all in the next few days, equal number ITM and OTM (alwais following the BCI summary).
There are only 5 bold tickers on Barry’s list today, but I will risk some of the ITM trades on other eligibles. Must stay in the game, as this is the last cycle before ER season.
Roni
Roni,
Back in the 90’s Bill Clinton was asked if he had tried pot and he said “Yes, but I did not inhale”. Everyone thought that was pretty ridiculous and the comedians had a field day with it!
Earnings start this expiry from 3rd qtr so that no doubt limited list selections. – Jay
Ah …Ok, yes I do remember that ha ha ha. Perfect.
Roni, I neglected to congratulate you on your record breaking 4% Sept expiry – great job! Wishing you many more: records are made to be broken!! – Jay
Thanks Jay
Premium Members,
This week’s Weekly Stock Screen And Watch List has been uploaded to The Blue Collar Investor Premium Member site and is available for download in the “Reports” section. Look for the report dated 09/21/18.
Also, be sure to check out the latest BCI Training Videos and “Ask Alan” segments. You can view them at The Blue Collar YouTube Channel. For your convenience, the link to the BCI YouTube Channel is:
http://www.youtube.com/user/BlueCollarInvestor
Best,
Barry and The BCI Team
barry@thebluecollarinvestor.com
Am curious about why you offer a covered call trading service and not a put selling service? Is selling covered calls inherently better than writing put credit spreads or cash secured puts? I know there are a lot of moving parts and may not be a simple answer but am interested in know what your take is?
Thanks,
Tom
Tom,
Our service is for both covered call writing and selling cash-secured puts as well as some related strategies. If you check our free Beginner’s Corner tutorials, our store items and blog articles and videos you will find information on both covered call writing and put-selling.
I believe that money can be made with both strategies as we are on the sell-side of options where our cost-basis is lowered.
As far as our stock screening service, the same stocks (and ETFs) that are appropriate for covered call writing are precisely the ones appropriate for put-selling.
Alan
Trading Experiences – Expiration Friday 9/21
Jay, Hoyt, Roni,
Glad to see the Blog chatter and many new members chiming in with questions.
*****
Roni, Congrats on the good numbers for Exp Fri 9/21. More on mine later.
*****
Jay – Unless I am wrong, Earnings Reports coming up in the future does not determine whether a symbol is in the run list. The fundamentals, technicals, and other BCI selection / common sense criteria are the main factors. Those with Earning Reports are then tagged.
*****
Data Analysis – Stocks and ETFs
I analyzed the Run Lists for Week1 (8/17) and Week 5 (9/14) of this past cycle. (I use Finviz to enter the Run Lists coded in unique ways to help in my trade selection.) I then compared Expiration Fridays Last Price to see where they stand as to profit or loss for the cycle. I can conclude that those that used the Run list for Week 1 would end up most likely with Gains instead of a net loss, though by fate, if you picked the wrong set of stocks, you would end up with an overall loss.
Here is the data:
**Week 1 (8/17)
36 Listed (no earning report in cycle).
A. 21 had mixed technicals. Of the 20, 6 had price losses, and 3 had losses >2% (TNET, PGTI, ASGN).
B. 15 had positive technicals. Of the 15, 6 had price losses, and 4 had losses >2% (EHC, CBPX, QDEL, ATKR)
Compare the above with Week 5 (9/14), which had not so favorable results. It also helps to explain why the latest run list (9/21) has only 25 stocks listed.
Data:
Week 5 (9/14)
43 Listed (no earning report in cycle).
A. 28 had mixed technicals. Of the 28, 19 had price losses, and 15 had losses >2% .
B. 15 had positive technicals. Of the 15, 9 had price losses, and 7 had losses >2%
ETF Analysis:
I updated cost prices in my ETF Report Finviz portfolio to the Last price on around 8/15 and then looked at the current Last price on Expiration Friday 9/21. Here are the results:
20 ETFs listed. Of the 20, 5 had losses and 3 had losses > 2% (XLU, AMJ, XLRE). Between the 5 weeks in the cycle, believe me, there were significant swings for some of them.
*****
Performance:
I noticed earlier that Hoyt mentioned that he was using collars to act as a hedge to protect his hard earned money.
Having been with Alan 30 months now the possibility of a bearish turn of the market is also my concern. Particularly with my hard earned 24% gain in 2017 and 16% gain in 2016 in the nice rising market we had then and using Alan’s methodology with position management, some mistakes, a learning curve, and being 92% invested each month.
The first half of the year performance has been lackluster (still beating 2.5% CDs) . I would like to protect the overall gains to date since I am now retired (since 2013) and you never know what happens in the future, though my long term care plans for me and my wife will help (I have other funds in low risk buckets).
After my needed two week vacation to Nova Scotia last month (protective puts in place), I am starting to be more defensive in my trading (1.5% goals, good breakeven points, ITM positions, setting 20/10% rules with open order), or at least I am trying to do that. I tried something different this cycle, trading only ETFs with good results and even hitting a double (EWW). This was less time consuming and allowed me to take care of other important things I need to do.
Data:
4 Accounts Portfolio (Indiv. and IRA, two brokerages, Etrade, Fidelity):
Expiration 9/21 cycle: 2.45%. Year to Date 2018: 3.04% (IBB, EWW, XRT XBI, MJ). 2017: 24% 2016:16%
Joint Trust Portfolio (ETF only):
Expiration 9/21 cycle: 2.97%, Year to Date: 3.51% Since inception 5/2017: 10.25%.
*****
Assignments:
Interesting to note the I started Expiration Friday 9/21 to find out several positions were exercised by the Call holders on 9/20. By coincidence the Ex-Dividend date for the following fell on 9/21/18: XLF (Dividend payout .1275), XRT (.1594), and KBE (0.2249 ) fell on 9/21/18. Seems risky for those low payouts instead of selling the call for some time value (not zero). Hopefully the Call holders immediately sold their stock positions.
I was unaware of the above Ex-dividend date (my error, but the assignment was not harmful to me), otherwise I might have rolled out on Thursday to avoid the assignment.
I was also exercised on 2 of 3 positions with ETF MJ Strike 37, which was Deep ITM but does not pay a dividend till around Nov. 2018. The ETF dropped 8.19% (still ITM) on Friday. So this by did not make sense since the call holder could have sold the call instead on 9/20 and not take the risk of stock ownership and 8% loss on 9/21..
Mario
Mario,
WOW!!
Impressive research. It will take me a while to reread three or four times. That’s about par for me these days.
I am turning less bullish, not bearish, just less bullish. I think I may have shared on this site before that on 01/26/18 in my trading account I was up 16.25% for the year. This followed an exceptionally good year in 2017. Since my trading account, high six figures and sometimes low seven figures, is tax qualified I have two sets of return numbers. Before RMD, 39.35% in 2017, and after RMD, 34.99% in 2017. The S&P 500 was up 22% in 2017.
As of June 29, 2018, last trading day of June, I was only up 0.11%. As of 08/31/18 I was up 15.28% and as of 09/21/18 that had fallen to 14.42%.
I say all this to illustrate how schizophrenic both the market and I am. I believe November will settle the issue and if, in fact, markets do look ahead, we may see what will be the effects of November before then.
I have several LEAPS, some expiring in 2020, that I have been using in what is called PMCC. I am considering closing those positions, and taking my profits, as I now believe we will be in a bear market by that time.
Now please understand that I have historically taken more risk than the average bear, pun intended. These were calculated risks but even calculated risks are still risks. With a more risky approach comes the potential for out sized gains or losses.
I am now reducing my risks.
I tend to think that the more conservative approach today is using ETFs for covered call writing. I seem to get that reaffirmed from your post. Is that an accurate read?
Again, thanks for your sharing this info. I really appreciate all the hard work and intellectual curiosity that went into this post.
Hoyt T
Trading Experiences
Hoyt,
Thanks for the comments. I see your first half of this year correlates with mine. Interesting your trading with PMCC. Have you had any impact from Underlying price changes impacting the value of your long call in any of your positions?
****
I have the issues with my RMDs. I take them out on 12/15 each year. I reinvest part of them that I retain and the rest is part of our joint yearly budget. The RMDs really help out since it helps to meet our budget after including our two social security amounts.
In fact, after some analysis, I avoided getting an immediate annuity to meet my budget goals. Not everyone can do that and salesman do not suggest that since the want you to invest a lump sum of your money to guarantee a steady income stream, whether you need it or not for your budget.
My dear mother, on the other hand, invested in 4 10 year immediate annuities which payed a steady monthly income stream while she was in her 60-70s and outlived all of them after 10 years and passing at 95 (2015). She had a $33,600 yearly income including social security, Very useful when she moved to Independent living near us at 92.
*****
ETFs:
ETFs have no earnings reports to worry about.
They average the effects of multiple underlying equities.
Implied Volatility varies for each ETF. Most are under 22% 20 day volatility;
MJ 67%, IBB 13.1%, KBE 13.1%, XBI 19.2, KRE 13.6 for example. The ETF report lists volatility figures.
They rise and fall in price with the market swings of each industry. I am staying away from Oil, Metals, Mining as they hurt me significantly the first part of this year. They were in the run list but headed south for me many times.
Some definitely trade in ranges. For instance I purchased KBE 12/27 and kept it trading Strike 48, 49 over the 9 month period. It was assigned and sold last week. Net gain was 9.57%. I do not trade KRE (regional bank) since it has larger price swings.
I bought EWW Mexico last cycle. Went down just after I bought, then recovered, Hit a Double (set an STO order and in a spike in price at market open it filled), and it is has maintained its value since then..
Good luck with your trading.
Mario
Mario,
Yes, Underlyings price changes have impacted the value of my leaps. I don’t quite follow the BCI methodology of PMCC. I have a difficult time finding Underlyings that meet the formula. What I do is buy LEAPS of issues that I feel will outperform the market over that time frame. I usually buy something that is an uptrend but is having a retracement to its 30 day moving average. Some of them I sell calls on, some I do not because the calls are too cheap.
MFST(+331%), SQ(+288%), BAC(+161%), WDAY(+44%), IMMU(+29%), CSCO(+20%) still holding these LEAPS. The number of contracts vary from 10 on MFST to 2 on WDAY. Also have pretty large long position in BAC which I started acquiring in 2011. My average cost basis is $9.41. BAC has not performed as I had hoped. Hanging on still expecting interest rates to add some real gains. Dividends have begun to increase.
LEAPS losers sold were MLCO(-73%), KRE(-70%), BMY(-59%), WB(-50%).
LEAPS still holding INTC(-26%), WMT(-61%), also long WMT(-9%).
All losers are examples of my not following my rules. On MFST, SQ and BAC I have taken out my original investment. Followed my rules there. Pondering whether or not to close these out or, at least, reduce positions.
Our personal situations are similar. My wife, of 58 years, and I both draw SS maximums and have substantial RMDs from my trading account and both of our passive accounts. My mother, 97, has dementia and has lived with us for 14 years. We have two caregivers who care for her seven days a week. My mother is not confrontational and is easy to care for. Thank God! I continue to help fund my grandchildren’s retirements with the program I have described in previous posts.
While I know that annuities work for some folk I am basically with Ken Fisher on them. Fees and commissions are too high. They are almost impossible to get out of and usually you can accomplish the same thing in a different way. I am not an expert on annuities. But I couldn’t live with myself if I sold them for a living.
Your analysis of ETFs is spot on.
Good luck with your trading too.
Hoyt
Mario and Hoyt,
I appreciate the depth and breadth of investing experience you bring to the community. Plus it is nice to have not only smart friends here but kind ones who look after generations of family.
As Mario did I would like to extend welcome and reach out to new friends here. It would be great to hear more about your experiences. Please brag, cry in your beer but don’t be wallflowers :)!
I see the pictures from Alan’s workshops. My hunch is most people here have a wealth of experience to draw on and comment about. Plus if you understand and use options selling that likely distinguishes you from 95% of our retail investing peers!
Alan, please correct me if that % is too low :)? – Jay
Thanks Mario
All,
Getting Your Child Into the Habit of Saving | Morgan Stanley
https://www.morganstanley.com/articles/back-to-school-savings-tips-goalsetter
Who knew??
Hoyt
To all,
after several hectic days, I fimally had a moment to read carefully all the above posts.
I am very impressed of your expert handling of the options trading craft.
I wish to congratulate the success stories, and hope you will continue like this for several years.
Good luck to everybody – Roni
Premium members:
This week’s 8-page report of top-performing ETFs and analysis of ALL Select Sector Components has been uploaded to your premium site. The report also lists Top-performing ETFs with Weekly options as well as the implied volatility of all eligible candidates.
New members check out the video user guide located above the recent reports.
For your convenience, here is the link to login to the premium site:
https://www.thebluecollarinvestor.com/member/login.php
NOT A PREMIUM MEMBER? Check out this link:
https://www.thebluecollarinvestor.com/membership.shtml
Alan and the BCI team
Alan:
I am enjoying being a CEO of my own retirement. So far I am a member for 2 months and am doing well. Averaging hi 2 percents (2.8 and above) with mitigation of some stocks that went a bit down.
My question for today: Market Direction is important and the Weekly sheet starts out w/ a summary of market news. But do you use particular indicators to determine if the market is bullish/bearish/neutral? I am trying to figure out a good way of “biasing” my stocks and the position of my call sales.
Thank you for an informative and very helpful site. It is helping me independent!
Glenn
Glenn,
Welcome to BCI and good luck with your trading.
For a discussion of what indicators or other factors are used to assess the Market Tone, see Pages 254-255 of Chapter 10 (Exit Strategies) of the Vol 1 Classic Complete Encyclopedia. It includes a discussion of the CBOE Volatility Index and the S&P 500 index. It was good for me to review it. The weekly Premium Report includes the current values and trend for those indexes.
The Vol 2 Encyclopedia, which I purchased this year, also discusses in several places the VIX and Market Volatility and ways to manage it using Covered call writing.
I also did a custom search (top of the blog) using the following search string (include the quotes) or similar searches and found lots of good information dating back to 2012:
“market tone” volatility
Regards,
Mario
.
Alan,
In one of your older articles on SeekingAlpha I found that you sell covered calls on QQQ, so you probably have lots of experience with this ETF. I’m thinking of selling weekly (1-2 weeks) covered calls on QQQ. Maybe you could share your thoughts how to act if the share price declines from purchase price. For example we buy QQQ at 185 and sell weekly call ATM and at expiration the stock price declines to 183. We keep the shares and are free to write new call. My question is what would be the better strategy, ‘hold the strike’ and sell 185 call sacrificing some premium or sell, let’s say, 183 ATM with higher premium but have a risk to get assigned with a loss. I understand that it depends on how we see the market, but I doubt it’s possible to time such short market moves correctly. The premise is the markets will reach new highs with time. I plan to paper trade both strategies, but it would be great to get your opinion on this.
Thanks,
Sunny
Hi Sunny,
I can’t speak for Alan but I can give you my two cents! I have held a pile of QQQ for years. Perhaps my best performer. I never dreamed of holding it back with a covered call. Until now. I covered half of it at $186 for about a percent and a half.
I hate to be bearish but these don’t seem the best of times, -Jay
Sunny,
Like Jay, I’ve had substantial success with this ETF over the years, mainly in my mother’s portfolio although it has made its way into one of my option portfolios from time-to-time. I use mainly individual stocks. As far as ETFs for option-selling, it does stand out as one of the best a good deal of the time.
Let me offer 2 thoughts for your consideration.
1. Strike selection is based on initial time value return goals, personal risk-tolerance and chart technicals. Let’s say our goal is 26% per year and we are selling Weeklys. That computes to 0.5% per week for our time value returns. Then we determine “moneyness” of the strike where OTM is more aggressive. Use the multiple tab of the Ellman Calculator to calculate the appropriate strike to select based on these parameters and then move immediately to “position management” mode. The strike selection is based on the security price at the time the trade is initiated.
2. I believe we can make money and beat the market with both Weeklys and Monthlys. Make sure pros and cons of each are mastered before implementing the strategy. As an example, Weeklys may generate higher annualized returns (maybe), but cost us 4 – 5 times the number and amount of commissions.
Alan