Utilizing a portfolio of mutual fund investments is a topic I have addressed in my book, Stock Investing for Students. Investing with these securities represents a longer-term investment plan than covered call writing and selling cash-secured puts. A significant number of retail investors use financial advisors to select various mutual funds for their portfolios in hopes of generating the highest possible returns. In exchange for their management skills and guidance, these advisors are paid a commission frequently based on a percentage of the net worth of our portfolios, usually between 1-2%. Let me premise this article by stating that there are many outstanding financial consultants who are worth every penny of the fees we pay them. I understand that there are hard-working retail investors who would prefer to have a professional manage their hard-earned money. I get it. However, I will never stop stressing the importance of educating ourselves to the point where we can at least evaluate the performance of the investments these advisors have put us in and therefore the success or lack thereof of our money managers. In this article, I will highlight one approach to such an evaluation process to generate a “report card” for the mutual funds in our portfolio and therefore for our wealth managers or ourselves if we selected the funds. First some definitions.
Definitions
Mutual Fund: Mutual funds are investment vehicles that allow us to pool our money together with other investors to purchase a collection of stocks, bonds, or other securities that might be difficult to recreate on our own.
Actively-managed Mutual Funds: These funds utilize the human element, such as a single manager or a team of managers, to actively manage a fund’s portfolio. They depend on analytical research, forecasts, and their own judgment and experience in making investment decisions.
Passively-Managed Mutual Funds: These funds operate the opposite of active management, better known as “indexing”, where a fund’s portfolio mirrors a market index. They are normally associated with low operating expenses and low portfolio turnover.
Developing our “report card” for our mutual funds and financial advisors
If we are paying a fee (well-deserved in many cases) to our advisors, then we would expect that the actively-managed mutual funds selected for our portfolios would out-perform index-based mutual funds (“the market”) by at least the amount of the fees we are paying them. If this is the case, these specialists are worth their weight in gold. However, if the funds are under-performing the overall market performance, should we not re-evaluate who we are trusting with our hard-earned money?
The Kip 25
In May of 2015, I read an article titled Kiplinger’s 25 Favorite No-Load Funds. A no-load fund is a mutual fund in which shares are sold without a commission or sales charge. The reason for this is that the shares are distributed directly by the investment company, instead of going through a secondary party. The article is typical of other such financial advisory publications. The goal of this article is to show a 1-year performance comparison of this list of actively-managed mutual funds to a broad market benchmark index fund. For the benchmark fund, I have selected Vanguard 500 Index Fund Admiral Shares (VFIAX). I made this selection based on the facts that the S&P 500 is universally accepted as a reflection of the broad “market” and Vanguard funds generally have very low expense ratios (low administrative costs).
Price chart analysis
I charted each of the funds in the KIP 25 against the Vanguard benchmark fund to generate 1-year price performance percentiles. Here is a screenshot of the best-performing fund (FNMIX), the worst-performing fund (PRSVX) and the benchmark (VFIAX).

Mutual Fund Comparison Chart (Investools, Inc.)
Our brokerage sites may have the tools for comparison charts or free sites like www.stockcharts.com (Perf Charts).
Spreadsheet showing all 26 1-year returns
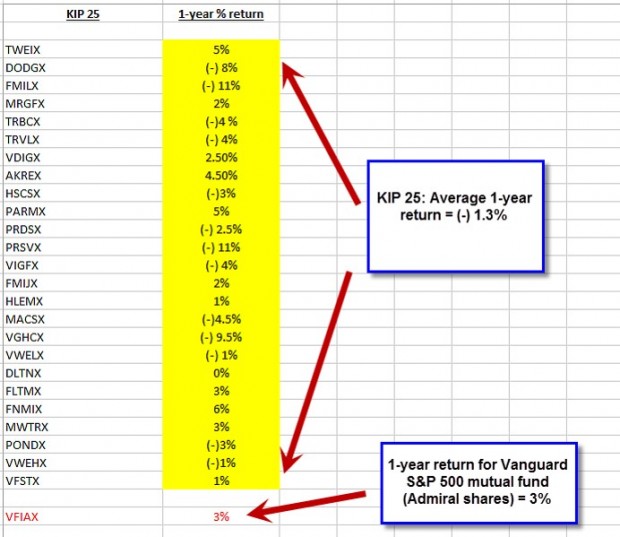
Kip 25 versus the S&P 500 Benchmark Fund
The spreadsheet shows that, over a 1-year time frame, the KIP 25 declined in value by 1.3%, on average. In that same period, the benchmark index fund appreciated in value by 3%.
Discussion
This exercise is in no way a commentary on Kiplinger Advisory service. It is fair to assume that competent advisors would move clients in and out of funds as new information becomes available. However, it is fair to say that this brief exercise does highlight the importance of having the ability to evaluate the performance of both our securities and that of our advisors. Generally, index funds with low expense ratios will outperform actively-managed mutual funds although there are exceptions to this rule.
Upcoming live events
1- January 26, 2017
9 PM ET
Blue Hour webinar #4
“The Poor Man’s Covered Call”
Free to premium members
We will analyze the use of LEAPS options instead of buying stocks to enter a covered call trade at a much lower capital outlay
This is a must-see presentation
2- February 27, 2017
Marriott Marquis Hotel, NYC
1:30 PM ET
Exhibit Hall Booth 208 (February 26th – 28th) … come say hi to the BCI team
3- March 21st and 22nd, 2017
Two live Florida events (Fort Lauderdale and Delray Beach)
More information to follow
Market tone
Global stocks extended gains this week assisted by upbeat economic data and continued hopes for US fiscal stimulus. Oil prices solidified, with West Texas Intermediate crude rising to $53.90 from $53.25 before the holidays. The Chicago Board Options Exchange Volatility Index (VIX) was little changed at 11.28. This week’s reports and international news of importance:
- The United States added 156,000 new jobs in December while the unemployment rate edged up to 4.7%
- A 2.9% annual rise in average hourly earnings was the most significant aspect of Friday’s report. It was the largest yearly gain in wages since 2009. Rising wages, could negatively impact corporate earnings down the road and may keep the US Federal Reserve on guard for additional rate hikes in the months ahead
- The US reported a wider trade deficit on Friday, with a fall in exports likely to trim economic growth estimates for the fourth quarter. The deficit expanded to $45.2 billion in November, a nine-month high, from $42.4 billion in October
- Solid purchasing managers’ surveys from December were reported early this week, suggesting that the uptick in global growth seen in recent months continued through year-end
- The US reported its 91st consecutive month of manufacturing growth, with the Institute for Supply management index rising to 54.7 from 53.2
- The United Kingdom’s manufacturing purchasing managers’ index rose to 56.1, the highest in two and a half years
- The weaker euro helped boost the eurozone PMI to 54.4
- China’s Caixin PMI, which focuses on small and medium-size companies, rose to 51.9, its highest level since January 2013
- Global auto manufacturers sold a record-setting 17.55 million new cars and light trucks in the US in 2016, according to research firm Autodata
- For the first time in nearly three years, Australia recorded a trade surplus in November
- Many US retailers struggled this holiday season as sales continued to migrate to the Internet. Two notable cases were Macy’s and Sears, traditional anchor tenants of US shopping malls, which each announced the closure of more than 100 stores
THE WEEK AHEAD
- Monday January 9th: Consumer credit, Eurozone unemployment stats
- Tuesday January 10th: Wholesale inventories
- Thursday January 12th: Weekly jobless claims, Federal Budget
- Friday January 13th: Retail sales, producer price Index, consumer sentiment and business inventories
For the first week in 2017, the S&P 500 rose by 1.71%.
Summary
IBD: Market in confirmed uptrend
GMI: 5/6- Buy signal since market close of November 10, 2016
BCI: I am currently fully invested and have an equal number of in-the-money and out-of-the-money strikes.
WHAT THE BROAD MARKET INDICATORS (S&P 500 AND VIX) ARE TELLING US
The 6-month charts point to a moderately bullish outlook. In the past six months, the S&P 500 was up 9% while the VIX (11.28) declined by 25%.
_____________________________________________________
Wishing you the best in investing and a HAPPY NEW YEAR,
Alan (alan@thebluecollarinvestor.com) and the BCI team
Premium Members,
This week’s Weekly Stock Screen And Watch List has been uploaded to The Blue Collar Investor Premium Member site and is available for download in the “Reports” section. Look for the report dated 01/06/17.
Also, be sure to check out the latest BCI Training Videos and “Ask Alan” segments. You can view them at The Blue Collar YouTube Channel. For your convenience, the link to the BCI YouTube Channel is:
http://www.youtube.com/user/BlueCollarInvestor
Best,
Barry and The BCI Team
Alan
I’m really enjoying the training and the book as well !
Couple of questions:
I get the concept of selling otm calls, but i’m having a hard time understanding the itm calls and why one would choose that option. Aren’t you likely to get called away sooner because its already above that price to begin with, then their would be no profit. Is that a strategy to employ when you ‘want’ to get assigned?
I’m sure I’m missing something. ( I’m not a straight-line learner!)
Also I’d like to know your thoughts on “poor mans covered calls”. Isn’t that a strategy to collect premium while not having to put up a ton of capital, maybe for a smaller account?
Alan.
I guess you’re probably making money on your education business, which is awesome! But i definitely get the sense that you love humanity and that you have a ‘heart of gold’
I look forward to getting a full handle on these concepts and continue on my journey.
best regards to you and your family,
steve
Steve,
ITM strikes are used when additional downside protection is needed. I use these in bear and volatile market environments or when chart technicals are mixed. Early assignment is extremely rare because the option holder (buyer) can make more money selling the option rather than exercising and then selling the stock. The time value component of the premium will be lost on early ecercise. We are not necessarily using ITM strikes when we want assignment.
I have been receiving a lot of inquiries about “The Poor man’s Covered Call” This is why I have made it the topic for our next Blue Hour webinar. The information currently available on this topic simplifies the strategy and paints it in a more favorable light than it deserves, in my humble opinion. That’s not to say that it is not a viable strategy for some but all nuances must be understood before moving forward. Generally, it is described as a lower investment/higher return on capital strategy. That will all change on January 26th when I present our Blue Hour webinar #4.
Thanks you so much for your generous comments. I love what I do and feel extremely fortunate to have so many motivated members interested in self-investing and grateful to a team that continues to make me look good.
Alan
Hi Alan,
exactly 4 years ago I wanted to know what happens if I place my money in a mutual fund.
My bank contact offered some funds, and I chose American Income Fund, and placed $50,000.00, actually 51,500.00 with the intial fee they charged.
Today my statement shows : total current account 55,806.71.
So I believe I gained an average of 1,077.00 per year = 2%.
Not very briliant, is it ?
Roni
Roni,
What’s most important isn’t what we didn’t know then but rather what we know now…it’s all about the education and thanks for being part of our BCI community.
Alan
Roni,
Because of human nature most of us are more likely to lament lost opportunities than celebrate gains. I kick myself all the time for not matching SPY or missing what in hindsight was a great buy or sell opportunity even if I made a buck in the process!
But I also read about people who lost big money and blew up their accounts day trading, swing trading or options speculating failing to realize they lacked the knowledge, temperament and computer power to avoid getting crushed by the pros and their computers.
You did not do any of that. You put a reasonable amount in a conservative fund and still have both your principle and a gain to show for it. Plus you are smarter now than you were then :)!
I bet there are millions of investors around the world who would trade places with you in an instant :). – Jay
Thank you Jay for your always kind and helpful words.
I do agree with you, and would like to add that in the last 6 years, since I first started to invest in the stock market, the most important lesson I learned is that “missed oportunitiy” is not worth fretting about.
The trick is avoiding big losses, because big losses REALLY hurt.
That’s why I love Alan’s system : Low risk and consistent gains.
An average of 2% per month is a huge gain when compared to mutual funds.
Cheers – Roni
Jay and Alan,
ALGN is recovering nicely, now at 96.30, which proves that my decision to sell last Friday at 94.00 taking a 3.3% loss, was a bad decision. 🙁
Too bad. I should have waited a little longer as you said, and hit a double.
Hindsight is the best sight.
I must increase my risk limit to 4 or 5% in future similar cases.
No pain, no gain – Roni
Roni,
I was thinking about you when I saw ALGN bounce back. But there is no reason to second guess yourself. it could have just as easily gone the other way. You made a smart trade within your risk tolerance and everyone should learn how to do that!
The only reason I suggested you not sell was it closed at it’s 50 day MA Friday, has been a good stock in a rising sector in a rising market and chances were favorable it would find support there, which it did.
I have always found it helpful to not look at individual stocks in isolation unless there is important news like earnings or legal action. It’s likely the small dip in ALGN was normal profit taking. Just a bummer it happened shortly after you bought it :)!
It usually helps to take three steps back and think about what is going on with a stock technically, what it’s sector is doing and what the broader market is doing before making buy or sell decisions. My two cents, anyway. – Jay
Hi, Alan
The chart for PRSVX shows a large (-19%) drop near the end of December. That usually indicates that a dividend or capital gain was distributed, and is not a loss. Many charting aites do not take this into account, and it grossly distorts performance, moving averages, etc. I wonder if you took this into account? If not PRSVX may have a large positive gain for the year, masked by this distribution.
Hal,
The analysis was based on a charting comparison without looking into the reasons for the price declines or accelerations. However, after reading your comment, I did a cursory check for a 1-time special dividend distribution and couldn’t find one (still possible but I couldn’t uncover it if it did occur).
I also used a second charting service (see below) showing the same results. Now, the price decline started at the beginning of December as you pointed out but also lasted through the middle of February, 2016 (yellow field). It appears NOT to be a 1-time gap–d event. After that, there has been a price acceleration (yellow field).
Even if we eliminate one fund on the high end and one on the low end, the general results will remain the same.
CLICK ON IMAGE TO ENLARGE & USE THE BACK ARROW TO RETURN TO BLOG
Alan
In your analyzing the KIP 25 annual growth rates; Instead of the “Vanguard 500 Index Fund Admiral Shares (VFIAX),” would it be reasonable to instead consider the SPY ETF for growth comparison?
SPY is liquid, trades heavily, has options expiring twice/week. And one can use almost the same words to describe QQQ and IWM. Would these points make these Index ETFs a simpler and more direct way to invest than using a mutual fund?
Am I missing something with the simplicity of investing in and option trading with the SPY ETF vs. the VFIAX mutual fund?
David
David,
Absolutely, SPX can be used as a substitute for VFIAX for comparison purposes. The results will be precisely the same as shown in the comparison chart below.
Since this was an article referencing mutual funds, I used a broad market index mutual fund for comparison purposes. Now, if we were incorporating options into our strategy, then we would have to use an ETF because (as you know) mutual funds have no associated options.
For comparison purposes, you make a good point that SPX and VFIAX are interchangeable.
CLICK ON IMAGE TO ENLARGE & USE THE BACK ARROW TO RETURN TO BLOG
Alan
Alan, Needing some help with a few questions here below:-
If I were to put on an ‘OTO order’ to close-out my position if the price dropped below a certain price, then is it possible for my whole order to be done straight away?,- like how long should I usually need to wait for a trade order to be completed?
I am wondering why on premium report does the liquidity of stocks only show the “O.I less than 100C’s”, but they have not included the 0.30c B/A spread requirement in this checklist?, – why not like just one tick or cross for them both combined?
Here last is a method I thought I could try:-
So if I have 2 stocks and the value = $10,000, then is it alright to search for 1 ETF up to a $150 price if I wanted to use up all of my $25,000 portfolio on all these 3 stocks/ETF?($10,000, + $15,000 from 1 contract in 1 ETF, – is this alright to do?)
I have usually just been papertrading all stocks and ETF’s up to a $50 price limit, but because sometimes there aren’t enough of both, or if technicals look too concerning for alot of them, then it would certainly be good to know if this method I proposed above is something suitable I could abide to?
Thanks for your help on this.
John
John,
My responses:
1- The best way to accomplish closing both legs of the trade is to use a broker that offers a buy/write combination trade execution form. Here is a link to an article I published on this topic:
https://www.thebluecollarinvestor.com/executing-covered-call-trades-the-buy-write-combination-form/
2- Bid-ask spreads are in a constant state of change. If we published the spread after market close on Friday, it may be irrelevant on Monday or Tuesday….we must check option chains before entering a trade.
3- Using a combination of stocks and ETFs to fund a diversified portfolio is absolutely feasible and I encourage it. This is one of the benefits of our premium membership is access to several different reports that can be tailored to meet a multiplicity of goals and trading styles…excellent observation.
Alan
John,
In addition to Alan’s response #2, another reason we haven’t included the $0.30 B/A spread is that in many cases, it is possible to “negotiate” the B/A spread with the broker.
You can read more about negotiating the B/A spread in some of the following BCI Blog articles:
https://www.thebluecollarinvestor.com/negotiating-the-best-prices-when-buying-and-selling-options/
https://www.thebluecollarinvestor.com/playing-the-bid-ask-spread-when-selling-covered-call-options/
https://www.thebluecollarinvestor.com/tag/bid-ask-spread/
https://www.thebluecollarinvestor.com/how-to-negotiate-better-option-prices-using-the-show-or-fill-rule-30-rebate-expiring/
Best,
Barry
Thanks Alan/Barry for those good replies and helpful weblinks.
When going back over your first reply where you say to use a buy/write combination trade, I am not sure if you think that this would make the trade execution faster than the OTO order I was to go along with?
So on this, when then is it better to use the OTO order instead?
Also what still if I can’t get to my computer, but still really want whole trade position closed out, possibly like if I think price will keep falling if it drops below a certain price point? (is a buy/write the best choice?)
Thanks
John,
The short answer is “it depends”. It depends on what your broker allows you to do. Most brokers offer some set of conditional orders. You will need to check with your broker to see what their order tools allow you to do.
Another solution is to download and use your broker’s mobile app on your smart phone. Most brokers allow you to set up emaiI alerts and you can then either call your broker to place an order with a live broker or execute your trade from your smart phone.
I execute trade orders from my phone on a regular basis.
Best,
Barry
Thanks Barry and yes I would have to agree there, to find out first what order tools the broker I choose to use will have.
I don’t have a broker as yet seeing as I am still papertrading.
A smartphone is a great item, something I am guessing I should need too, and is always handy if I can’t make it to my laptop!
Please explain the logic behind comparing the performance of the PONDX to that of the VFIAX (S&P500)!
PONDX contains NO stocks and is invested almost entirely on Bonds. The performance of the S&P500 Index has no bearing on the performance of the PONDX.
Blindly comparing the K-25 MFs to the S&P500 is inaccurate, without any regard to the makeup of these MFs.
Also your generalization of “Generally, index funds with low expense ratios will outperform actively-managed mutual funds” is also inaccurate. Yes, for the past bull run of 8 years the Index has outperformed the managed MFs. The purpose of a managed MF is the hedge that it offers against market down-turns. A well managed MF will have a better performance than the index during market downturn.
I would like to see what kind of press will passive indexed MFs will have during Bear Markeet!
Robert,
There will always be some actively managed mutual funds that out-perform low expense ratio broad market index funds…we agree on that. The challenge is to find those out-performers because past history doesn’t not necessarily predict future performance.
Why use the K-25?
I used a well-regarded advisor with a broad spectrum of actively-managed funds rather than selecting my own…”Alan-25″ Data for average equity mutual funds is addressed in John Boggle’s (founder and chairman of the Vanguard Group) “Common Sense on Mutual Funds” On page 112, 5 – 50 year comparisons were made of average equity funds versus index funds. For every time frame, index funds out-performed from 0.8% to 5.0%.
In bear markets, well managed mutual funds will outperform…this is possible but the time frames displayed in Bogle’s book encompasses all market conditions so although you make some valid points, we must put emphasis on what transpires in most market scenarios.
Actively-managed funds must overcome the higher administrative costs and that is a difficult mountain to climb. For those who can locate the winners, my hat is off to those investors and they deserve the extra returns.
I have always stated that there are a lot of ways to make money in the stock market and my way isn’t the only way. Some investors are more aggressive than I am, some less. Once the information is presented, investors can decide for themselves.
Alan
Great article! I wholeheartedly agree. It requires education and effort if you want to make sure an actively-managed mutual fund is performing better than the extra cost incurred by the investor. No one should blindly trust their finances to the opinions of another. The more you educate yourself, the more you know the how, what, and where of investing.