For the strategies of covered call writing and selling cash-secured puts, we are selling the right, but not the obligation, to buy or sell 100 shares of the underlying security. That security can be a stock or and exchange-traded fund (ETF). In this article, I will highlight ETFs and demonstrate a few approaches to funding our option-selling portfolios with these securities.
Pros and cons of ETFs
Pros
ETFs consist of a basket of stocks and, as a result, are instantly diversified to some extent. Therefore, to achieve appropriate portfolio diversification, we would require less cash to purchase the underlying securities. For individual stocks, the BCI guideline is that no one stock or industry should represent more than 20% of our total portfolios. Furthermore, ETF require less management because we are not concerned about earnings reports, so we can actually stay with an ETF indefinitely if it remains a top-performer.
Cons
Since ETFs are baskets of stocks (in most cases), some are going up in value, some down, so as an aggregate the implied volatility (IV) of the security is lower than that of a typical stock. A lower IV means lower option premiums so when using ETFs we should set lower goals for our initial returns. I use 2% – 4%/month in my portfolios with individual stocks and 1% – 2% in my mother’s portfolio with ETFs.
Considerations when selecting ETFs for option-selling
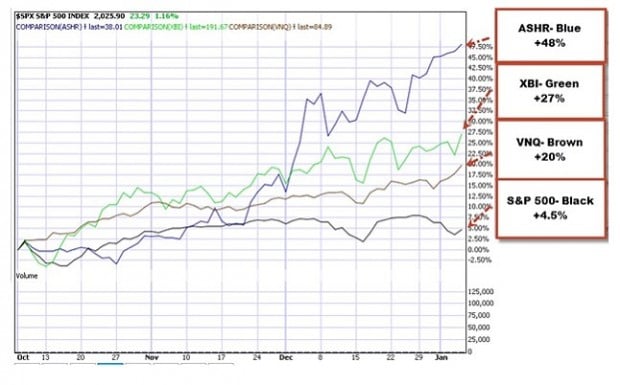
In the BCI methodology, we favor 1-month options (some members use weeklys and others longer-term options but most use monthlys as I do…all can work). Market segments fall in and out of favor with institutional investors so we want those currently in favor. As with stocks, we insist on minimum trading volume of 250,000 shares per day and adequate open interest for the associated options. To assess ETFs currently in favor, we compare the 3-month price performance to that of the S&P 500 and insist that the ETF is an out-performer with a relative strength (RS) rating greater than 60. In the chart below is an example of ETF out-performers taken from our Premium Members ETF Report (produced weekly for our members):
Exposure to the S&P 500 only
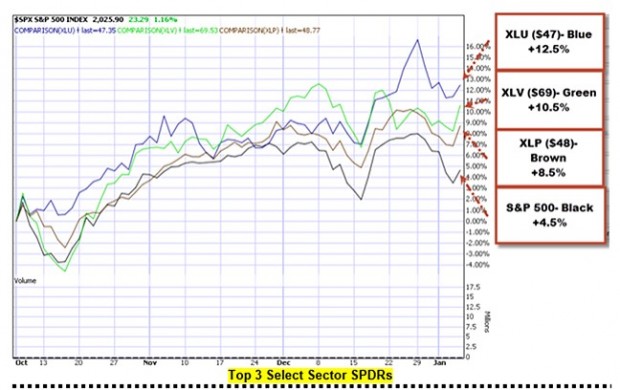
The Select Sector SPDRs are unique ETFs that divide the S&P 500 into 9 sector index funds. Many of our members use the current top 3 of these sectors to fund their option-selling portfolios as shown in the screenshot below taken from a Premium ETF Report:
Extreme bear market considerations
Although it is rare that we would resort to these securities (2008 was an exception), Inverse ETFs use derivatives to bet against the direction of the financial markets. These are also known as bear or short ETFs. Many have options associated with them as well as adequate open interest for the near-the-money option strikes. Since the market historically goes up in value in the long run, these securities historically go down in value but may have some value in unusual circumstances. Below is a screenshot taken from a Premium ETF Report showing the inverse ETFs under-performing the S&P 500:

Measuring ETF risk
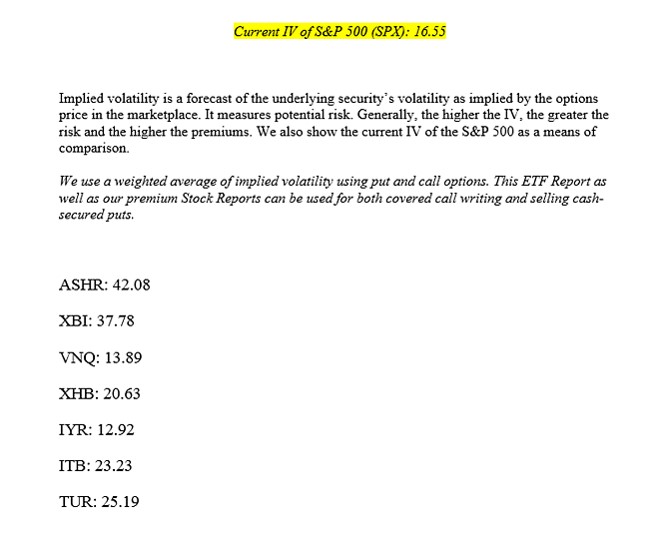
Although most ETFs have less volatility than individual stocks as stated earlier in this article, there is still a significant range in IV from one ETF to another. By looking at the implied volatility of an ETF and comparing it to the implied volatility of the overall market (S&P 500), we can make an informed decision as to the risk involved when using a specific security and whether it meets our personal initial goals and risk-tolerance. Below is a screenshot of part of the implied volatility section of our Premium ETF Reports (this information can be obtained for free @ www.ivolatility.com):
Summary
ETFs can represent a valuable security to include in a covered call writing or put-selling portfolio. There are advantages and disadvantages as with every approach but the selection process is as important as when using individual stocks. Initial return goals, time for management and personal risk-tolerance play vital roles in deciding between stocks and ETFs.
Next live seminar:
February 6, 2015
The World Money Show Orlando, February 6, 2015 at The Gaylord Palms
Friday February 6th
4PM – 6PM
New seminar just added
May 18th, 2015: Denver, Colorado
7 PM – 9 PM
Details to follow
Alan’s article published in the January edition of the AAII Journal
Market tone
Get the Dramamine! Market volatility caused by decreasing oil prices (good or bad?), concerns over the global economy and terror threats in Europe have caused investors to fear an upcoming bear market. The Swiss National Bank ended a program to support the euro vs. the franc, which disrupted the euro caused more volatility in the U.S. markets. However, after taking a deep breath, we see an expanding economy and flourishing corporate profits so perhaps cooler heads should and will prevail. Those who are inclined to stay in cash due to this volatility will note that the February contracts are 5-weeks long so staying on the sidelines for a week will still allow us to generate 4 weeks of time value on our option sales. This week’s reports:
- The Federal Reserve reported in its monthly Beige Book that from mid-November to late December economic growth was modest to moderate in 11 of its 12 districts (Kansas City…get with the program!)
- According to the Department of Commerce, retail sales declined by 0.9% from November mainly due to a 6.5% drop in gasoline sales. However, year-over-year stats were 3.2% higher than for 2013, a very positive number
- The Consumer Price Index (CPI) declined by 0.4% in December according to the Labor Department. This was mainly a result of a 4.7% drop in the energy index
- Removing the volatile food and energy sectors the CPI remained flat in December
- For 2014, the CPI rose by 0.7% and 1.6%, excluding food and energy
- Concerns regarding falling inflation may impact Fed monetary policy
- The Producer Price Index (PPI) declined in December by 0.3% mainly due to a 6.6% drop in the energy index
- For 2014, the PPI was up 1.1%, compared to the 1.2% increase in 2013
- Industrial production declined by 0.1% in December after a 1.3% rise in November, according to the Federal Reserve. The cause was decreased demand for utilities due to warmer temperatures. Excluding utilities, production actually was up by 0.7%
- Year-over-year, industrial production in December rose by 4.9%
For the week, the S&P 500 decreased by 1.2%%.
Summary
IBD: Uptrend under pressure
GMI: 2/6- Sell signal since market close of January 6, 2015
BCI: Cautiously bullish but favoring in-the-money to out-of-the-money strikes 2-1. Selling out-of-the-money puts is another way to navigate volatile markets.
My best to all,
Alan (alan@thebluecollarinvestor.com)
Alan,
I love how you give back and are truly focused on helping people. I am one of those that needs help and I plan to subscribe to your service when the time is right. I’ve watched almost all your videos and I am just now starting to paper-trade using the CBOE Virtual Trade tool. Boy is there a learning curve. Below, I describe one issue I have run into. I know I’m not a paying member yet, however, perhaps I’m not the only one running into this. Of course the problem goes away if the stock goes up in price. 🙂
If I buy a stock at $39 and sell the $40 call for $1.10, but then the stock gaps down 4-5 dollars, the $40 calls are still well above the 20% rule for buying them back at .47 but there I sit with a stock that has lost $500 just on 100 shares. If I roll down now, the cost to buy the call back cuts my profit on the call to about .60 per share or $60, but I have lost $500 in the value of the stock. Then, if I sell the 35 call, I make another $54 or so. $110 total income on premiums from calls but there is that $500 loss on the stock.
My point in all this is that if the stock falls low enough to apply the 20%/10% rule, you lose way more on the value of the stock. This all happened in the first couple of days of trading so the “time” value of the CC is still fully in place. To further complicate things, if the price of the stock rises a couple dollars, say, to 37 at expiration, my 35 call will be executed and I have to sell a stock at 35 that I bought at 39, locking in big loses.
I’m guessing the answer lies in not finding yourself in this situation by choosing good solid stocks with no earnings reports due, but even then a stock could degrade over the course of a week or two. Can you help me sort through all that?
Thanks,
Christopher
Christopher,
The first thing to remember is that we always have the ability to close a trade even if it does not meet our 20%/10% guidelines. In my books/DVDs, I call this the CDMCP exit strategy (261 – 264 of the Complete Encyclopedia…). I use this mainly when a stock is under-performing the market but does not meet of 20/10 guidelines. Now, the stats you present are unusual:
1- Selling a slightly OTM strike ($40) for $1.10 and then having option value decline $$0.63 as share price declines by $5 means the option delta was about 12.6, usually reserved for deep, deep OTM strikes…rare but possible.
2- Rolling down from $40 to $35 strikes generated a net time value credit of $0.07. Generally, that credit would be much larger for a $5 difference in strikes.
Our rules and guidelines apply to a vast majority of situations but there are rare exceptions and that’s why I include the CDMCP exit strategy choice. If you do decide to close mid-contract, the cash freed up from the stock sale can be used to enter a new position in the same month to help mitigate some of the losses.
Alan
Alan,
Just received your new book on put selling. Does your premium service list only covered call candidates on the watch list or do you also offer a watch list for put selling candidates?? That would be very helpful. Thanks for your response.
Stephen,
One of the perks of selling options, whether they are calls or puts, is that we want our underlying securities to behave in the same manner to achieve the highest level of returns (elite fundamentals and technical and pass our common sense screens like avoiding earnings reports).. Therefore, the exact same watch list that we create for covered calls is used for selling cash-secured puts.
Alan
Premium Members,
This week’s Weekly Stock Screen And Watch List has been uploaded to The Blue Collar Investor premium member site and is available for download in the “Reports” section. Look for the report dated 01/16/15.
Also, be sure to check out the latest BCI Training Videos and “Ask Alan” segments. You can view them at The Blue Collar YouTube Channel. For your convenience, the link to the BCI YouTube Channel is:
http://www.youtube.com/user/BlueCollarInvestor
Since we are in Earnings Season, be sure to read Alan’s article, “Constructing Your Covered Call Portfolio During Earnings Season”. You can access it at:
https://www.thebluecollarinvestor.com/constructing-your-covered-call-portfolio-during-earnings-season/
Best,
Barry and The BCI Team
Premium members,
Please note that, in addition to the stocks in the “white cells” of the current Premium Stock Report, 4 stocks in the “yellow cells” report earnings in the 1st week of the February contracts and become eligible after the reports pass barring a post-report gap-down). Since the February contracts are 5-weeks long, if we chose one of the 4 stocks, the returns will still generate 4 weeks of time value.
Furthermore, we have our entire list of ETFs from Wednesday’s ETF Report as securities to consider for both covered call writing and put-selling.
Alan
Hi Alan,
I’ve been experimenting selling weekly’s on ETF’s. I’ve found that I can invariably get 0.7% per week or almost 3% per month with far less volatility. Sometimes I may need to sell the put on the previous Thursday (7 trading days before expiry) in order to generate the required 0.7%. In order to reduce risk and achieve greater consistency in my portfolio, I now intend to make up my trading portfolio with at least 30% ETF’s. Selling Cash Secured puts has enabled me to better utilise my Margin account whilst still leaving in reserve a 10% safety buffer should disaster strike the entire portfolio during the trading week.
Martin,
Thanks for sharing your trading strategy with our BCI community. We always appreciate and value feedback from our members.
The BCI team listens to our members and where their interests lie. Selling cash-secured has been the most popular request we have received for the past few years…by far. It’s immensely satisfying to us when we learn that members are benefitting from this information.
I have a question for you: Have you been able to assess the impact, if any, using weeklys and therefore quadruple the commissions, has on your final returns? I know many of our members will be interested.
Thanks,
Alan
Hi Alan,
I will look into the commission issue when I get the time to work it out and post it here. I can see that with Interactive Brokers I am paying anything between 25- 80 cents for selling a call or put on a stock value of 10-15k.
What I like about weekly’s used in a PCP system is that it forces me to take action every few days, which eliminates my major fault which was failing to take action soon enough to prevent losses. It works for me because I was finding that I was often asleep in Australia when major moves were happening late in the trading day, when I should have been either rolling down or buying back option and selling the stock.
Hi again Alan,
An answer to the question of commissions. I am very surprised at what I found!
Trading a portfolio value of approx $150K with IB divided roughly into 15 stocks of 10K.
I changed from a monthly CC strategy to a weekly PCP strategy.
I looked at an average for 3 months commissions on the CC strategy compared to the weekly PCP strategy.
cc = $40 per month av
PCP = $ 62 per month av
Portfolio turn over was greatly increased, however cost of commissions was only up 50% and still very reasonable!
I think the answer lies in the fact that selling the puts is very cheap, and very often, no stock is actually traded.
Regards,
Martin
Martin,
Thanks so much for taking the time to gather this information and for sharing it with our BCI community.
Alan
Another key is that you are using Interactive Brokers which is by far less expensive than any other broker. Allen, I have noticed that a large commission cost and fee comes into play when you are dealing with low priced stocks and your position requires 10 or more options. when you adjust, it is 20 or more. This is really a large loss, considering you have the bid-ask loss also. I am using TDAmeritrade and chose them years ago with ThinkOrSwim. On a $25 stock even a 1% weekly option would cost you $9.99(stock commission) + $9.99 + 4x$.75 contract= $22.98 on a 4x$.25 $100 sold call premium. this is a 23% cost that is only compounded if you must adjust.
@Steve Galley: you state that IB is “by far less expensive than any other broker.” Not quite true. eOption is. IB is second as far as I can tell.
Steve,
In my view, it is essential that we make every effort not to allow broker commissions interfere with the most appropriate strategy maneuvers. Now, you hit the nail on the head when you stated that commissions of some brokers can impact a trade for a low-priced stock.
There are two approaches I respectfully suggest you consider over and above trading differently:
1- Speak with your broker and let him know that the current commission structure does not meet your trading needs and ask if they can offer some relief before you are forced to consider other options (no pun here) elsewhere. These guys will negotiate in many cases…similar to asking your credit card company to lower the interest rate.
2- Switch to a broker that does meet your trading needs.
Alan
Last Monday, I purchased approximately $10K each of ALGN, MANH, NXPI, MNST, NTES from last week’s “Eligible Candidates” on the approved watch list. I sold calls against all of them, at 5-10% OTM to secure a one month return of 2-4%, though I sold MNST ATM.
During the volatile week, most of the above held in pretty well and so validated their Watch List status as good performing stocks, even in tough times. But looking at this week’s list, several of them have fallen off. Being new to BCI, I am looking for guidance on what to do next with such covered call positions.
Only MNST remains on the approved list. Among the rest, MANH and NTES moved into the category of having earnings reports in the coming month (as almost all stocks eventually will during the quarterly earnings season). NXPI lost “approved” status due to STO declining, but looks strong otherwise. However ALGN really broke down during the week with a 10% decline. The $2 Feb 20 call options last traded at $0.52, so nearing the 20% trigger for setting up a “double”.
The only occurrence for ALGN during the week was a JP Morgan investor’s conference. I intend to listen to the webcast in the next day or two to find out what could have upset the market. But I am trying to get away from analyzing my stocks to this level since by the time I have a chance to understand such fundamental changes to a stock, it is too late. Institutions have highly specialized and paid people that do nothing but follow individual companies and I know I have no chance to no something and extrapolate its impact before they do. Instead, I want to take my investing cues from price as your system does. So how do I respond to this apparent sudden change in the outlook for ALGN using the BCI system?
Given the volatility last week, the difficulty for stocks on the Watch List is understandable. I perhaps should have written more calls ATM or ITM, which I will do as I build out my portfolio this coming week. I guess it would be easier to follow the BCI strategy by staying out of the market for the first six weeks each quarter due to all the ER activity. But that eliminates half the year for trading. Please help me understand how to side step ERs with stocks purchased from the Watch List when earnings were still over 3-4 weeks out.
Thanks
Brian
Brian,
I really appreciate your questions because they are so important to the success of a covered call writer. My responses:
1- Eligible stocks (white cells) in our weekly reports are eligible for the CURRENT contract month. If you are writing calls for the next contract month as you did here, you must first check to see if that security is reporting the next contract month. That information IS in our reports as we break down eligible candidates by contract months.
2- In our BCI methodology, if we mistakenly enter a covered call position where there is an upcoming earnings report prior to contract expiration, we buy back the option prior to the ER date. Then we either own the stock through the report and write the call after the report or sell the stock and enter a new covered call position.
3- If we are in a covered call position and there is no ER issue and the stock falls off our “running list” of eligible candidates, we manage our positions as described in my books/DVDs. We do NOT automatically close a position if it is no longer an eligible stock on our premium stock report.
Alan
Thank you for your comments, Alan. I will follow your guidance on (1) and (2) and close out my positions with ERs in the coming month prior to the release of the ER. I see now that the recommendation not to enter a position during an ER period applies only to the short call and not to the underlying stock. That clears up a big question for me.
Regarding (3), I will continue to read up on your strategies when to exit a long equity position. I understand that the basis of the Watch List is what I would call “price momentum”. In all my investing research, this seems the best “trading” approach available to the average investor (one not afforded the resources to arbitrage or front-run “special situations”). So, it is advisable to sell out of a position when price momentum breaks down as shown by the various indicators like 20d EMA, MCD, RSI and STO.
20 years ago, I regularly visited the library to read and learn from Value Line. They back-tested and ranked several different investing strategies. Surprisingly, Value (what would generate their “5” ranking) scored near the bottom over time while Price Momentum (their “1” designation) scored near the top. Your approach seems to generate the “1” ranking that an equity would receive at Value Line. Likewise, they ranked industry sectors 1-5. The sector ETFs that BCI identifies as having the best price momentum would be “1”s in the VL universe while the worst sectors would be “5”s and should be avoided or shorted.
Do you think it would improve portfolio performance if individual stocks selected from the Watch List and meeting other criteria would also come from one of the top 3 industry groups as identified on the ETF report?
Brian,
To expand a bit more on your astute observations:
1- It is important to identify the strategy a particular screen is geared to enhance. Many are focused on longer-term buy-and-hold portfolios whereas the BCI screening is specific for short-term option-selling. That is why I have selected the technical parameters set forth in my books/DVDs. The screening process must fit the selected strategy.
2- From time to time I do hold a long stock position through an earnings report. Years ago, I did this with CSCO which “beat” almost every quarter, and more recently with AAPL. However, this is not part of the BCI covered call writing strategy but rather an approach that may be employed outside the system. As a result, my portfolio turns over 20% – 80% each month. This is not the case in my mother’s portfolio where I sell calls on ETFs.
3- You make an excellent point regarding group rankings and this is important in the BCI screening data. In our ETF Reports we do identify the top 3 SECTORS in the S&P 500 and it would certainly be beneficial to select securities from these sectors. However, in our Premium Stock Reports, we actually take this a step further and identify industry “segment” Here’s how we generate this stat:
We use a combination of the security’s industry and sector, hence the term “segment”. A stock in the transportation sector whose industry is ranked higher in that sector will have a higher ranking than one in an industry ranked lower in that sector. Here is an example of industries within the transportation sector:
Transportation
– Air Courier
– Airline
– Misc. Transportation
– Railroads
– Trucking
– Water Transportation
The basis of the ranking is 6-month performance.
In the screenshot below, I have highlighted in the pink column industry segment rankings in a recent report (not the most recent). Where the arrow points to a ranking of “A/A” this means that the industry segment ranked “A” both this week and the past week.
CLICK ON IMAGE TO ENLARGE & USE THE BACK ARROW TO RETURN TO BLOG.
Alan
Hi Alan,
What is the general relationship among option premium & expiration date & market value? especially between option premium and market value?
Is it the premium will generally go higher when the market value of a stock go higher? Is it the premium will go lower when close to expiration date?
thanks
keith
Keith,
You are correct in both cases for calls. The amount a premium will move in relationship to share price change is known as “delta” For example, if an at-the-money strike has a delta of .50 and a price of $2 and then share price moves up $1, one would expect the option premium to then be worth $2.50, all other factors remaining the same.
The closer we get to expiration Friday, the more the time value component of the option premium will be eroded. This is known as “theta”
Option buyers (not us) are hoping that delta overcomes theta to generate a successful trade.
Alan
Thanks Alan.
For calls, are the “delta” and “theta” fixed number for the period we trade or keep changing? where can we find those value? what is the formula to calculate premium when share price changes?
In the situation when price keep going up (causing premium going up), and meanwhile closer to expiration date (causing premium going down), how do we calculate the final net premium for callers?
The reason I ask this is recent markets fluctuate a lot. I try to figure out when is better time to sell calls, market up or market down? that way, I may buy the stock when market is down, then sell calls when market is up the next day. Am I right?
keith
Keith,
My responses:
1- Delta and theta are NOT fixed for the entire contract
2- To find values of Greeks use an options calculator. Here’s a link to a free one:
http://www.cboe.com/framed/ivolframed.aspx?content=http%3a%2f%2fcboe.ivolatility.com%2fcalc%2findex.j%3fcontract%3d4f5caa2d-245e-435a-8acf-0df921f7d7be§ionname=sec_trading_tools&title=cboe%20-%20ivolatility%20services
3- If there is a way (there isn’t) to routinely and accurately predict the up and down movement of a stock, then your proposed strategy would be a winner. However, since this is virtually impossible, we set our goals and enter a position that meets those goals and manage our positions to the highest possible returns from there.
For more detailed information on the Greeks:
Complete Encyclopedia…: pages 156 – 166
Selling Cash-Secured Puts: 195 – 212
Alan
Premium members:
This week’s 8-page report of top-performing ETFs and analysis of ALL Select Sector Components has been uploaded to your premium site. The report also lists Top-performing ETFs with Weekly options as well as the implied volatility of all eligible candidates.
For your convenience, here is the link to login to the premium site:
https://www.thebluecollarinvestor.com/member/login.php
NOT A PREMIUM MEMBER? Check out this link:
https://www.thebluecollarinvestor.com/membership.shtml
Alan and the BCI team
Hi Alan
I would like to offer that stocks that move more than the market (SP500) are known to have higher beta. Higher beta stocks generally results in higher time premiums due to higher implied and actual (measured) volatility embedded in such stocks.
As markets become more volatile as shown by VIX and its subset of metrics (VXX, VXN, etc), time premium for the market in general and all its sub-components also increases resulting in higher time premiums.
Personally, I screen for stocks or ETFs that are experiencing more volatility so that selling calls or puts becomes more profitable. Your stock watch list does feature such higher volatility stocks for the covered call strategy since it is screening for stocks with accelerating upward price momentum. That acceleration causes volatility whereas stocks that drift sideways experience low vol and therefore low time premia.
It would be interesting to hear your take on selling puts on stocks or ETFs with higher vol and therefore higher time premia versus low. Of course risk is higher and may not be appropriate for very conservative portfolios. Personally, I find the best time to sell puts is after big market selloffs / crashes when market vol is very high (like over 40). Time premium will soar causing highly profitable put selling so long as the bottom is in. March 2009 was a great time to write puts while November 2008 was not, despite high vol.
But this was also the hardest time to find the courage to sell puts
Brian,
Your assessment of volatility, time premium and risk is spot on. You also are 100% correct that risk-tolerance can vary from one investor to the next. This is precisely the reason we offer beta stats in our premium Stock reports and implied volatility stats in our ETF Reports.
The way I manage my portfolio is to set a goal for initial returns at 2 – 4%/month. In bull markets I will set those goals higher and in bear markets a bit lower. In my mother’s account, I use ETFs with monthly goals for initial returns set at 1-2%.
Since I trade predominantly 1-month options, I enter my positions at the start of the contract or just prior to expiration of the previous contracts when rolling options.
In high-volatility market environments, I will favor ITM strikes to hedge against a trade turning against me.
Alan
Alan
I am a new member and you have answered two of my emails and I spoke to you once. I appreciate all of the personal service. I have diligently gone through your material but there is one question that remains.
When to do do a specific trade.
Specifically, when I choose a stock from the running list and plug the strike prices and premiums into the Ellman calculator how do you decide when it is more appropriate to do an ITM/ATM or OTM option trades. Since the running list identifies strong companies with technical’s suggesting that they may go up in price it seems that ITM and ATM would be the best choices.
I do not think I have seen anything listed in your web site that goes into this decision process. I think this is the last piece of the puzzle until I can get started. One other thing in your videos and literature you make it sound like assignment is common when stock and strike prices cross. I though assignment was rare– like in the 20% range.
Joe
Hi Joe,
I enter most of my trades at the start of the monthly contracts (the days following the 3rd Friday of the month). After executing an exit strategy, I may enter a trade mid-contract.
ITM strikes are the most conservative covered call positions to take and OTM are the most bullish. Decisions are based on overall market assessment, personal risk-tolerance and chart technicals. See pages 108 – 124 of the “Complete Encyclopedia for Covered Call Writing” for a detailed explanation of strike price selection.
Alan
FFIV: Today’s earnings report:
We avoid earnings reports because they may disappoint as shown in the chart below.
CLICK ON IMAGE TO ENLARGE & USE THE BACK ARROW TO RETURN TO THIS BLOG.
Alan
Hi Alan,
How would I go about finding ETFs that contain stocks that have passed the screens?
AKA: How do I find out which screened stocks are in an ETF?
Is there some sort of site that lists stocks and if they are in an ETF as well, shows the ETF?
Thanks.
Marina,
Since ETFs are baskets of stocks they are screened slightly differently than individual stocks. We use price performance, option liquidity and implied volatility as our main screening objectives. A weekly ETF report of eligible candidates is provided to our members in addition to our weekly stock reports. A free site that will show the top holdings of an ETF is:
http://www.morningstar.com
Alan