Delta is one of the option Greeks. These are mathematical factors that estimate the risk of stock options. We can take advantage of Delta stats when establishing our covered call and put-selling trades.
3 Definitions of Delta
- Delta is the amount an option price will change for every $1.00 change in share price
- Delta is the equivalent number of shares represented by the options position
- Delta is the percentage likelihood that, upon expiration, the option will expire in-the-money (ITM) or with intrinsic value
Practical application
For covered call writing and selling cash-secured puts, assessing the probability of an option expiring ITM is most useful. For example, when writing an out-of-the-money (OTM) call on a stock that we prefer to retain (go unexercised), the Delta, at the time of the trade, will reflect the approximate probability of expiring ITM and subject to exercise. It will quantify the risk inherent in the trade. How much risk are we incurring? Ask Delta!
The same holds true when writing deep OTM cash-secured puts, where we want to avoid exercise and purchasing the underlying shares. The Delta (listed in negative terms, since put premium is inversely related to share price) will also quantify the risk of being subject to exercise. If an option chain strike shows a put Delta of -20, there is approximately a 20% probability of expiring ITM or with intrinsic value. We should also be mindful of the fact that the options can be closed (bought back) prior to contract expiration to avoid exercise.
How is Delta calculated?
Delta stats are based on sophisticated equations inherent in models like the Black-Scholes Model. These mathematical equations for Delta are determined by dividing the change in option value by the change in stock price. Computer algorithms are constantly updating Delta stats and providing them to broker platforms.
Real-life put trade with Mastercard Inc. (NYSE: MA): $474.74
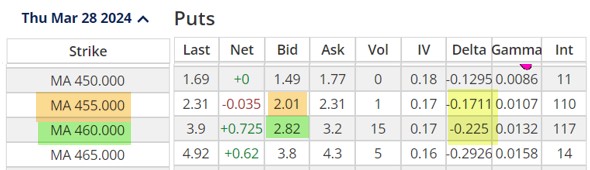
- With MA trading at $474.74, the probability of avoiding exercise (with no exit strategy intervention) is 17% for the $455.00 OTM put strike and 22.5% for the $460.00 strike
- Bid prices are $2.01 and $2.82 per-share and calculations can be done to determine if they meet our pre-stated initial time-value return goal range.
Real-life ITM call trade with NVDIA Corp. (Nasdaq: NVDA) $121.50

- With NVDA trading at $121.50, the probability of share price falling below the $107.00 ITM strike is 84%, resulting in a risk factor of 16%, based on Delta
- Bid prices is $16.70 per-share and calculations can be done to determine if they meet our pre-stated initial time-value return goal range.
Discussion
Delta is one of the option Greeks that can and should be used to enter and manage our covered call writing and cash-secured put trades when seeking to appraising risk. In addition to quantifying the relationship between stock and option price movement, Delta also defines the risk inherent in the trade as it relates to approximate probability of being subject to exercise.
Poor Man’s Covered Call Calculator
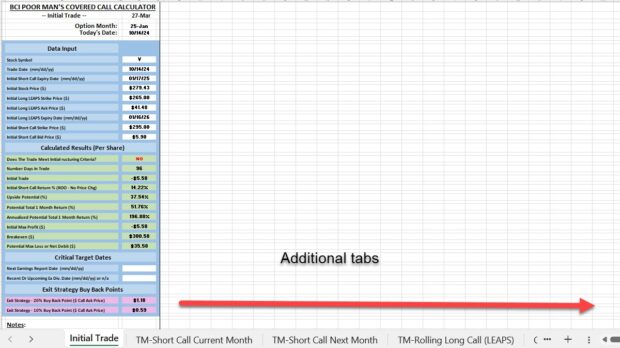
The PMCC Calculator is designed to determine initial trade structure and status as well as various position management price point considerations for the exit strategy price buyback points to buy back the short calls based on the 20%/10% guidelines detailed in the BCI books and Video Programs.
Cells will be provided to enter the option month and current date used to assist with the calculations. There are 5 tabs incorporated into this calculator:
Click here for a video explanation.
______________________________________________________________________________________________________________________________
Your generous testimonials
Over the years, the BCI community has been incredibly gracious by sending our BCI team email testimonials sharing stories as to what our educational content has meant to their families. Moving forward, we have decided to publish several of these testimonials in our blog articles. We will never use a last name unless given permission:
Neil
Upcoming events
1. Cyber Trading Expo
Wednesday July 23, 2025
3 PM ET – 4 PM ET
Info & registration link to follow.
2. BCI Educational Series Webinar # 8: New Credit Spread Calculator
Thursday September 18,2025
8 PM ET – 9:30 PM ET
Over the past 2 years, BCI has been developing and beta-testing a 1-of-a-kind spreadsheet for entering and adjusting our credit spread trades. Like our Trade Management Calculator (TMC), our goal was to make it the industry standard. Only you can decide if we accomplished our mission.
Alan & Barry will introduce this product, review all the tabs inherent in the spreadsheet and demonstrate how to use it. A 1-time early order discount will also be offered.
For those who trade, or are interested in learning how to trade, credit spreads, this is a must-see webinar.
More details and registration information to follow.
3. Orlando Money Show
Orlando Resort @ ChampionsGate
October 16 – 18, 2025
- Opening ceremony keynote address
- 2-hours Master’s Class
- 45-minute workshop class
Details and registration link to follow.


Barry B on June 21, 2025 at 9:56 pm
Premium Members,
This week’s Weekly Stock Screen and Watch List has been uploaded to The Blue Collar Investor Premium Member site and is available for download in the “Reports” section. Look for the report dated 06/27/25.
Be sure to check out the latest BCI Training Videos and “Ask Alan” segments. You can view them on The Blue Collar YouTube Channel. For your convenience, the link to the BCI YouTube Channel is:
https://www.youtube.com/user/BlueCollarInvestor
Barry and The Blue Collar Investor Team
Dear Alan:
And its quite the elementary one too but I just want to be clear in my own mind about it.
The stocks that did not pass this weeks screens but did pass the previous weeks and are still on the running list would be eligible candidates to sell options this week.
Do I have that correct?
Thanks
Robert
Robert,
The stocks that dropped off our Stock Screen & Watch List are still elite performers but had a technical (price chart) drop-off this week. This could be temporary or longer-term, we don’t know at this point.
When we are currently in trades with stocks that recently dropped off our watch list (from the white cells), we leave the trade as is and continue to monitor it for potential exit strategy opportunities.
If we are entering new trades, the stocks in the white cells are stronger candidates this week. This is why we update the list on a weekly basis. Our members have opportunities to select from the strongest candidates on a weekly basis.
Alan
Got it Alan thank you for the clarification.
Premium Members,
The Weekly Report for 06/27/25 has been revised and updated. The color code for the first four stocks in the report was incorrect. The report now shows the correct color coding. This change did not impact any stock selection decisions. look for the report dated 06/27/25-RevA.
Best,
Barry
Alan,
I wanted your feedback on the following trades that I took for my learning.
Symbol : GE
Entry date: 5th May 2025
Trade Entry Expiry Date: 20th June 2025 Sold 220 Call
No. of days in trade : 47 days
Stock purchase price : $210.23
Premium received : $4.50
Outcome : Realized 6.79% return (2.14% option return and 4.65% on stock appreciation). Stock was called away on expiration date as per call option sold, stock price was $239.
Question: Could I have done anything mid trade as the stock price was appreciating and above my sold call? How could I use the TMC to look at different scenarios?
Thank you.
Sha
Sha,
Congratulations on a successful trade.
You may have been able to generate even higher returns by implementing the “mid-contract unwind” (MCU) exit strategy.
Please review chapter 7 in my book, “Exit Strategies for Covered Call Writing and Selling Cash-Secured Puts”.
The Trade Management Calculator can be used to calculate the cost-to-close in the main body of the spreadsheet as there is a dropdown MCU tab in the trade adjustment section.
There is also a worksheet tab at the bottom (Unwind Now tab) that lets us know the time-value cost-to-clos (CTC). If we can generate at least 1% > than this CTC, we should consider the MCU exit strategy.
The screenshot below shows the location of that worksheet tab.
Nice work!
Alan
CLICK ON IMAGE TO ENLARGE & USE THE BACK ARROW TO RETURN TO BLOG.
Thanks, Alan.
Another trade please:
Symbol : SKWD
Entry date: 12th May 2025
Trade Entry Expiry Date: 20th June 2025 Sold 60 Call
No. of days in trade : 40 days
Stock purchase price : $59.75
Premium received : $3.31
Outcome : Realized 5.54% return on option. Option expired worthless, stock price was $57.33
Question: Given that the stock price has declined and my breakeven price is $56.44, how should I sell another call for next month?
Regards,
Sha
Sha,
At the time of expiration (6/20/2025) this was another successful trade (realized option profit + unrealized share loss).
The best way to manage this with our TMC is to enter “Expire Worthless” into the adjustment section of the spreadsheet with the price of SKWD at expiration ($57.33).
The unrealized share loss of $2.42 is incorporated into the current contract cycle.
The final realized/unrealized result is a credit of $89.00 per-contract, or a 40-day return of 1.49%.
See the TMC screenshot below.
The shares can then be sold at a, now, realized profit or we can write another covered call for the next contract cycle. The next strike can be ITM or OTM depending on we decide to take a defensive or more aggressive posture.
If we decide to retain the shares, our price entry into the next TMC spreadsheet will be $57.33, because the share loss to-date is already in the previous contract calculation.
Alan
CLICK ON IMAGE TO ENLARGE & USE THE BACK ARROW TO RETURN TO BLOG.
Premium members:
This week’s 4-page report of top-performing ETFs, along with our sample trade of the week, has been uploaded to your premium site. The Select Sector SPDR section is now crafted to align with our streamlined (CEO) approach to covered call writing. The report also lists Top-performing ETFs with Weekly options, mid-week market tone as well as the implied volatility of all eligible candidates.
We have also included a sample trade taken from one of our BCI watchlists.
Premium member video link:
https://youtu.be/EXMO-KwZuJs
For your convenience, here is the link to login to the premium site:
https://www.thebluecollarinvestor.com/member/login.php
NOT A PREMIUM MEMBER? Check out this link:
https://www.thebluecollarinvestor.com/membership.shtml
Alan and the BCI team