Exit strategies for covered call writing and selling cash-secured puts are an integral part of the BCI success model. In April of 2021, Tom was excited to share with me a series of trades he astutely executed with LOW where he generated 3 income streams with the same stock in the same contract month.
Put Delta explaining price movement in relation to stock price change
Puts have negative Deltas because the price movement of the underlying security is inversely related to put value. If share price accelerates, put value declines and vice-versa. From mid-March 2021 to mid-April 2021, LOW went to the moon and the value of the corresponding puts plummeted. This created huge opportunities for put-sellers of LOW.
Tom’s trades
- 3/19/2021: LOW trading at $178.44
- 3/19/2021: STO 4/16/2021 $170.00 put at $2.11
- 3/28/2021: LOW trading at $188.63
- 3/28/2021: BTC $170.00 put at $0.40 (20% put guideline)
- 3/28/2021: STO 4/16/2021: $180.00 put at $1.70 (hitting a double)
- 4/12/2021: LOW trading at $199.05
- 4/12/2021: BTC the $180.00 put at $0.15 (10% put guideline)
- 4/12/2021: STO the 4/16/2021 (near-the-money) $200.00 put (Tom was okay, if assigned) at $2.45 (hitting a triple)
Price chart reflecting Tom’s trades
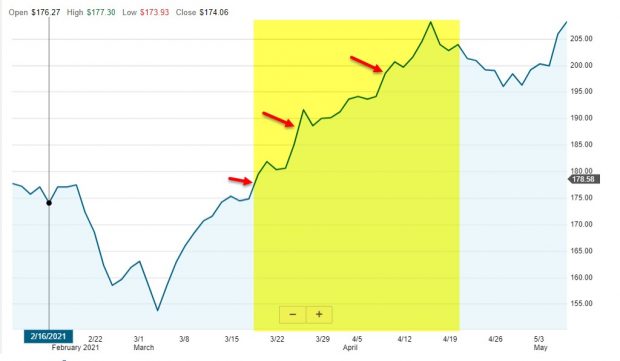
LOW Price Chart: Tom’s Trades in Yellow Field
Trade results as of 4/12/2021
The last put strike of $200.00 required a cash amount of $197.55 ($200.00 – $2.45) to secure that final put sale. The net put credit was $5.71, for a 24-day time-value return of 2.9%. The initial trade time-value return, prior to exit strategy executions, was 1.26%.
Discussion
Position management is the 3rd required skill needed to achieve the highest levels success for our option-selling strategies. When selling cash-secured puts, we can take advantage of share price acceleration by rolling puts up and taking advantage of the inverse relationship between put and share value. The 10-Delta requirement remains in place for all management trades.
For more information on selling cash-secured puts
Best online video course with downloadable workbook
Best calculator (for covered call writing as well)
No price increase for premium members
On November 1, 2021, BCI will be raising membership rates for new members only. This will not apply to current members. It’s been 4 years since we had a rate increase. In that period, we have added dozens of training videos, additional downloads and resources and more quality data to our stock and ETF reports. We are fortunate to have such a robust and expanding membership and strive to provide the best high-quality information and tools at the lowest industry prices.
This price increase will not apply to current active members as you are grandfathered into the current rate for life or as long as your membership remains active. This is our way of showing our appreciation to our long-term members.
The increase for new members will go into effect on November 1, 2021 as follows:
Monthly: $19.95 for the first (trial) month and $57.95 each 30-days thereafter (currently $49.95).
Annual: $657.40 for the first 13 months (includes a reduced first month and a free last month) and then $695.40 every 13 months thereafter (includes 1 free month). Currently $569.40 and $599.40.
All new members who subscribe between now and 10/31/2021 will be grandfathered into the current rate and will see no price increase on 11/1/2021.
Thanks to all our loyal members for your support over the past 14 years and for putting on the financial map.
Premium membership information
Your generous testimonials
Over the years, the BCI community has been incredibly gracious by sending our BCI team email testimonials sharing stories as to what our educational content has meant to their families. Moving forward, we have decided to share some of these testimonials in our blog articles. We will never use a last name unless given permission:
Thank you again for sharing your knowledge… it is truly appreciated.
Nancy B
Upcoming event
Wealth365 Summit: Free webinar
Monday October 11th at 4 PM ET
Stock Options: How to Use Implied Volatility to Determine Strike Selection
Creating 84% probability successful trades
This presentation will detail how to use implied volatility stats, standard deviation bell curves and conversion formulas to establish projected high and low ranges for price movement of a security over the life of an option contract.
These formulas will allow us to create 84% probability of success trades where share price is highly unlikely to fall below the breakeven price point or above the out-of-the-money call strike where share retention is a critical aspect of our strategy.
While there is inherent risk in all strategies that seek to beat risk-free returns (Treasuries, for example), the strategies discussed in this webinar will be ultra low-risk and appropriate for most retail investors.

***********************************************************************************************************************
Market tone data is now located on page 1 of our premium member stock reports and page 1 of our mid-week ETF reports.
****************************************************************************************************************
Dear Alan,
I hold the QQQ with a strike of 377 expiry October 15, 2021.I put this trade on September 21, 2021 when the QQQ was at 366.48 and the delta of the 377 strike was 27 and today the delta is .40. and the QQQ is at 373.
I have been trading this QQQ for over a year. Up until this current position I had not recently entered any option positions, letting the QQQ just run up. However this does not generate any cash in the account only an equity increase.
Is there any fancy footwork eg selling weekly calls that will generate a respectable % of cash and allow me to still hold onto the QQQ without having to add in more money?
The QQQ looks like the October 15 377 strike might expire in the money but I would still like to keep it. Would an early roll up and out be warranted and if so when?
Thank you,
Donna
Donna,
The strategy you are favoring is closely related to portfolio overwriting with one stock. We want premium but do not want exercise. In these scenarios, we use deeper OTM strikes and sacrifice premium to decrease the likelihood of the strike ending ITM at expiration.
Two approaches include:
1. Using 10-Delta calls when initiating the trades.
2. The the BCI “Expected Price Range Calculator” This is based on implied volatility at the time the trade is initiated and will give an 84% probability of the strike not expiring ITM at expiration using the upper end of the range. The calculator is located in the “resources/downloads” section of the member site (right side; scroll down to “E”).
An early roll will likely result in a net debit or allow you to roll out-and-up up perhaps to the $379.00 weekly strike with no credit or debit. If there is a price decline in QQQ, it may create an opportunity to close the current trade or allow it to expire.
For me, rolling decisions are made closer to expiration but this creates the possibility of QQQ expiring deep ITM with a large intrinsic-value component.
To be more flexible, perhaps you could consider allowing exercise of QQQ if it expires deep ITM and use a different security within the desired price range moving forward. There are plenty of other securities to consider if QQQ does not meet your needs at this time.
Either way, using the 10-Delta or IV expected price range approach and establishing an upper end to select strikes will make these decisions relatively rare.
Alan
Hi Alan!
I thought you’d like to know I wrote my first “real” call option yesterday!
Proceeds from option sale $ 165.00
Amount of buy-down $ –
Actual option profit $ 165.00
Option profit $ 165.00
Upside profit $ 274.00
Total profit $ 439.00
Cost of shares $ 8,226.00
Return On Option (ROO) 2.0%
Return on Upside 3.3%
Total return 5.3%
Annualized return 92.1%
I did just one contract so I can get the hang of things!!! We’ll see how it goes. Just wanted to tell you that I truly appreciate all your help!
Best Regards,
Denise
Denise,
Congratulations on executing your first covered call trade. The numbers you shared look quite reasonable as you now enter “management mode”
The only step that is missing (not included) is the buy-to-close limit order we set up after establishing our covered call trades. This is based on the 20%/10% guidelines. Assuming that this is a monthly contract, the BTC limit order is set at $0.33 ($0.35 if only $0.05 increments are allowed).
These are set up good until cancelled (GTC), not “day only”.
Nice work.
Alan
Premium Members,
This week’s Weekly Stock Screen And Watch List has been uploaded to The Blue Collar Investor Premium Member site and is available for download in the “Reports” section. Look for the report dated 09/24/21.
Also, be sure to check out the latest BCI Training Videos and “Ask Alan” segments. You can view them on The Blue Collar YouTube Channel. For your convenience, the link to the BCI YouTube Channel is:
http://www.youtube.com/user/BlueCollarInvestor
On the front page of the Weekly Stock Report, we now display the Top Performing ETFs, the Top SPDR Sector Funds, and the 4 single Inverse Index Funds. They are sorted using the 1-month performances from the Wednesday night ETF report and the prices from the weekend close.
Please make sure that you review the new feature that we’ve added…Implied Volatility or IV. This is the At The Money (ATM) Implied Volatility for all of the stocks in the report.
Best,
Barry and The Blue Collar Investor Team
Hi Alan,
Not sure if this counts as a triple, but here are some ZIM trades I’ve done this month:
September 2: ZIM trading at $52.53. Sold the Oct 15 48P for $2.25
September 16: ZIM trading at $60.65. Bought back the put for $0.50
September 22: ZIM trading at $55. Sold the Oct 15 48P for $1.00
September 23: ZIM trading at $58.90. Bought back the put for $0.50 (not 20% but a good return for one day)
September 27 (today): ZIM trading at $55.10. Sold the Oct 15 50P for $1.30
We will see how it plays out from here.
Cheers,
Richard
Richard,
Sure looks like a triple to me. You managed an initial time-value return of 4.9% up to 8% by rolling your options. Well done.
Plenty of time remaining for 4-bagger! Keep us informed.
Alan
Premium members:
This week’s 4-page report of top-performing ETFs and analysis of the top-performing Select Sector SPDRs has been uploaded to your premium site. One and three-month analysis are included in the report. Weekly performance has also been incorporated into the report although not part of the screening process. Weekly option availability and implied volatility stats are also incorporated.
The mid-week market tone is located on page 1 of the report.
New members check out our ongoing and never-ending training videos (“Ask Alan” and Blue Hour webinars). We add at least one new video each month. Only premium members have access to the entire library of these training tools.
For your convenience, here is the link to login to the premium site:
https://www.thebluecollarinvestor.com/member/login.php
NOT A PREMIUM MEMBER? Check out this link:
https://www.thebluecollarinvestor.com/membership.shtml
Alan and the BCI team
INMD splits 2-for-1 today. Share price did not drop by 50%. We now are short twice as many contracts at half the strike price.
Alan