Covered call writing, like most investment strategies, has a certain risk/reward profile relating to potential profits and losses. A profit and loss graph is a graphical representation of the potential outcomes of this or other strategies. Let’s first have a look at a generic P&L graph:

Components of a profit and loss graph
Components of a P&L graph
- Vertical axis represents the amount of profit or loss
- Horizontal axis ($0) represents the breakeven point
- Above the horizontal is profit
- Below the horizontal is loss
Example of a P&L graph for covered call writing
In this hypothetical we will buy a stock @ $50 and sell the $50 call option for $1, generating $100 per contract (less commissions). This would represent a 2% return ($100/$5000). Here is the graphic:
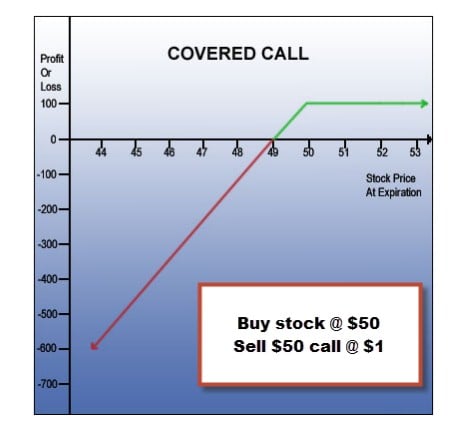
P&L graph for covered call writing of a $50 stock and a $1 call option
Every strategy has its advantages and disadvantages and the P&L graph gives us an outstanding depiction of those pros and cons for covered call writing:
- We immediately have an initial gain of $100 upon entering our position
- We have a guaranteed profit as long as share price remains above $49
- We have downside protection of our investment
- Our profit potential is limited by the strike price ($50)
- ***Loss potential is the stock price minus the option premium, $49 per share in this case
Loss potential for covered call writing as shown by the P&L graph
When viewing the P&L graph for covered call writing a new or uninformed investor may head for the hills because the upside is limited but the downside appears unlimited. This conclusion assumes that the investor will take no action if the trade turns against him. This is a strategy that should never be employed unless an appropriate arsenal of exit strategies is in place for all possible scenarios. This will include share price depreciation, share price appreciation, dividend distributions, avoiding assignment and contract adjustments. All this information is detailed in my books and DVDs but is essential to master before using this great strategy as you can see from the graph.
Conclusion
A P&L graph for covered call writing will show the advantages and disadvantages of this strategy and particularly highlight the need for preparation and execution of exit strategy opportunities when indicated. Mastering position management will mitigate the potential losses and elevate our profits to the highest possible levels.
Speaking of exit strategies
Our members have been asking for a DVD Program devoted solely to exit strategy execution and position management. That product is now available in our Blue Collar store and we are offering a deep discount for early ordering:
*************************************************************************
DISCOUNT COUPON FOR NEW EXIT STRATEGY DVD PROGRAM
A live seminar presentation and extensive Q&A of ALL scenarios that can arise after entering a covered call position and how to manage them to help mitigate losses and enhance gains. The Companion Workbook contains 47 all-color pages of all charts, graphs and slides used during the presentation. Purchase now for an early bird discount:
Regular price: $125
Early bird discount $99 + FREE SHIPPING
Use promo code ESDISCOUNT
Be sure to use this promo code to receive the discount @ checkout. Premium members have received a promo code via direct email.
This is a LIMITED TIME OFFER
Here is a link to our store:
https://www.thebluecollarinvestor.com/store/
********************************************************************************************************************
Next live seminar:
September 24, 2013
Philadelphia Chapter of the American Association of Individual Investors
http://www.aaii.com/chapters/meeting?mtg=2469&ChapterID=22
6:30 PM Registration and 7 PM start.
The charge is $15 for pre-registration and $17 at the door.
Details are available on the above website.
Market tone:
Despite a strong week for our stock markets, economic signals were slightly bearish this week as consumers seemed to be spending less and more concerned about reducing debt:
- Consumer credit card balances fell in July by $1.84 billion at a 2.6% annual rate
- Overall credit demand rose by 4.4% in July to $10.4 billion, less than the $12.5 billion anticipated
- Business inventories (a report of the dollar value of product inventories held by manufacturers, wholesalers, and retailers. Included in the report is the inventories/sales ratio, a gauge of the number of months it would take to deplete existing inventories at the current rate of sales, which is an important indicator of the near-term direction of production activity. The report’s formal name is Manufacturing and Trade Inventories and Sales) rose by 0.4% in July, twice the 0.2% expected
- According to the Commerce Department, retail sales rose 0.2% in July far below the 0.5% predicted. This was the smallest increase since April
- According to the Labor Department, the Producer Price Index (a measure of the average change over time in the selling prices of a fixed
basket of goods by stage of production, industry, and commodity. It is considered a leading indicator for consumer inflation. The “core” PPI excludes
food and energy prices—which account for roughly one-quarter of the broad PPI and tend to fluctuate widely—providing a truer reflection of inflationary trends) increased by 0.3% in July more than the 0.2% expected - Core PPI was unchanged following 9 consecutive months of increases
- Initial jobless claims for the week ending September 7th came in at 292,000 much less than the 328,000 anticipated
For the week, the S&P 500 rose by 2% for a year-to-date return of 20%, including dividends.
Summary
IBD: Confirmed uptrend
BCI: Cautiously bullish favoring in-the-money strikes 3-to-2
Our prayers go out to our friends in Colorado.
Wishing you the best in investing,
Alan (alan@thebluecollarinvestor.com)
www.thebluecollarinvestor.com
Premium Members,
The Weekly Report for 09-13-13 has been uploaded to the Premium Member website and is available for download.
Also, be sure to check out the latest BCI Training Videos and “Ask Alan” segments. You can view them at The Blue Collar YouTube Channel. For your convenience, the BCI YouTube Channel link is:
http://www.youtube.com/user/BlueCollarInvestor
Best,
Barry and The BCI Team
Alan,
If the trade breaks below the brekeven (49 in this case) when do you consider closing the trade?
Thanksfor your help.
Carol
Carol,
Since we are in 2 positions (short option, long stock) the option must be bought back first (unless using a buy-write combination form (pages 219 – 223 of Encyclopedia…). To guide my decision as to when to close the option position I use the 20/10% guidelines detailed in my books and DVDs. At that point I don’t necessarily sell the stock. I may look to sell the same option if the stock recovers or another at a lower strike. The best approach will depend on overall market assessment and chart technicals. Corporate news may also play a roll (unexpected bad news comes out etc.). The key takeaway from this article is that we never let a share drop drop without taking some action when indicated (20/10% guideliness will usually keep us out of trouble). Also, a few weeks ago I wrote an artcile on stop losses that you may find useful on this topic:
https://www.thebluecollarinvestor.com/covered-call-writing-setting-up-a-stop-loss-order/
Alan
Hi Alan,
Wondering if you could assist me with the following –
Earlier this month I purchased 200 Stocks of EDU at $22.62 and sold 2 contracts of the $23.00 call at $0.65.
Over the next few weeks the stock price dropped as did the option premium. As a result I Rolled Down – BTC $23 call and STO the $21 call. Not long after 9/5/13 the $21 call seemed to “disappear” ($0.00 bid and $0.00 ask) and be replaced with strike prices of $20.65, $21.65, $22.65, etc.
I now seem to be attempting to sell EDU 21 call that is no longer able to be sold.
Your assistance before the end of the month would be greatly appreciated.
Keep up the great work with your covered call education.
Regards,
Rod
Rod,
You now have to buy-to-close the $20.65 contracts. Here’s why:
EDU announced a 1-time special cash dividend of $0.35 per share or $35 per contract…$70 in your case. You will see this cash in your account on the payable date which is October 7th. Whenever a dividend is distributed, the price of a stock will decline by the dividend amount. In order to make option buyers and sellers “whole” the OCC adjusts option contracts accordingly. As you can see in th screenshot below, contracts were adjusted down by $0.35. You are made “whole” because although you are obligated to sell at a lower price, you are the one (not the option buyer) who will capture the dividend. CLICK ON IMAGE TO ENLARGE AND USE THE BACK ARROW TO RETURN TO BLOG:
Alan
Alan,
My first option cycle is almost complete. I\’m in the enviable position of facing assignment for four out of five of my purchases (KORS, NTES,WWWW,EDU, with OPEN a recent laggard).
I note that KORS and NTES are no longer on the running list for having failed the MCD/STO screen. Is that reason enough to just dump them and carry on with something on the uptrend?
Aside from that there\’s no bad news on either that I can find. Next months Calls are nicely profitable on both. What would you advise?
Newbie Mike from Alberta
Many thanks
Mike,
The reason these stocks were removed from our Premium Running List is due to weakening technicals. Although the chart is uptrending for KORS there are bearish signals from the MACD histogram, the stochastic oscillator and negative volume diveregnce for the chart shown below for KORS. These are still great companies just not the best of the best at this point in time (KORS has made a lot of money for many of our members!).
There are 2 obvious choices now:
1- Allow assignment and use the cash to institute new positions next week
2- Roll the option. In this case you want to make sure the returns meet your goals (2-4% per month in my case) and have adequate downside protection for a chart with mixed technicals.
Congratulations on some great trades!
CLICK ON IMAGE TO ENLARGE AND USE THE BACK ARROW TO RETURN TO THIS BLOG:
Alan
Premium members:
This week’s 6-page report of top-performing ETFs and analysis of ALL Select Sector Components has been uploaded to your premium site. The report also lists Top-performing ETFs with Weekly options.
For your convenience, here is the link to login to the premium site:
https://www.thebluecollarinvestor.com/member/login.php
NOT A PREMIUM MEMBER? Check out this link:
https://www.thebluecollarinvestor.com/membership.shtml
Alan and the BCI team
NEW YORK SEMINAR:
I just accepted an invitation to speak at the New York Traders Expo @ the Marriott Marquis Hotel in NYC. The event takes place between February 16th-18th, 2014. I will post my seminar slot once the schedule is set. Thanks to all of you for your continued support over the years that has allowed me to receive such prestigious invitations.
Alan
Looks like the market tone information is from a different time period.
Ryan,
This article was linked back from an article I wrote on 12/9/2016. The market tone in this article is accurate for 9/2013 when it was published.
Alan