Never sell a covered call or a cash-secured put if there is an upcoming earnings report. I will continue to repeat this mandate to ensure that new members will not suffer the financial fallout from a disappointing earnings report. There are times, however, when we have so much confidence in a stock which has historically beaten consensus estimates, we may want to keep the stock through the earnings report rather than sell it. This article addresses how we can achieve this goal and provide protection if the report disappoints.
What is a protective put?
This is an option that defends against a decrease in share value of a security already owned. It gives the put holder the right, but not the obligation, to sell the stock at the strike price. As it relates to earnings reports, protective puts would need to be purchased four times a year for a stock remaining in a covered call portfolio.
Real life example
I am writing this article on 4/22/2016. Let’s have a look at the price chart for Proto Labs Inc. (PRLB):
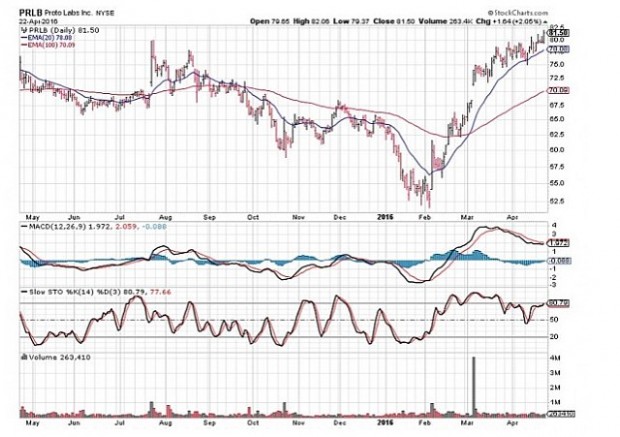
Price Chart for PRLB as of 4/22/2016
Since the beginning of February, this stock has been on a nice run-up and made our Premium Watch List. The projected earnings report date is 4/28/2016. We know that we cannot write a covered call for the May contracts at this time but would like to hold this security through the earnings report and then sell the call option.
Options chain for PRLB
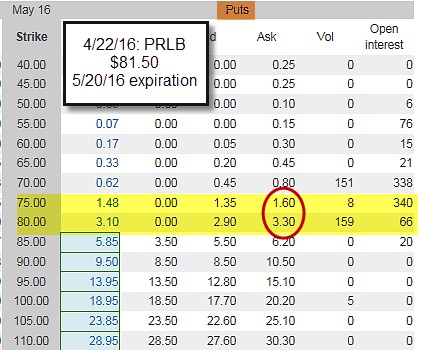
Options Chain for PRLB
Two strikes commonly considered in this scenario are the $75.00 put which costs $1.60 and the $80.00 put which costs $3.30. The more protection we have, the more costly is the protective put.
Stock stop loss orders versus protective puts
Limit orders have the benefit of not costing us any cash but the disadvantage of not having a defined specific maximum loss as do protective puts. Many investors will set limit orders at 8-10% below the current price so that would calculate to approximately $75.00 for PRLB currently priced at $81.50. If the stop loss order is hit and shares sold at $75.00, the loss is $6.50. However, if the price gaps down after a disappointing earnings reports, the loss can be more than $6.50, sometimes significantly more.
Calculating maximum losses with protective puts post-report (price decline to strike + cost of put)
$75.00 put: $6.50 + $1.60 = $8.10
$80.00 put: $1.50 + $3.30 = $4.80
If share price declines below the strike, there is a benefit to the higher strike protective put.
Actions to take
- Puts can be sold at a (likely) profit since share price moved down and then a covered call written on the devalued equity
- Put is exercised at the strike price and the cash used to purchase a different stock for a covered call trade
What if share price stays the same or moves up in value after the report?
In these scenarios, the insurance of protective puts was not activated. Put value will decrease for three reasons:
- Theta is eroding the time value component of the put options
- As share price rises, put value declines (Delta effect)
- The implied volatility of the security will decrease substantially after the report
Actions to take
- Sell the put option at a (likely) loss getting as much remaining premium as possible
- Write a covered call on the appreciated security
Stocks with Weeklys
If the underlying has Weeklys associated with them, puts need to be purchased for only the week of the report which will cost much less than the monthly put.
Discussion
It is critical to avoid earnings reports when selling options because of the inherent risk from a disappointing report. Should an investor hold a stock through the report with the intent to write a call after a favorable report, consideration should be given to protective puts. The benefit is defined protection against catastrophic loss and the disadvantage is the cost of the put. In many cases, the maximum loss is less than that of setting a no-cost stop loss order.
Upcoming live events
September 10th, 2016
Silicon Valley (San Francisco) California
8:30 AM – 12 PM
I am the 2nd of 2 speakers
Registration link to follow
October 24th, 2016
Austin, Texas
Registration link to follow
November 5, 2016
Plainview, New York
Saturday morning 3-hour workshop at the Plainview Holiday Inn. I am the only speaker and plan an information-packed presentation covering 5 actionable ways to make money or buy a stock at a discount using both call and put options. I’ll provide registration information once I receive it from the host investment club.
New spreadsheet available in Premium Member site

Daily Covered Call Checkup
This amazing tool, developed by Premium Member David L, allows us to evaluate current covered call positions mid-contract and offers several “what-if” scenarios. Login to the member site and scroll down the “Resources/downloads” column to “D”. There is also a user guide written by Alan to explain all 32 cells.
Market tone
Global stocks dropped slightly this week. The Chicago Board Options Exchange Volatility Index (VIX) declined slightly from 11.87 to 11.36. This week’s reports and international news of importance:
- The monthly increase in nonfarm payrolls for July came in at 255,000, above the consensus 180,000. This positive news arrived after a healthy 292,000 in June and a very poor 24,000 in May
- The unemployment rate remained at 4.9%. This news increased the chances of interest rate hikes in 2016
- William Dudley, vice chairman of the US Federal Reserve’s Federal Open Market Committee, said Monday that although there are lingering risks to the US economy (Brexit and a strong dollar), a rate hike can’t be ruled out for the rest of 2016
- The US ISM manufacturing purchasing managers’ index, a measure of economic activity, declined to 52.6 in July from 53.2 in June
- US President Barack Obama again stated his support for the Trans-Pacific Partnership (TPP) trade agreement this week, despite weakening support in Congress and opposition from presidential candidates Hillary Clinton and Donald Trump
- With just 66% of the S&P 500 Index having reported, adjusted earnings are down 2.6% from the same period a year ago. This represents the fourth straight year-over-year decline
- Second quarter earnings are expected to rise 1.8%, while revenues are expected to rise 2.8%.
- The Caixin China Manufacturing PMI came in at 50.6 — above 50 for the first time since February 2015
- The July Markit Eurozone PMI declined to 52, which still looks positive. However, concerns over Brexit remain for investors looking forward to 2017
- The United Kingdom PMI fell from 52.3 in June to 48.2 in July
- European banking shares have struggled year to date as the MSCI Europe Bank Index has declined about 26
- The Japanese yen has strengthened significantly versus the US dollar in
THE WEEK AHEAD
- The second quarter change in unit labor costs is reported on Tuesday, August 9th
- The US Bureau of Labor Statistics JOLTS result is announced on Wednesday, August 10th
- The Reuters/University of Michigan Sentiment Index is released on Friday, August 12th
For the week, the S&P 500 moved up by 0.41% for a year-to-date return of +6.79%.
Summary
IBD: Market in confirmed uptrend
GMI: 6/6- Buy signal since market close of July 1, 2016
BCI: Moderately bullish favoring out-of-the-money strikes 2-to-1
WHAT THE BROAD MARKET INDICATORS (S&P 500 AND VIX) ARE TELLING US
Alan,
Does buying protective puts require a different level of trading approval than covered call writing?
Thanks,
Carol
Carol,
Levels of trading approval can vary from broker-to-broker. Many do tie covered call writing and buying protective puts into the same lowest level of option-trading approval but to be sure we must check with our brokers. The best way to determine if a specific broker can accommodate a particular trading style, simply call customer support to get an answer and appropriate forms to submit.
Alan
Premium Members,
This week’s Weekly Stock Screen And Watch List has been uploaded to The Blue Collar Investor Premium Member site and is available for download in the “Reports” section. Look for the report dated 08/05/16.
Also, be sure to check out the latest BCI Training Videos and “Ask Alan” segments. You can view them at The Blue Collar YouTube Channel. For your convenience, the link to the BCI YouTube Channel is:
http://www.youtube.com/user/BlueCollarInvestor
Since we are in Earnings Season, be sure to read Alan’s article,
“Constructing Your Covered Call Portfolio During Earnings Season”. You can access it at:
https://www.thebluecollarinvestor.com/constructing-your-covered-call-portfolio-during-earnings-season/
Best,
Barry and The BCI Team
Premium members Q&A: (submitted when registering for Blue Hour webinar):
Q:
Can you provide additional information from the BCI team around any significant market events (Like Brexit). It would be helpful to understand how Alan is managing his trades around these events.
A:
At the bottom of page 1 of our weekly stock reports we summarize overall market assessment from 3 resources:
IBD
GMI Index
BCI
Under BCI, I will and have commented on events like “Brexit” and how it has influenced my investment approach. For example, in the most recent report I state that I am currently moderating bullish on the market and favoring out-of-the-money strikes 2-to-1.
This way our members have 3 perspectives to analyze and ultimately decide on one that meets our particular trading style.
More member Q&A to come.
Alan
I have been trying to capture dividends by buying a stock two days before the ex-dividend date and immediately selling the short term calls that are a week or two out to protect myself from any downturn. Then a couple of days after the ex-dividend date I would cash out and get my dividend and my money. I have had my stock called away on the ex-dividend date two times and I did not receive any dividend??? I was under the impression that you had to own the stock at least one day before the ex-dividend date to get the dividend, why are these people getting my dividend by exercising my covered calls on the ex-dividend date?
Carl,
When we sell covered calls we are relinquishing control of our shares. That’s why we are paid so generously. When there is a goal to capture dividends and generate option premium there is a best way to maximize our success.
We must first have clarity as to our objectives. In this hypothetical, dividend capture and option premium cash flow are the two targets. I always recommend selling the call options the day after the ex-date although technically we can sell on the ex-date, I would prefer that one day of flexibility to avoid issues like you experienced those 2 times. This will assure us of dividend capture + option premium.
Now, as I always say, there is no free lunch. It is important to understand that on the ex-date, share value will decline by the dividend amount and then other factors will determine ultimate share price.
Alan
Carl,
I always feel silly chiming in behind Alan. There is little left to add :)!
When I was trying to determine my first allegiance between covered calls and dividends – and how to harvest both – the following question was helpful:
“Am I a Dividend Investor who likes covered calls or am I a Covered Call Writer who likes dividends?”
Your answer will take you on one of two equally conservative but profoundly different paths. Or a hybrid like it did me.
In the first you hold longer term tickers you believe in for dividends. Your goal is extra yield in 44 of the 52 weeks they are not ex-div or announcing earnings. You are a portfolio over-writer.
In the second it is no fuss which tickers are in your Bed and Breakfast portfolio so long as you reach cash flow targets. Just kick ’em out before they balance their quarterly check books!
My favorite Alan theme is first figure out where you are going as an investor or you will never get there. – Jay
When my covered calls reach expiration date or a close to it:
What are the “mechanics” of an assignment?
What’s the sequence of events?
How are my calls exercised?
Do I need to wait for a notification from the broker and execute the order myself or is it automatically done by the broker even in my absence?
If I’m the one who needs to enter the order, what’s the deadline?
If this is already explained somewhere else, a link to it would be great too.
Thank you,
Michael
Michael,
Barring unusual circumstances (early exercise due to dividend distributions for example), our options will be exercised if in-the-money by 4 PM ET on expiration Friday. The actual transaction will take place the next day (Saturday) and that’s when we will see the loss of shares and increase in our cash account.
The process is known as “exercise by exception” and is performed by the Options Clearing Corporation (OCC). The general threshold amount is $0.01 or more in-the-money. Some brokerages may opt for other threshold amounts and that’s why the term “automatic exercise” is not 100% accurate.
No action is need on our part. If the strike is in-the-money by the threshold amount after 4 PM ET…goodbye shares…hello cash.
Now, if we don’t want our shares sold and the strike is in-the-money we must buy back the shares prior to 4 PM on expiration Friday.
Alan
Hi Alan,
Is third Friday of the expiration month is the 4th Friday of the contract month( One month contract period )
Mohan
Mohan,
A better way to frame this is that the third Friday of a calendar month represents the FINAL week of an options contract. * months per year this will be the 4th week of a contract and 4 months per year, it will be the 5th week of a contract.
As an example, the 3rd Friday in September is the 16th and the 3rd Friday in October is the 21st making it a 5-week contract.
The 3rd Friday of a calendar month is always the last week of an options (Monthly) contract.
Alan
Premium members Q&A: (submitted when registering for Blue Hour webinar):
Q:
Can you explain the Industry Rank” statistics in the premium member stock reports?
A:
We use a combination of IBD (197 industries) and BCI calculations where stock within industry performance and industry versus other industry performance is calculated and combined. The top 20% are ranked “A”, the next 20% are ranked “B” and so on.
Alan
Alan,
I have been using your method and guide lines for stock selection (only focusing on the IBD 50 stocks), but I have noticed a challenge in finding tight bid-ask spreads in many of the stock options, often times above $.30.
I just wanted to know how important the bid-ask spread truly is, and is it acceptable to go higher than your $.30 limit? I am concerned that these gaps will affect exit strategy implementation, but it seems hard to find these thin gaps!
I appreciate all your assistance.
Regards,
Alan P
Alan,
The bid-ask spread becomes important if we are in a situation where we benefit from buying back the option. A wide spread is not our friend in that scenario. The “guideline” is we want a bid-ask spread of $0.30 or less and/or open interest of 100 contracts or more. If the spread is wider than $0.30 but OI is greater than 100 contracts frequently we can leverage the “Show or Fill Rule” to get a more favorable price. For detailed information regarding how to negotiate with market-makers, see pages 225 – 227 of the Complete Encyclopedia…-Classic and pages 122 – 124 of the Complete Encyclopedia…-Volume 2.
Alan
Thanks Alan for that answer and I think I may just start using the virtual-trade platform on yahoo.finance.com, because that is bound to be reliable in giving out accurate option prices. But I may compare both of them together first anyway.(not sure for how long though?,- maybe a month or two I guess.) thanks
Premium members Q&A: (submitted when registering for Blue Hour webinar):
Q:
How do we determine which strike to sell when selling cash-secured puts?
A:
The first step is to determine our return goals. For example, in my portfolios I target 2-4% for my initial time value returns for both calls and puts. In my mother’s (more conservative) portfolio I target 1-2%.
With that in mind, check all the out-of-the-money put strikes that will yield our target initial returns. The more bearish we are on the overall market the deeper out-of-the-money we go. Same thing applies when price charts are mixed rather than all bullish and confirming…go deeper out-of-the-money while still generating returns within our target range.
Following these steps will simplify and expedite the selection process.
Alan
Running List Stocks in the News: Facebook (FB):
FB reported a stellar 2nd quarter earnings report recently where net income tripled from $719 million to $2.06 billion. This represented its 4th consecutive earnings and revenue “beat” Predictably, analysts have been raising guidance as a result of recent impressive reports.
Our Premium Member Stock Report shows FB to be in the internet industry currently with an “A” ranking. It also shows a beta of 1.10 and a projected next earnings report date of 11/2/16 Weeklys are available for FB and there is adequate open interest for near-the-money strikes.
The chart below reflects the current technical strength of this security and why it has earned its way onto our member list and a bold-ranking as well.
CLICK ON IMAGE TO ENLARGE & USE THE BACK ARROW TO RETURN TO BLOG
Alan