Part of our covered call writing education involves looking back on both successful and unsuccessful trades and learning from them. A few months ago I shared with a premium member a trade I had executed the previous month and saved it (I have a collection of dozens of email responses for future blog articles or Ask Alan videos). Today’s article will highlight a trade I made last September and October with a happy ending.
Proto Labs Inc Com (NYSE: PRLB) was a stock on our Premium Watch List with outstanding fundamentals and technicals. I sold multiple contracts on this security but will use 100 shares and 1 contract to simplify the math. Here’s the overall trade:
- 9/23/13: Buy 100 x PRLB @ $78.10
- 9/23/13: Sold 1 x October $80 call @ $3.30 for an initial 1-month return of 4.2%
- 10/8/13: Buy-to-close the $80 call @ $0.45 (slightly higher than our 10% guideline…that’s why I call it a guideline!)
- 10/14/13: Sell-to-open the $80 call @ $1.40 (“hitting a double”) for an additional $95 credit/contract ($140 – $45)
- 10/18/13: Allow assignment as stock is trading > $80 and there was an upcoming earnings report on 10/31/13
- 10/19/13: Shares are sold for $80 for an additional $190 per contract (purchased @ $78.10)
- Total profit = $330 + $95 + $190 =$615/contract = 7.9%, 1-month return
Let’s take a look at a 1-year chart which included this trade:
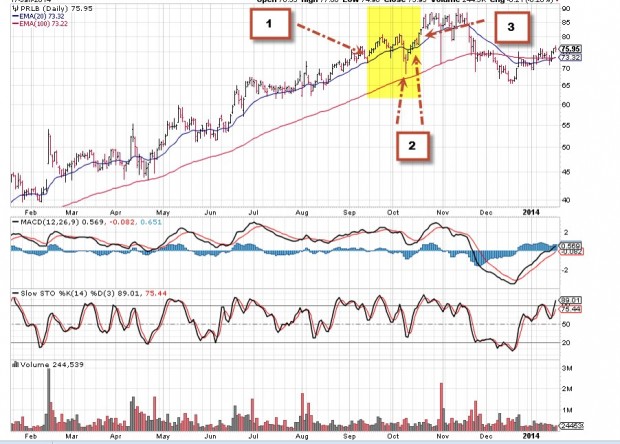
PRLB: 1-year chart
Please note:
1: Entered trade
2: Hit a double as share price declined and then recovered
3: Allowed assignment as share price was in-the-money at expiration
Let’s now take a closer look at the 1-month chart:

PRLB: 1-month chart
Summary:
Here is a summary of the BCI principles, rules and guidelines used in this successful trade:
- Stock selection using fundamental and technical analysis as well as common sense principles
- Option selection based on market assessment, chart technicals and risk tolerance
- Exit strategy execution using the 20/10% guidelines
- Expiration Friday decision based on earnings report rule
Next live seminars:
New York Stock Trader’s Expo @ The Marriott Marquis Hotel, New York City:
February 16th-February 18th
Visit us in Booth #5410
Market tone:
Adverse weather conditions impacted growth and that was reflected in a week of mixed economic reports which are still demonstrating overall growth:
- Orders for manufactured goods declined by 1.5% in November however excluding the volatile transportation sector, factory orders were up by 0.2% for the 3rd straight month
- According to the Labor department, US employees added 113,000 jobs less than the 175,000 expected
- The unemployment rate dipped to 6.6% from 6.7% in December
- The number of long-term unemployed workers decreased by 232,000 and has declined by 1.1 million during the previous 12 months
- Non-farm productivity (4th quarter annual rate) rose by 3.2% bettering consensus estimates of 2.4%. Year-to-year the rate was up by 1.7%
- The US trade deficit came in at $38.7 billion more than the $35.5 billion projected by analysts. Year-over-year the deficit grew by $0.4 billion
- The ISM Manufacturing Index for January fell for the 2nd consecutive month to 51.3. However, any number above 50 still reflects economic expansion
- The New Orders Index for manufactured goods fell 13.2 points from November to 51.2, the largest monthly decline since November, 1980
- The ISM Non-Manufacturing Index rose one point in January to 54, beating analyst estimates of 53.7. This service sector index has been above 50 for 4 years
- Spending on new construction was up 0.1% in December and up 5.3% year-to-year
- Private construction spending rose by 1%, with the number of construction projects at its highest amount since December, 2008
- Construction spending for single-family homes was up 3.4% from November and 21.6% year-over-year
- Construction for multi-family homes rose by 0.5% in December and 27% year-over-year
For the week, the S&P 500 was up 0.8% to 1797.
Summary:
IBD: Market in correction
BCI: Cautiously bullish slightly favoring out-of-the-money strikes 3-to-2
My best to all,
Alan (alan@thebluecollarinvestor.com)
www.thebluecollarinvestor.com
Thanks Alan, this is a great example because it opens up perfectly to a question I’ve struggled with. On 10/9 the stock price continued to decline, approaching the 100 day EMA with it’s low. What factors caused you to decide to wait and try for a double verses rolling down to cover potential losses? As of close on 10/9 you knew that; (a) expiration Friday was closing in, (b) theta was hacking away at any remaining option premiums each day you wait, (c) an earnings report was coming for next month (so you know you want to unload the stock at or near expiration).
P.S. Thanks for the volatility update to the ETF list. I fell into the volatility trap (my bad) and am managing my way out of it I think. The situation was not too different from the one you faced in this example, but I chose to roll down and I didn’t have as many factors against me as you did in this trade (no upcoming ER). If I had waited longer I would have had a chance for a double instead of what will probably be a very small loss.
Thanks again
Dave
Dave,
I’m glad you brought up these points. 3 out of 4 times I would have rolled down in this example. Here is what motivated me to take a more bullish approach to our exit strategy choices:
1- Past experience with this stock
2- Stock price decline was a product of overall market decline, not specific to this stock, and the market had rebounded after recent declines
3- The past 3 times this stock price dropped below its 20-d ema, it immediately rebounded above it as shown in the screenshot below.
4- Had the price not rebounded by the 2nd day after closing the short position, I would have rolled down
I’m pleased that you are benfitting from our new IV stats. Thanks for the positive feedback.
Alan
(CLICK ON IMAGE TO ENLARGE & USE THE BACK ARROW TO RETURN TO BLOG)
Premium Members,
This week’s Weekly Stock Screen And Watch List has been uploaded to The Blue Collar Investor premium member site and is available for download in the “Reports” section. Look for the report dated 02-07-14.
Also, be sure to check out the latest BCI Training Videos and “Ask Alan” segments. You can view them at The Blue Collar YouTube Channel. For your convenience, the link to the BCI YouTube Channel is:
http://www.youtube.com/user/BlueCollarInvestor
Since we are in Earnings Season, be sure to read Alan’s article, “Constructing Your Covered Call Portfolio During Earnings Season”. You can access it at:
https://www.thebluecollarinvestor.com/constructing-your-covered-call-portfolio-during-earnings-season/
Best,
Barry and The BCI Team
Hi Alan,
Could you please talk about the correct way to initiate a ITM position when the market is in correction mode? Is it one or two strikes below current price etc.
Thank-you,
Mark
Mark,
The specific ITM strike selected will depend on 2 factors:
1- The goal for the initial 1-month return (2-4% in my case)
2- The amount of protection your overall market assessment and personal risk-tolerance dictates
For example, The more my concern for overall market direction, the closer to 2% my goal will be and the greater the protection I will require.
Let’s look at an example: FB
This stock (the #1 rated stock this week on the IBD 50) has weekly options so I can go out exactly one month from now. With FB trading @ $64.32, I entered the “bid” prices into the multiple tab of the Ellman Calculator for the following strikes:
$63.50
$63
$62.50
$61.50
$61
All offer acceptable 1-month returns, with the returns closest to 2% offering the greatest amount of downside protection.
CLICK ON IMAGE TO ENLARGE AND USE THE BACK ARROW TO RETURN TO THIS BLOG
Alan
Running list stocks in the news: UA:
Under Armour, Inc. recently boasted a stellar 4th quarter earnings report beating consensus by $0.05/share and revenues up 35% year-to-year. It has averaged over 25% positive earnings surprises over the past 7 quarters. Our Premium Running List shows an industry rank of “B”, a beta of 1.18, weekly options available and adequate open interest. Below is a screenshot showing the outstanding increase in earnings estimates and positive surprises. CLICK ON IMAGE TO ENLARGE AND USE THE BACK ARROW TO RETURN TO THIS BLOG.
Alan
Premium members:
This week’s 7-page report of top-performing ETFs and analysis of ALL Select Sector Components has been uploaded to your premium site. The report also lists Top-performing ETFs with Weekly options.
You will note that the implied volatility of the overall market and most of our securities is lower than the past week, a positive for covered call writers.
For your convenience, here is the link to login to the premium site:
https://www.thebluecollarinvestor.com/member/login.php
NOT A PREMIUM MEMBER? Check out this link:
https://www.thebluecollarinvestor.com/membership.shtml
Alan and the BCI team
Alan,
Question regarding your 2/8/14 blog titled, “Real Life Covered Call Trade with PRLB”. In this example you wrote how the trade was initially entered, closed out and another call sold. What you really did not write about is on 10/9/13 PRLB declined to 71.50. It was purchased for 78.10. At this point there was a 8.5% loss on the stock purchase. PRLB did recover but at this point you did not know if it was going to drop further or not. Did you have a price in mind at this point where you would sell the stock and get out of the trade completely? Thanks.
David
David,
The main reason I decided to stay with this stock for a day or two was because it declined due to overall market forces, nothing to do with the company itself. Check out the chart I created below and see how the S&P 500 had a significant decline the same time as PRLB. Now had the market/stock not recovered as it did, I would have rolled down a day or two later. CLICK ON IMAGE TO ENLARGE AND USE THE BACK ARROW TO RETURN TO BLOG:
Alan