Covered call writing and put-selling are strategies that require us to master three skills: stock selection, option selection and position management or the use of exit strategies. One of the exit strategies available to us as expiration approaches is rolling options where the near-month option is closed (buy-to-close) and the next month’s option is sold (sell-to-open). We can roll out where the near and next month options have the same strike prices (buy back the August $50.00 call and sell the September $50.00 call) or we can roll out and up to a higher strike price (buy back the August $50.00 call and sell the September $55.00 call). Rolling options generally takes place close to contract expiration, prior to 4 PM ET on the third Friday of the month (for Monthly options). I developed the “What Now” tab of the Ellman Calculator to help us decide if rolling makes sense for our new portfolio positions.
The “What Now” tab of the Ellman Calculator
The screenshot below shows the location of this tab in the Basic Ellman Calculator (the Elite version of the Ellman Calculator has seven more tabs):
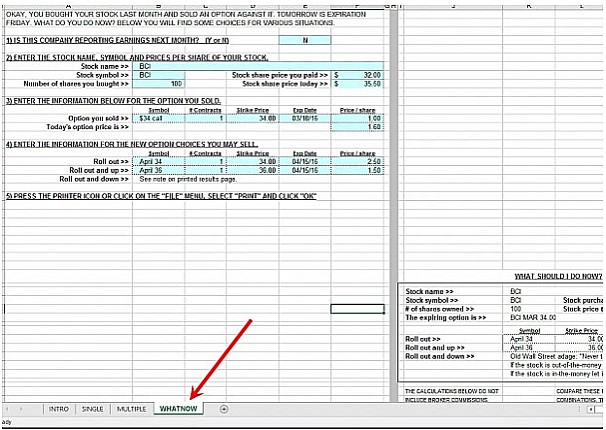
“What Now” Tab of Ellman Calculator
The input information required in the blue fields on the left side of the spreadsheet are:
- Stock name/symbol
- Number of shares
- Purchase price
- Current price
- Price of option sold
- Current price of option
- Price of next month’s same strike
- Price of next month’s higher strikes
Here is a hypothetical example using the “What Now” tab:

Input For the “What Now” Tab
Note the following:
- BCI was purchased for $32.00
- The $34.00 call was sold for $1.00
- The current share price is $35.50
- The cost to close the $34.00 call is $1.60
- The next month $34.00 call generates $2.50 (rolling out)
- The next month $36.00 call generates $1.50 (rolling out-and-up)
- The red arrow reminds us to make sure that there is no earnings report in the upcoming contract month
Calculations generated on the right side of the spreadsheet:
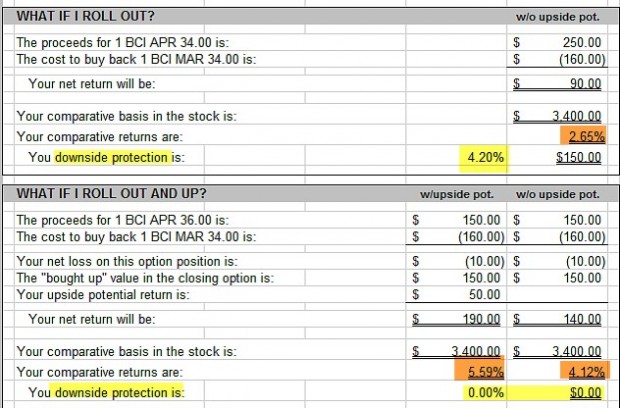
Rolling Calculations-The Ellman Calculator
What if we roll the option (top)?
The calculator determines that we have a net options credit of $90.00 on a cost basis of $3400.00 (current market value of 100 shares based on our option obligation) = a 2.65%, 1-month return. Since the strike is in-the-money, we also have a 4.20% protection of that profit (different from breakeven).
What if we roll out and up to the $36.00 strike (bottom)?
In this scenario, we actually have an option debit of $10.00 but our share value moves up from $34.00 (our option obligation) to $35.50 (current market value) resulting in an initial 1-month unrealized return of 4.12%. Should BCI move to the $36.00 strike by expiration, our 1-month return would be 5.59%
Discussion
The “What Now” tab of the Ellman Calculator will allow us to calculate returns when rolling options. Based on our current market assessment, chart technicals and personal risk tolerance we can opt for rolling out, rolling out-and-up (more aggressive) or taking no action and allowing assignment if calculations do not meet our goals.
***For a FREE copy of the Basic Ellman Calculator, click on the “Free Resources” link on the top black bar of these web pages. The Elite Calculator is free to Premium Members and for sale to general members in our Blue Collar store.
Attention teachers- Now available:
At the request of the University of Maryland where my book, Stock Investing for Students, is required reading for the finance honors program as well as the freshman class, I have written a 46-page E-Book consisting of chapter questions and answers for examination purposes. This file is available for FREE upon request via school letterhead or school email address. Hard copies will also be available in the next few weeks.
Upcoming live events
September 10th, 2016
Silicon Valley (San Francisco) California
8:30 AM – 12 PM
I am the 2nd of 2 speakers
Registration link to follow
October 24th, 2016
Austin, Texas
Registration link to follow
November 5, 2016
Plainview, New York
Saturday morning 3-hour workshop at the Plainview Holiday Inn. I am the only speaker and plan an information-packed presentation covering 5 actionable ways to make money or buy a stock at a discount using both call and put options. I’ll provide registration information once I receive it from the host investment club.
Market tone
Global stocks moved up this week, partly the result of a rebound in prices for crude oil. The Chicago Board Options Exchange Volatility Index (VIX) edged higher, to 11.55 from 11.3 a week ago. This week’s reports and international news of importance:
- US retail sales were unchanged in July, a disappointing sign for an economy being depending on consumer consumption
- A 0.4% drop in the Producer Price Index reinforces the notion that despite strong labor markets, the Fed will stay on the monetary sidelines at least in the near-term
- The Bank of England (BOE) relaunched its quantitative easing program this week and ran into an immediate liquidity problem
- A BOE business conditions survey showed that firms expect weaker investment, hiring and turnover in the coming months
- After a down first-quarter earnings seasons, major US retailers posted better-than-expected results this week, sending their share prices higher
- The Reserve Bank of New Zealand trimmed its official cash rate 25 basis points to 2.0%. Many had expected a deeper 50 basis point cut, so the New Zealand dollar soared on the news, hitting a one-year high
- Fed governor Jerome Powell, in an interview with the Financial Times, said that with inflation below target, the Fed can be patient on raising rates
- The European Union, citing exceptional circumstances, this week waived fines for Spain and Portugal after the two countries exceeded EU budget deficit caps
- Productivity has fallen for three straight quarters, the US Department of Labor reported this week. That’s the longest slump in output per worker since 1979. Falling productivity is raising concerns about corporate profits and the pace of future hiring
- For the first time since 1999, all three major US equity indices closed at record highs on Thursday. The Nasdaq Composite Index joined the Dow Jones Industrial Average and the S&P 500 Index in record territory
- Industrial production, fixed asset investment and retail sales data from China all failed to meet market expectations on Friday
THE WEEK AHEAD
- Japan reports its June industrial production data on Monday, August 15th
- The minutes of the US Federal Reserve’s Federal Open Market Committee meeting will be released on Wednesday, August 17th
- UK July retail sales data are reported on Thursday, August 18th
- Accounts of the European Central Bank’s monetary policy meeting are released on Thursday, August 18th
- Canada releases July retail sales figures on Friday, August 19th
For the week, the S&P 500 moved up by 0.05% for a year-to-date return of +6.85%.
Summary
IBD: Market in confirmed uptrend
GMI: 6/6- Buy signal since market close of July 1, 2016
BCI: Moderately bullish favoring out-of-the-money strikes 2-to-1
WHAT THE BROAD MARKET INDICATORS (S&P 500 AND VIX) ARE TELLING US
I see that Acacia Communications stock has risen 32% Friday. Sadly, I had sold a Covered Call for the stock
for August 19 at $65 which is now $24 less than today’s price. I had watched the stock price move up, a little
above my call strike price, then fall back below it.
Given the spurt though, it’s unlikely that the call will not
be executed. I had made a decent profit on the stock before I sold the Call and I have the call premium so
I am happy with that.
I assume there is no strategy that I could have used, or still could use, to avoid the frustration of missing out on
this extraordinary stock appreciation but if there is, please let me know.
I have become discouraged on covered calls in the past for similar reasons.
Thank you
Joan
Joan,
This looks like a bad news-good news-good news situation:
The bad news: You cannot capture the 24 points ACIA is above the strike. You can buy back the option but it will cost that intrinsic value + a little time value…no point. We can re-evaluate next Friday but if all remains about the same, no action is needed or will enhance the situation.
The good news 1: You have maximized your initial trade. Given the premium originally generated + any share appreciation had you sold an out-of-the-money strike and the price you agreed to sell your shares for, you couldn’t have done any better.
The good news 2: This particular scenario is absolutely avoidable. Sometimes unexpected good news comes out causing a price gap up well above the strike sold. Nothing we can do about that. However, we know when earnings reports come out so we can always avoid gap-ups resulting from positive surprises. The BCI rule is never to sell a covered call when there is an upcoming earnings report. Either don’t own the stock or if you want to own the stock, don’t write the call until after the report passes. In that last scenario we generate income from a favorable report (we hope) + option premium.
I’d focus on good news 1 and follow good news 2 moving forward.
Continued success,
Alan
Joan,
I too found seeing my race horses gallop away while I held the saddlebags frustrating – if not disillusioning – about the strategy. You are not alone 🙂
An adjustment I use for stocks I feel have strong upside and/or are in volatile sectors like biotech, social media, communications or semi conductors is only cover half my position. That way you can be more aggressive in your strike selection to increase downside protection if you desire. This. of course, assumes you want to hold at least 200 shares.
It’s not a worthwhile precaution when over writing blue chips, utilities, staples, industrials and most financials. Jay
Hello Joan, don’t be sad.
Be glad that ACIA did not go 24 points down, causing you a big loss.
It is difficult to forsee the earnings results, and even when you feel very confident about earnings, you can never tell what the market reaction will be. It is impossible.
So, enjoy your gains. You are lucky…. 🙂
Roni
I try not to think about the loss of ‘potential’ gains in the underlying stock. This has been especially difficult with the recent soaring of AAPL above my 103 Strike. (nearly $7) However, in the nearly two years that I have owned that stock, it has ranged widely around my cost basis of $101, and I never ‘realized’ any of those gains (or losses), but only the dividends and numerous covered call premiums. The dividends have been nice, but the premiums have been MUCH nicer.
The worst part of this current situation, is that I am now stuck until expiration and probably exercise to get it working for me again. Perhaps it will pull back?
AAPL was in the ‘Growth’ part of my portfolio, but performed much, much better after I converted it to an income producer. I’m sure there are much better stocks for that purpose, so an exercise might be a good incentive to re-evaluate?
Alan,
I recently purchased your 2nd volume for the encyclopedia for covered call writing. Thank you for providing so much information, it is another home run and I am enjoying all the content (I’ll be sure to review this on amazon).
I have recently been paper trading your system and have used the IBD 50 as a start. A common issue I keep running into with this list is the actual options associated with many of these stocks. A quick example would be ‘SSTK’ which has strong fundamentals, mixed to positive technical, and no upcoming earnings report. The issue seems to lie in the lack of options as shown in the screenshot.
It seems that the bid ask spreads are huge for this, but at this point, would we still avoid this stock based on the options available, or just play the show/fill rule?
Is it expected that most of the IBD 50 stocks are not viable candidates based on the options available, and the stock selection process is scanning these stocks to find maybe 4-5 that are viable? I just wanted to make sure I am going about this correctly.
Also – have you ever considered trading Iron condors, strangles, straddles etc.? I was wondering what your thoughts on these options strategies were.
I really appreciate your help through all this. I plan on purchasing all your books alongside my 2 encyclopedias.
Thanks,
Alan P
(CLICK ON IMAGE TO ENLARGE & USE THE BACK ARROW TO RETURN TO BLOG)
Alan,
I would expect the open interest to dramatically increase and b-a spreads to tighten after expiration of the August contracts. The near-the-money strikes for the current contracts aren’t egregious as highlighted in the screenshot below.
These are quite workable especially when leveraging the “Show or Fill Rule”.
I have had my greatest success with ccw and put-selling. That’s my world but I believe success can be had with other strategies as well. In general, excelling in 1 or 2 strategies is a better approach than being pretty good at many.
CLICK ON IMAGE TO ENLARGE & USE THE BACK ARROW TO RETURN TO BLOG
Alan
Alan P,
Interesting you mention the IBD 50. For purposes of covered call writing and cash secured put selling I find the IBD Big Cap 20 the better list.
First, they are Big Caps which largely eliminates liquidity and spread issues. Second, they tend to be less volatile growth names that still pass IBD screens. And a shorter list!
An observation: I follow the ETF “FFTY” which is based on the IBD 50. It is up 4.8% YTD while the S&P is up 6.8%. Two percent does not sound like much but that is 29% YTD under performance of the blind index by what is supposed to be IBD’s bread and butter selections – ouch 🙂 – Jay
Jay,
Good point of FFTY as well as many actively managed mutual funds and other ETFs based on an index like the IBD 50. They have administrative fees to overcome and a percentage of the fund is invested in areas other then the index (read the fine print!). In the next few months I will be publishing an article regarding highly recommended mutual funds and their performance versus the S&P 500…you’ll find the results quite interesting.
The IBD 50 has been a staple as one of the many screens used in the BCI methodology because of its long-term performance versus the S&P 500 and the nature of growth stocks and option returns. We also use our own database of over 3000 stocks we have identified over the years as potential option-selling candidates. Below is a screenshot of the performance of the IBD 50 versus the S&P 500 since its inception taken from today’s edition of Investors Business Daily.
CLICK ON IMAGE TO ENLARGE & USE THE BACK ARROW TO RETURN TO BLOG
Alan
Premium Members,
This week’s Weekly Stock Screen And Watch List has been uploaded to The Blue Collar Investor Premium Member site and is available for download in the “Reports” section. Look for the report dated 08/12/16.
Also, be sure to check out the latest BCI Training Videos and “Ask Alan” segments. You can view them at The Blue Collar YouTube Channel. For your convenience, the link to the BCI YouTube Channel is:
http://www.youtube.com/user/BlueCollarInvestor
Since we are still in Earnings Season, be sure to read Alan’s article, “Constructing Your Covered Call Portfolio During Earnings Season”. You can access it at:
https://www.thebluecollarinvestor.com/constructing-your-covered-call-portfolio-during-earnings-season/
You will notice that we have added two enhancements to the report this week:
(1) We have added charts for the S&P 500 ($SPX) and the VIX ($VIX) below the section entitled “What The Broad Market Indicators Are Telling Us” that appears on the first page. This should bring the short-term market outlook into better focus.
(2) Stocks that have passed all scans but do not have a minimum of 100 contracts of Open Interest will be highlighted via a “cross hatched” row.
The survey results are in and it appears the majority of you would prefer separate emails for information that is additional to the weekly ETF Report and Premium Stock List. Thank you to all who participated in our recent survey.
Best,
Barry and The BCI Team
Alan, I had you sent 2 emails but it is only the 2nd one!
– I have a query on something I should have got back to you on. When I asked recently about earnings, then are we to try and find out how earnings season of stocks are actually doing, so as to help me in planning a trade?(apart from each articles written summary),- and if so then where to look?Thanks
Adrian,
I listen to CNBC and Bloomberg financial news channels during the day but there are also free sites that can be accessed like this one:
https://www.factset.com/websitefiles/PDFs/earningsinsight/earningsinsight_8.12.16
Alan
Alan,
It is me, the Canadian Covered Call student of your methodology.
I am now 16 months in applying your strategies as both a buy-write covered call and also as a portfolio overwrite f my longer term holds.
I owe you a great debt of gratitude for I have had measurable, quantifiable and steadily increasing success hat have overshadowed the dumb mistakes. the dumb mistakes would be many more without your guidance
In the run up of the overall markets, selling one up/one out calls has put me in a position to either let the shares be assigned or buy back the call. I have made both decisions depending on circumstances.
My question is this: I record all transactions in a journal on excel. If I sell a call, that is income. Receive a dividend, that is income. When I buy back a call, I have been recording the entire buyback as a debit and reducing my income by the entire amount even though I am buying some intrinsic value.
Am I doing that right, or should I just be recording the difference in time value between the sold call and the higher buy back?
Sell call for .75 buy it back just before expiration for 3.75 but 3.55 of that is intrinsic value. I then sell another call at a higher strike price.
your article is wonderful and I am just wondering about how you would deal with the valuation for record keeping. All of my trades are in a Canadian version of an IRA and Roth IRA so there are no tax considerations.
if you EVER come up to Canada, please let me know, I will be there.
Thank you for everything,
Ian
Ian,
There are 2 sets of calculations. One for tax purposes (capital gains/losses) and another for calculating results for purposes of evaluating positions and making investment decisions. For the former, a tax advisor is a better resource than me but I can say that the option trade is usually an entity unto itself with the acquisition date (BTC) coming after the sale date (STO). In this case it would represent a short-term capital loss with an unrealized share appreciation on the stock side…again check this with your tax advisor.
Now, from the standpoint of trading results and decisions moving forward, we have maxed our near-month trade and the “What Now” tab of the Ellman Calculator will highlight potential results moving forward. In other words, we are taking these calculations one contract month at a time since we are comparing “allowing assignment” to rolling an option and our cost basis is then the near-month strike for both.
Thank you for your generous comments…much appreciated.
Alan
Alan,
it has been awhile, I hope you are well. If you have the time and can respond to what I have written below I would appreciate it. I have fallen off the wagon a bit, but beginning my comeback.
I would welcome your input and/or opinion on some adjustments I have made that seem to be working for me:
> I seem to have better results writing calls on higher priced stocks that have large Institutional following. They seem to be less volatile and provide higher premium. I understand everything is relative regarding price and premium but I have observed less volatile behavior.
> I have found with these stocks I get better entries by using a 5 day MA and a 10 day MA as follows: Price must be above the 5 DMA; 5 DMA above the 10 DMA, market in confirmed UP. This a combination of yourself, Dr. Eric Wish and IBD
> Implied volatility is very low right now which can be a harbinger of a market top to be followed by sideways to a sell scenario.
I still enjoy immensely your sight as it provides so much consolidated information. It is one of my Bedrock trading resources.
Time to start writing more ITM calls?
Thanks for all you do, what separates you from so many others is your genuine sincerity. You are the best !
Thanks again,
Kevin
Kevin,
It was great seeing you at the North Carolina presentation.
My responses:
1- Higher priced stocks with lower implied volatility will have higher premiums but lower percentage returns. Use the multiple tab of the Ellman Calculator to get specific results. When we sell options, we are selling volatility…the higher the implied volatility, the higher the percentage returns.
2- I have always encouraged members to use the technical parameters that meet personal trading styles. I like the 20-day EMA because it lines up with the time frame of a 1-month option. Nothing wrong with your parameters especially if you have found success using them.
3- The VIX (CBOE Volatility Index) is inversely related to the performance of the S&P 500. Since we are taking very short-term obligations and given the 3 market assessments you use are the same ones I use, I am still favoring out-of-the-money strikes 2-to-1. No right or wrong here. If an investor will sleep better at night having the protection of predominantly in-the-money strikes than that is the appropriate approach for that particular investor.
Thanks for your positive feedback…much appreciated.
Alan
I am wondering if I will be able to capture the upcoming dividend on STX.
My plan is to sell an in the money September put which expires 16/9/2016 – hoping to get assigned. STX has an ex-dividend date of 19/9/2016, the Monday after the expiry.
If an option is exercised at expiry when will I receive my shares? In this scenario will I be entitled to the dividend on STX?
Thanks for all the information on your website, it has been extremely helpful.
Alex,
Yes, as long as a stock is purchased or an option exercised resulting in share ownership the business day prior to the ex-date, the share owner will be eligible to capture the dividend. Keep in mind that share value will also decrease by the dividend amount.
Alan
Save the date:
Our next Blue Hour webinar, FREE to all Premium Members, will be broadcast on 9/29/2016 at 9 PM ET. The topic is “Using Put Options to Buy and Sell Stock”. This a new presentation which will be presented for the first time on September 29th. Registration will open in a few weeks. You will receive notification.
If you are not a premium member, “seats” will be available for purchase.
Alan and the BCI team
alan I have sold a put and it is nearing the point at which I will be exercised.My strategy is to use the p-c-p approach.My confusion however is that the security is no longer on this weeks positive list.Would you accept assignment and sell the call in spite of the rating or close the position and find another security to sell a cash secured put.Thank you JIm
Jim,
As the share price approaches the strike, we are still in a winning trade. Given that plus the 3% guideline not being reached to motivate a buy-back of the put option, I usually wait until Friday to make a decision. On expiration Friday as 4 PM ET approaches, the time value component of the option will approach zero and, if in-the-money, will cost us intrinsic value (plus a few pennies o f time value) to buy back. Now, if we allow assignment, we are losing out by the intrinsic value and will be in a winning or losing position depending on if then intrinsic value is more or less than the original option premium.
That said, with the above assumptions, allowing assignment will give us the flexibility to see if that stock will make a good candidate for a covered call over the weekend. It may reappear on our next week’s list. It may be borderline where we may opt to write an in-the-money call.
To sum up: Borderline…allow assignment. Continues to fall to 3 % guideline…buy back the option.
Alan
Premium members:
This week’s 8-page report of top-performing ETFs and analysis of ALL Select Sector Components has been uploaded to your premium site. The report also lists Top-performing ETFs with Weekly options.
For your convenience, here is the link to login to the premium site:
https://www.thebluecollarinvestor.com/member/login.php
NOT A PREMIUM MEMBER? Check out this link:
https://www.thebluecollarinvestor.com/membership.shtml
Alan and the BCI team
Hi Alan,
Is it very often, that a stock will skip past it’s stop
loss, on a gap down?
Thanks,
Sam
Sam,
Gap-downs are rare. The most common reason for a large decline in share value is a disappointing earnings report. That problem is resolved in the BCI methodology because of the rule of NEVER selling an option when there is an upcoming earnings report. There will still remain the remote chance of unexpected bad news coming out between earnings reports and there is no way of predicting such events. This is part of the risk involved in owning stock. The good news is that such events are rare but will pop up from time to time. We use our exit strategy arsenal to mitigate losses and move on.
Alan
Are there different rules as it pertains to 20/10 with Weeklys
Nehemiah,
Yes, they do. Since we will generally be in the second half of a contract, it will be the 10% guideline that will apply in most cases. This will ensure that we will always retain 80% – 90% of our original option profit.
Alan
While I have done plenty of ‘roll outs’ (out & up never seems to make sense to me), the calculator has shown me that this strategy has (maybe?) not been the smartest choice (for me) in the past.
Unless the option is only slightly in the money, it doesn’t seem to make sense to buy it back (making it a losing trade vs. exercise), and then ending up with a new option (even at a credit), which is still in the money, and probably not one that I would have chosen in a brand new scenario.
John,
Here’s another perspective on “rolling” options for your consideration. I believe that by tying rolling decisions into previous trades can cloud our judgment. For example, if we originally bought a stock for $10 and today it is $100 and we sell a call for $1, our return is 1%, not 10%. It is based on current, not past, stats as long as we are not doing tax calculations.
So when it comes to rolling, we have maxed our near-month trade because the strike is in-the-money or we wouldn’t be rolling. Our shares are currently worth the strike sold, not a lower amount we paid for the stock or a higher amount of current market value. As you pointed out, our choice is to roll or allow assignment. Since we are near 4 PM ET on expiration Friday, the time value component of the option is approaching zero and so we pay mainly intrinsic value when we BTC the option (buy back). Let’s say we bought a stock for $48 and sold the $50 call for $1.50. On expiration Friday the stock is trading at $52 and the cost to close is $2.05. This has absolutely nothing to do with the initial $1.50 from the original sale. It is tied into the credit we are about to receive from the next month’s option as it relates to exit strategy decisions. The next month $50 call will generate $2 of intrinsic value and let’s say $1.25 of time value. That’s a 2.4% 1-month return with downside protection of that profit of 3.8%…why not at least consider it.
Looking at this same trade from a different angle, let’s say we didn’t own the stock in the now-expiring contract month but like it for the new contract. We would buy it at $52, not $50 and may favor an in-the-money strike…amounting to the same thing as rolling. The same case can be made for rolling out-and-up if more bullish on the stock.
Rolling options does not always make sense but I encourage our members to give it serious consideration as one of the important choices we have to generate the highest levels of option returns.
Alan
That’s not exactly what I was saying. Example…..
I bought a stock in April for $75.50.
Soon after I sold a call at 80 for 1.93, which ultimately expired worthless.
Then I sold another call at 80 for 1.71, which is expiring today in the money around 84.
To roll it a month, it will cost me 4.18, netting .60 credit or only a .75% ROO
That doesn’t make sense to me unless the stock pulls back, and technicals do not suggest that.
It seems a better choice to allow exercise, pocket a total of $8.14, and start anew with this stock which I want to keep, selling an 85 for 1.33, which is more like a 2.1% ROO??
John,
This appears to be a rolling out-and-up opportunity. The shares are currently worth $80…allow assignment you get $80. Your trades have been quite successful…congrats on that. Now that’s all behind us. Should we roll out-and-up or allow assignment.
Let’s say we allow assignment and buy the shares on Monday for $84 (add an additional $4 to our cost basis) and sell the $85 call for a 1.3% return. Or we can roll out-and-up for $4.18 and sell the same $85 call. The only difference here is the $0.18 which will become less as we approach 4 PM ET. Not to mention one less trading commission when rolling.
The approaches are similar with a slight benefit to rolling (in my view) if prices don’t change over the weekend. Shares can open on Monday at $86 (or $82)…allowing assignment creates a bit more risk.
Alan
Thank you….. successful, yes, but over 4 months. In addition to the $8.14, there were two dividends of .77 each. Total return of 12.8%, annualized to 38.5%.
The anomaly here is the large equity gain in the stock of $4.5, something I don’t think I can count on in aggressive option trading.
I’m not a fan of rolling out & up. At least, I don’t often see it as a viable opportunity. If the stock were in a good entry position today (which it could be argued either way today), I might consider it? However, I think the benefit of opening up some time to enter, as well as finding a good entry for the Call is a lesser risk? No ex-dividend (or earnings report) on the near horizon, so only the need to get into a good option trade soon.
Thanks for your comments, your calculator, and your work.