When the Poor Man’s Covered Call (PMCC) strategy is employed, the short call is the active leg of the trade. If a strike is expiring in-the-money (ITM), we can roll the short call to a later expiration date. This article will detail 2 possible rolling trades with GOOG, 1 for rolling-out to the same strike and the other to rolling-out-and-up to a higher strike. The BCI PMCC Calculator will be used to accomplish the calculations. Note that the BCI member who shared these trades with me was considering rolling well before contract expiration.
What is the PMCC?
This is a covered call writing-like strategy where a LEAPS option (expirations > 9 months away) is purchased instead of the actual stock or ETF. Short calls are then written against the long LEAPS position. The technical term is a long call diagonal debit spread and is considered a long-term strategy.
Real-life trade with GOOG
- 7/22/2022: GOOG trading at $110.80
- 7/22/2022: The 9/15/2023 $60.00 call LEAPS had an ask price of $52.60
- 7/22/2022: The 8/19/2022 $115.00 call had a bid price of $2.35
- 7/30/2022: GOOG trading at $116.60
- 7/30/2022: The ask price of the 8/19/2022 $115.00 call was $1.84
- 7/30/2022: The bid price of the 9/16/2022 $115.00 call was $3.57
- 7/30/2022: The bid price of the 9/16/2022 $120.00 call was $2.65
Initial trade structuring using the BCI PMCC Calculator (Initial Trade Tab)
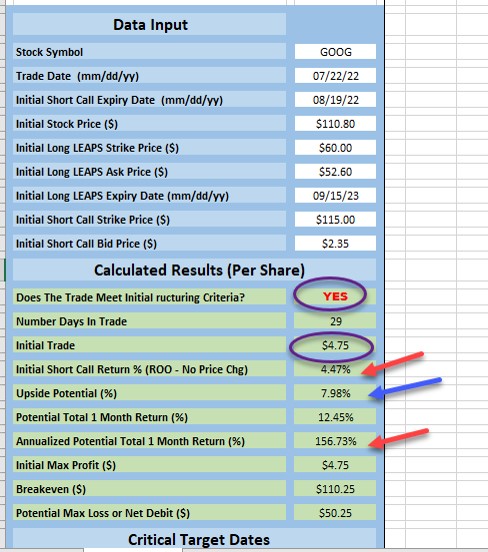
GOOG: PMCC Initial Calculations
- The purple circled areas show a net credit of $4.75 per-share if significant share appreciation forced closure of both legs of the trade, with “yes” meaning that the trade passes our calculation requirements
- The red arrows show an initial premium return of 4.47%, 156.73% annualized based on a 29-day trade
- The blue arrow shows an additional upside potential of 7.98% should share value move from $110.80 up to or beyond the $115.00 strike
Rolling calculations with the BCI PMCC Calculator (Rolling Next Month Tab)

Rolling-Out with GOOG
- The initial time-value return for rolling-out is 3.44% based on the net option credit (intrinsic-value deducted by the spreadsheet)
- The initial time-value return for rolling-out-and-up is 4.80% based on the net option credit+ unrealized share value by increasing the strike ceiling (increases the difference between the LEAPS and short call strikes)
Discussion
The active management leg of PMCC trades is the short call. The long LEAPS will require less frequent adjustments. Rolling exit strategies are common and available for both rolling-out and rolling-out-and-up. The former is a more defensive approach and the latter a more aggressive approach. We base our ultimate position management decisions on personal risk-tolerance, overall market assessment and initial time-value return goal ranges.
Premium Member Benefits Video
This is a great time to join our premium member community with its stock screening and educational (over 200 videos) benefits. We offer more benefits than ever before. For information, click here.
For video explanation, click here.
Your generous testimonials
Over the years, the BCI community has been incredibly gracious by sending our BCI team email testimonials sharing stories as to what our educational content has meant to their families. Moving forward, we have decided to share some of these testimonials in our blog articles. We will never use a last name unless given permission:
Amazon review of The Complete Encyclopedia for Covered Call Writing:
Upcoming events
To request a private webinar for your investment club, hosted by Alan & Barry: info@thebluecollarinvestor.com
1.Long Island Stock Traders Meetup Group
Analyzing a 1-Month Covered Call Writing Portfolio from Start to Finish
A real-life example with a $100k ETF Select Sector SPDR portfolio
Thursday February 16,2023
7:30 PM ET- 9 PM ET
Covered call writing is a low-risk option-selling strategy that generates weekly or
monthly cash flow. This presentation will demonstrate how to implement this
strategy using a database of only 11 exchange-traded funds for a 1-month option
contract cycle. These are real-life trades taken directly from one of Dr. Ellman’s
portfolios with screenshots verifying each trade. A final monthly contract result
compared to the performance of the S&P 500 will be calculated.
Topics included in this webinar:
What are the Select Sector SPDRs?
How to establish a covered call writing portfolio
What is the role of diversification?
What is the role of cash allocation?
Calculating initial returns
Analyzing each trade in the monthly contract
Final results
Next steps
Go to www.meetup.com/listmg
Click on join to become a member (Free membership)
Then click on RSVP (meeting is free) to obtain the ZOOM link.
2.Mad Hedge Investor’s Summit
March 14th – 16th Date, time and topic to follow.
3.NYC & Long Island Stock Traders Investment Groups
Thursday March 16th, 2023
7:30 – 9 PM ET
Topic related to selling cash-secured puts.
Details to follow.

***********************************************************************************************************************
Market tone data is now located on page 1 of our premium member stock reports and page 1 of our mid-week ETF reports.
****************************************************************************************************************
Hi Alan –
Would you mind helping me with this trade?
Would you enter this trade on one or two lines in the TMC?
I used one line and entered notes in the Journal showing the final net option calculation of $3.85 ($3.00 + $1.60 – $ .60 – $ .15). I’m not sure how I would enter if if using two lines.
12/22/2022 STNG trading at $53.00
12/22/2022 STO 1 x 01/20/23 $55 Call at $3.00
01/04/2023 STNG trading at $47.16
01/04/2023 BTC 1 x 01/20/2023 $55 Call at $ .60 (20% BTC) and roll down to $50 Call
01/05/2023 STO 1 x 01/20/2023 $50 Call at $1.60
01/20/2023 BTC 1 x 01/20/2023 $50 Call at $ .15 (20% BTC, forgot to change to 10% BTC)
01/20/2023 Sold STNG at $49.60.
Thank you,
Jim
Jim,
I agree with you 100%; this is a single line trade using the Trade Management Calculator.
In the screenshot below, I stacked each section of the spreadsheet vertically so it can be read in a single image.
Top-to-bottom:
Initial trade entries & calculations … this part is easy.
Rolling-down: I would deduct the final BTC ($0.15) from the STO price ($1.60) to get a final STO stat of $1.45. An explanatory notation can be made in the Trade Journal section.
Final results: A net option profit of $385.00 (7.26%) and a net realized share loss of $340.00 (6.42%), resulting in a net profit of $45.00 (0.85%).
CLICK ON IMAGE TO ENLARGE & USE THE BACK ARROW TO RETURN TO BLOG.
Keep up the excellent work.
Alan
Another thought on Jim’s trades:
This is an outstanding example of how we can still generate profits (as in this case) or mitigate losses when selling options even when share price declines.
Not all our trades will be winning ones, but by lowering our cost-basis as we sell options, we are throwing the odds dramatically in our favor, once we’ve mastered the 3-required skills (stock selection, option selection & position management).
Alan
Premium Members,
This week’s Weekly Stock Screen And Watch List has been uploaded to The Blue Collar Investor Premium Member site and is available for download in the “Reports” section. Look for the report dated 01/20/23.
We were successful in implementing our system backup and recovery procedures to address our earlier systems issues.
Also, be sure to check out the latest BCI Training Videos and “Ask Alan” segments. You can view them on The Blue Collar YouTube Channel. For your convenience, the link to the BCI YouTube Channel is:
http://www.youtube.com/user/BlueCollarInvestor
Reminder: Premium members are grandfathered into your current rate and will never see a rate increase as long as the membership remains active.
Best,
Barry and The Blue Collar Investor Team
barry@thebluecollarinvestor.com
Alan,
I’m using the portfolio overwriting strategy with stocks I’ve owned for several years. The income has been really helpful.
I do have a question about your earnings report rule. Does it apply if the plan is to keep the stocks for the long term? How do we manage these earnings reports?
I look forward to your guidance.
Nancy
Nancy,
The BCI guideline when it comes to earnings reports (ERs) and shares we plan to keep for the longer term, is to never have the covered calls in place that expire after the ER date. We simply retain the shares and write the calls after the report passes and any volatility that the report causes (if any) subsides.
If the shares have weekly options associated with them, we can continue to write covered calls and skip the week of the ER.
Over the past several years, there have been significantly more “beats” than disappointments, so this approach will benefit us long-term.
Alan
Hi Alan,
I trade covered call a lot in paper money account.
I earn an average of 1 to 2 percent on my paper money account..
I could not reach 2-4% monthly return that you normally say in your books and tutorials.
May I ask (beside 2022) what is your average monthly return?
Am I doing bad?
Regards,
Keivan
Keivan,
2% – 4% is my starting point. It does not necessarily represent final realized returns. It may be more; it may be less, but this is how I craft my trades.
The initial time-value returns are directly related to the implied volatility of the underlying securities, so a security like ETSY will generate higher returns than one like XLP.
We base this range on personal risk-tolerance and strategy return goals. There is no right or wrong here. Many of our members are more aggressive than I am, many more conservative. All are correct in their approach as long as it aligns with the above parameters. I actually use 1% – 2% in my mother’s more conservative portfolio.
You are doing extremely well by achieving 1% – 2% per-month in your paper-trade account.
Keep up the good work.
Alan
Premium members:
This week’s 5-page report of top-performing ETFs and analysis of ALL Select Sector Components has been uploaded to your premium site. The report also lists Top-performing ETFs with Weekly options, mid-week market tone as well as the implied volatility of all eligible candidates.
New members check out our ongoing and never-ending training videos (“Ask Alan” and Blue Hour webinars). We add at least one new video each month. Only premium members have access to the entire library of these training tools.
For your convenience, here is the link to login to the premium site:
https://www.thebluecollarinvestor.com/member/login.php
NOT A PREMIUM MEMBER? Check out this link:
https://www.thebluecollarinvestor.com/membership.shtml
Alan and the BCI team
Alan,
When using the PCP strategy is the strike selection process the same or different from using the 2 strategies separately?
Thanks,
Sal
Sal,
Yes, no matter which leg of the PCP strategy we are currently trading, we use the same set of rules and guidelines for strike selection:
1. First, determine our initial time-value return goal range (2% – 4%, as an example)
2. Use OTM puts, to initiate the process, that meets are stated goal range.
3. If and when the put is exercised, and we take control of the shares, we write covered calls.
4. We can select ITM calls to take a defensive posture or OTM calls to take a more aggressive posture.
5. Factors that determine the moneyness of our call strikes include overall market assessment, chart technical parameters and personal risk tolerance.
Following these rules and guidelines will place us in a position to achieve the highest possible returns.
Alan