We must master strike price selection to maximize our covered call writing returns. In our BCI methodology, strike price selection is ultimately determined after our careful stock screening analysis and overall market assessment. By developing a watchlist of eligible candidates with elite fundamentals and strong price chart technicals along with passing our common sense screens (like minimum trading volume) we are off to a great start in constructing our monthly covered call writing portfolios. Next we make our overall market assessment (bullish vs. bearish) and that will dictate the percentage of in-the-money (ITM- conservative) and out-of-the-money (OTM- bullish) strikes we will select.
Whether we are favoring ITM or OTM strikes we may have several choices to choose from. So the question now becomes which specific strike price should we select? At this point the calculations become a key factor. The first consideration is to decide what your initial 1-month goals are for your positions (mine are 2-4%). From there, we look at the amount of upside potential if bullish or the amount of downside protection of the option profit if bearish or have a low-risk tolerance. Let’s make some generalizations:
- The more bullish we are, the further OTM we will go after meeting our initial goals
- The more bearish we are, the further ITM we will go after meeting our initial goals
Let’s look at a real life example, using EDU, a stock on our Premium watch List at the time I wrote this article. Below is a 1-month options chain:
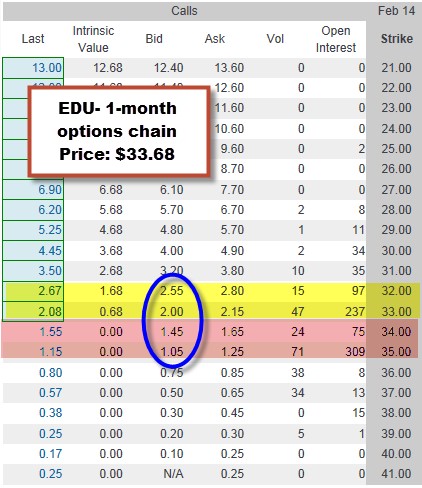
EDU 1-month options chain
Note the following:
- EDU is trading @ $33.68
- We will evaluate ITM strikes of $32 and $33 (yellow fields)
- We will evaluate OTM strikes of $34 and $35 (pink fields)
- We will use the published “bid” prices with the understanding that we can frequently negotiate better sale prices
Next, let’s take these stats and enter them into the Ellman Calculator (for a free copy, use the “free resources” link at the top of this page):
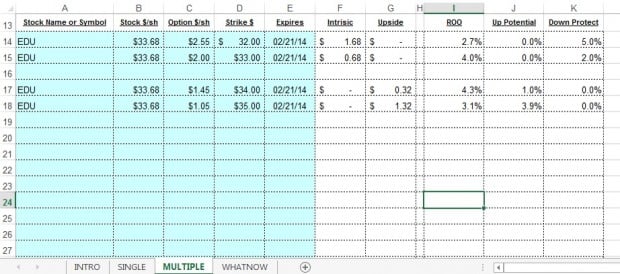
EDU calculations with the Ellman Calculator
Note the following:
- All initial returns meet the goal of 2-4%
- The more bearish or conservative an investor is, the more likely he (she) is to select the $32 strike and sacrifice some initial return for more protection
- The more bullish an investor is, the more likely he (she) is to select the $35 strike to create an opportunity for greater upside and a potential 7%, 1-month return (3.1% + 3.9%).
Summary:
The key takeaway here is that there is no one strike price that is best suited for every investor. The factors that need to be considered are:
- Overall market assessment
- Personal risk tolerance
- Individual monthly goals
By factoring in these considerations we will be able to make an appropriate decision for ourselves based on sound fundamental, technical and common sense principles.
Live seminars this week:
International Stock Traders Expo @ The Marriott Marquis Hotel, New York City:
Florida seminars in March:
Market tone:
This week there were only a few economic reports to evaluate and the severe weather conditions throughout the country may have influenced the negative tone of these reports:
- Janet Yellen, the new Federal Reserve Chairwoman, testified, for the first time since replacing Ben Bernanke, before the House Financial Services Committee. She will continue to wind down the Fed’s bond-buying program unless the economic recovery takes a negative turn
- Industrial production (a measure of the changes in quantity of physical materials and items produced in the manufacturing, mining, and utilities industries. It is an indicator of trends in the industrial sector) declined by 0.3% in January compared to the 0.3% increase expected by analysts. This was the first decrease since July
- Manufacturing growth for the 4th quarter, 2013 came in @ 4.6%, less than the Fed estimate of 6.2%
- Retail sales (a report of the dollar value of sales of a broad range of goods, from cars and gasoline to furniture, food services, and clothing. Retail sales are a major indicator of consumer spending trends, accounting for a substantial portion of total consumer spending and aggregate economic activity) fell by 0.4% in January while experts were expecting no change from the previous month
- Business inventories (a report of the dollar value of product inventories held by manufacturers, wholesalers, and retailers. Included in the report is the inventories/sales ratio, a gauge of the number of months it would take to deplete existing inventories at the current rate of sales, which is an important indicator of the near-term direction of production activity) increased by 0.5% in December as predicted by analysts
For the week, the S&P 500 rose by2.4% despite the weak economic news.
Summary:
IBD: Confirmed uptrend
BCI: This site continues to be moderately bullish on the overall economy and feels that the recent weak reports have been impacted by the extreme weather conditions we have experienced. As a result, we are favoring out-of-the-money strikes 3-to-2.
My team and I continue to appreciate your incredible support and thank you for all the positive feedback.
My best to all,
Alan (alan@thebluecollarinvestor.com)
www.thebluecollarinvestor.com
Alan,
In the spreadsheet could you explain the column “down protection”
Thanks for you outstanding work.
Dawn
Dawn,
This refers to the downside protection OF THE OPTION PROFIT (time value). This is very different from breakeven which is (for the $32 strike) $33.68 – $2.55 = $31.13.
In the top row, the $2.55 option premium breaks down into $1.68 0f intrinsic value ($33.68 – $32) and $0.87 of time value. That $87/contract represents a 5-week return of 2.7%. The “downside protection” is the amount the share price can drop wihout impacting this return. In this case, we are guaranteed a 5-week return of 2.7% as long as share value does not depreciate by more than 5% by expiration or stated differently as long as share price does not declione below $32.
For more details on the calculator, use the free resources link on the top of this page and download the Calculator User Guide…it’s free.
Alan
Premium Members,
This week’s Weekly Stock Screen And Watch List has been uploaded to The Blue Collar Investor premium member site and is available for download in the “Reports” section. Look for the report dated 02-14-14.
Also, be sure to check out the latest BCI Training Videos and “Ask Alan” segments. You can view them at The Blue Collar YouTube Channel. For your convenience, the link to the BCI YouTube Channel is:
http://www.youtube.com/user/BlueCollarInvestor
Since we are in Earnings Season, be sure to read Alan’s article, “Constructing Your Covered Call Portfolio During Earnings Season”. You can access it at:
https://www.thebluecollarinvestor.com/constructing-your-covered-call-portfolio-during-earnings-season/
Best,
Barry And The BCI Team
Hi Alan,
If I like a stock but am unsure about its short term direction, would it ever make sense to write multiple strike prices, some ITM, ATM, and OTM, with the same expiration date, what I would call “strike price diversification?” Or should I choose just one strike price?
Thanks for all the great information.
Marc
Marc,
Yes it makes absolute sense. If you are selling multiple contracts, strike diversification is a great way to further diversify your risk. I use this strategy whenever there is no definitive market direction or suspect possible short-term volatility.
Alan
To all members:
After 5 days at the International Traders Expo @ The Marriott Marquis Hotel in NYC I will be returning to my office on Wednesday and catching up with your emails.
This event has been a real treat for me because so many BCI members attended and we had a chance to meet in person. My seminar was packed with attendees and there is nothing better for a speaker than a venue completely filled…thank you.
One more seminar this morning and back to a normal routine tomorrow.
Alan
Running list stocks in the news: WLK:
One of the stocks on our current Premium Watch List, WLK, announced this morning a 2-for-1 stock split effective after close on March 18th. The company also increased its cash dividend by 12%. For those of you who own the stock will end up with twice the number of shares at half the price. Those who sell options on this underlying will have sold double the number of contracts @ 1/2 the strike price. For example, had you sold (after earnings) 2 contracts of the $130 strike pre-split, it turns into 4 contracts at the $65 strike post split. Beware of the 2-20 earnings report.
Our premium Running List shows an industry rank of “B”, an aggressive beta of 1.5, a % dividend yield of 0.70, an ex-date of 12-4-13 (last one) and adequate option liquidity.
Alan
Premium members:
This week’s 8-page report of top-performing ETFs and analysis of ALL Select Sector Components has been uploaded to your premium site. The report also lists Top-performing ETFs with Weekly options. You may note that report has become a couple of pages longer due to the additional implied volatility information and as more candidates become eligible.
For your convenience, here is the link to login to the premium site:
https://www.thebluecollarinvestor.com/member/login.php
NOT A PREMIUM MEMBER? Check out this link:
https://www.thebluecollarinvestor.com/membership.shtml
Alan and the BCI team
I personally choose the strike price ( when selling Puts) considering the facts that would I really like to own that particular stock, while I am selling Cash secured Puts, if not then my approach will be very conservative,to make some additional income of a few “crumbs”.