Selling cash-secured puts requires us to master the three required skills: stock (or ETF) selection, option selection and position management. This article will highlight how to select a put strike based on our overall market assessment.
Market assessment data published in BCI newsletters
- Investor Business Daily’s market assessment
- Dr. Eric Wish’s GMI Index
- BCI market assessment
Each investor must establish criteria for determining market tone and categorize this parameter as bullish, neutral or bearish.
Pros and cons of various put strikes
For most of us who use puts to generate monthly (or weekly) cash flow or to buy stocks at a discount, we focus in on out-of-the-money put strikes. These are strike prices lower than current market value. In addition to generating put premium income, we will also have downside protection if share price should decline. Near-the-money (slightly below current market value) will generate the highest initial premium returns but give us the smallest amount of downside protection. These should be favored in neutral to bull market environments. Deeper out-of-the-money put strikes (much lower than current market value) should be considered in bear or volatile market scenarios.
We must first set a range for initial premium returns. Let’s say our range for initial returns is from 1-4% per month. To evaluate a real-life example, I have selected Applied Materials (AMAT), a stock on our Premium Stock List as of 5/17/2017.
Options chain for AMAT as of 5/17/2017

AMAT Options Chain as of 5/17/2017
With AMAT trading at $43.56 on 5/17/2017, we view the out-of-the-money $43.00, $42.00, $41.00 and $40.00 strikes. The published bid prices range from $1.42 to $0.48 per share. Note that the bid-ask spreads are small so negotiating with the market-makers by leveraging the Show or Fill Rule does not apply here. The deeper out-of-the-money we go, the lower the option premium. Next, we enter this information into the BCI Put Calculator (click on link for a free copy of the single-column BCI Put Calculator):
Put calculations for AMAT as of 5/17/2017
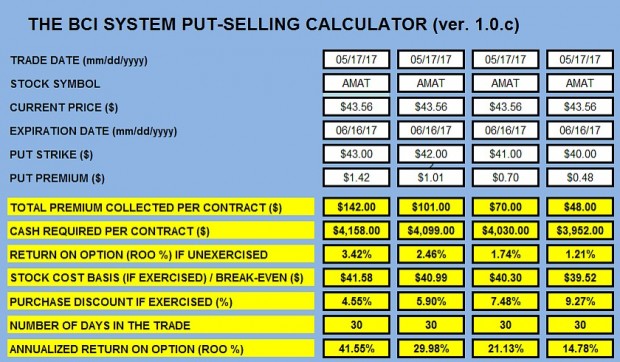
AMAT Put Calculations with the BCI Put Calculator
Let’s focus in on the two extremes, the $43.00 closest-to-the-money strike and the $40.00 furthest-from-the-money strike.
$43.00 put strike
This strike generates an unexercised return of 3.42% or 41.55% annualized. If exercised, shares are purchased at a cost basis of $41.58 or a 4.55% discount from the original price of $43.56.
$40.00 put strike
This strike generates an unexercised return of 1.21% or 14.78% annualized. If exercised, shares are purchased at a cost basis of $39.52 or a 9.27% discount from the original price of $43.56.
Matching strikes with market assessment
In a bull market environment, we would favor the $43.00 which yields a higher unexercised return. With a positive market tone, shares are less likely to move below the strike. In a bear market, we would favor the $40.00 strike where share value would have to decline by more than 9.27% before we start losing money. View these decisions as a negotiation where we base our choices on the tone of the market at the time. We can adjust on a monthly basis. Chart technical will also play a role in our bullish/bearish strike price decisions.
Discussion
DuPont has a new ticker symbol
DD is now DWDP: DuPont from our Blue Chip Report:
Shares of DuPont and Dow ceased trading at the close of the New York Stock Exchange (NYSE) on Aug. 31, 2017. DowDuPont will start trading on the New York Stock Exchange under the stock ticker symbol DWPD. Pursuant to the merger agreement, Dow shareholders received a fixed exchange ratio of 1.00 share of DowDuPont for each Dow share, and DuPont shareholders received a fixed exchange ratio of 1.282 shares of DowDuPont for each DuPont share.
Next live events
October 4, 2017
All Stars of Options (just added)
How to Select the Best Options for Covered Call Writing in Bull and Bear Markets
10:00 AM to 10:45 AM
Hyatt Regency Dallas @ Reunion
October 5, 2017
October 10, 2017: Palm Beach Gardens Florida:
7 Pm to 9 PM
Using options to Generate Monthly Cash and to Buy a Stock at a Discount.
LOCATION: Publix Greenwise Market (2nd floor)
11231 Legacy Avenue (Legacy Place)
Palm Beach Gardens, FL 33410
The club charges $10 at door to cover expenses.
Market tone
Global stocks rose modestly this week. The price of West Texas Intermediate crude oil rose to $49.87 from last Friday’s 47.59 while the Chicago Board Options Exchange Volatility Index (VIX) declined to 10.17 from 12.34. This week’s economic and international news of importance:
- In response to North Korea’s nuclear test conducted a week ago, the United Nations Security Council unanimously voted to adopt US draft resolution to impose new sanctions
- The yuan strengthened 6.7% against the US dollar this year, recovering all of last year’s decline of 6.6%. However, the surge is causing a drag on China’s export growth and threatening to deplete profits for many manufacturers selling in foreign markets
- The Bank of England voted to keep interest rates at 0.25% but indicated that inflationary pressures may prompt an increase in the coming months. British inflation increased to 2.9% in August, well above the central bank’s target of 2
- UK unemployment fell to 4.3%, the lowest level in more than 40 years, but wage growth continued to lag behind price increases
- In response to the surge in gasoline and housing rental prices, the US Consumer Price Index rose by 0.4% in August, up from 0.1% in July, and increased 1.9% year on year compared with July’s 1.7%
- Gasoline prices increased 6.3% and are expected to rise further in September as a result of the temporary closure of refineries in the wake of Hurricane Harvey
- US median household income sustained strong growth for the second consecutive year, rising to 59,039, a 3.2% more than a year earlier
- Poverty levels fell to 12.7%, the lowest level since 2007
- August retail sales were down 0.2% month over month, below consensus expectations of a 0.2% rise and worse than July’s downwardly revised 0.3% increase
- Auto sales decreased 1.6% month over month, possibly as a result of Hurricane Harvey
- The Empire manufacturing index for September beat expectations, coming in at 24.4 versus the 18.0 expected
- Labor market indicators pointed to a modest increase in employment and hours worked, and both input and selling prices rose at a faster pace than last month
- Moody Analytics estimates that damage caused by hurricanes Irma and Harvey could cost between $150 billion and $200 billion to repair. As a result, Moody’s expects US GDP to decline a half point to 2.5% for the third quarter but added that it expects fourth-quarter GDP to rally
- At its September policy meeting, the US Federal Reserve will most likely hold interest rates steady at 1.25%. Fed officials are also expected to announce when they will start to reduce the central bank’s $4.5 trillion balance sheet
- The scope and timing of any tax reform remains unclear. At a Politico event on Thursday, US secretary of the treasury Secretary Mnuchin said that a widely anticipated blueprint on taxes due from the “Big Six” group of senators late this month will propose a specific corporate tax rate and discuss in detail the deductibility of corporate interest
THE WEEK AHEAD
Mon, Sep 18th
- Eurozone: Consumer Price Index
Tue, Sep 19th
- None
Wed, Sep 20th
- UK: Retail sales
- US: Fed interest rate decision
Thu, Sep 21st
- Japan: BOJ interest rate decision
Fri, Sept 22nd
- Canada: Retail sales and Consumer Price Index
For the week, the S&P 500 rose by 1.58% for a year-to-date return of 11.68%
Summary
IBD: Market in confirmed uptrend
GMI: 6/6- Buy signal since market close of August 31, 2017
BCI: I am currently favoring in-the-money strikes 2-to-1.
WHAT THE BROAD MARKET INDICATORS (S&P 500 AND VIX) ARE TELLING US
The 6-month charts point to a neutral to slightly bullish outlook. In the past six months, the S&P 500 was up 5% while the VIX (10.17) moved down by 12.5%.
Much success to all,
Alan and the BCI team
Expiration weekend report:
Account value increased by 3.8%. (very happy).
Must remember last month loss of 0.4%, so total 2 months is 3.4%, averaging 1.7% per month increase. (still very happy)
6 positions were exercised.
1 position rolled out and up.
2 positions liquidated on 09/11 before expiry with nice gains. (used part of the resulting cash to enter new buy/write for the 10/20/2017 contract cycle.
Now I am 74% in cash, waiting for the new stock screen, and planning to be fully invested again by the end of next week.
Roni
Roni,
As Spindr0 mentioned in an early blog post, as a writer or seller of a call, you had 6 positions assigned. The option holder, the other side of the trade is the one that exercises the calls.
I am wondering why you had 6 positions assigned instead of rolling them over, since I assume they were on the Run List in the recent or past months. Is it because the stocks had a gap up that you did not want to spend the cash for a Buy to Close net debit combination to roll over continue the position.
I found myself Unwinding 1 position in Week3 at 0.1% loss (0.05% to 0.2% loss, including commission and fees, and 3 positions in day 3 of week 5. For the Week 3 trade, I lost $52 per contract and then wrote new contracts in Week 3 for LOPE with $300 additional income per contract, even in Week 3. I found LOPE using my Watch List in Finviz.com.
.
For the other 3 trades in Week 4, my actual loss in unwinding was $7 to $30, releasing valuable cash for me to work on. I figure I could use the cash to sell additional contracts in the remaining days if an opportunity arises. Waiting for Expiration Friday and rolling, I still have to spend money for the Buy to Close and be forced to Sell-to-Open at a higher strike.
Another advantage is I have eliminated the time on Expiration Friday for rolling, which does take time if you have other trades as well. It’s a relief to get them out of the way for a small loss and get me some cash to play with. That’t the way I look at it now. I have been able to make additional income with this point of view.
Of course, if the Premium is not near the 0.1% loss value, I will wait for Expiration Friday and then roll or decide to let it be assigned.
Meanwhile congratulations on the 3.8% gain or >40% annualized. I will be posting my results soon as well with the same table I posted last month, which includes my YTD% gain, which I think is also a valuable benchmark since it reflects your current year performance, including the effects of the monthly ups and downs.
Mario
Hi Mario,
Every expiry Friday, the successful trades pose a challenge: should I roll, or let it be exercised (assigned) ???
Tough decision. Nobody knows what’s going to happen next.
This month we will have a 5 week cycle, long time to forecast, but also you get an extra week to place your trades carefully, and 2 Stock Screens from Barry, to guide us.
So I decided to let them go, and realize my gains.
I may re-enter the same trades, depending on the odds and the ROO.
Thank you for your kind words.
Roni
Very good Roni! I’m happy enough to have made 3.25% this month (calculated using Total Invested – Premium Rec’d, divided by Profit) for a three month average of 2.6%. The Russell 2000 gained 5.40% for the month, but only 0.6% over the last three months, so I’m currently besting that by 7.2% (would be great if that could continue!) 🙂
Personally I like to turn over as many rocks as possible in my search for cc nuggets, so my input list for cc’s incorporates all the BCI stocks for the last ten months or so, which is no problem since I figured out how to run an automatic scan, as I mentioned before. Basically I’m looking for ‘well-behaved’ charts that have being rising slowly but steadily without much in the way of violent movement. Of course most of those don’t offer particularly good premium, hence the large input list.
Justin
Justin,
Thanks, and very nice results for your portfolio too.
Your spread sheet capabilities are formidable, and give you a great advantage.
Each expiry weekend I register my “account value” wich I watch daily on my Schwab “Market Value” tab.
Subtracting last month total from current total, I divide the result by last month’s total to obtain the percentage gain/loss shown in my report.
My benchmark is the annual result obtained from my other investments, which are all ridiculously small.
Mutual fund, bank savings accounts, both in the US and in Brazil.
Real estate in Brazil is very depressed here after the 3 year recession.
So, hurray for the BCI methodology.
Roni
Roni,
Re Schwab I see they’re merging with OptionsXpress – I’d contacted OptionsXpress online and they told me they’ll be able to accept Australian customers after October 9. I don’t know about you but I don’t want all my investable funds with one broker in case they go under (currently still trading with IB.)
Also all brokers I’ve contacted inform me they enforce T + 2 and say it’s the same for everyone, so I’m rather mystified that others here are telling me they can immediately reinvest funds after closing a position, rather than being forced to wait two trading days (at least it’s better now than T + 3, which ended September 5.)
Justin
At Fidelity or Optionshouse, I all the time Unwind a position and then re-invest and open a new CC on the same funds. As long as I do not make changes to those re-invested fund before the original unwind settlement date, I am fine. Otherwise i will get a violation. (I do get warning messages from Fidelity making me aware I could have a possible violation in the future. When I have called up about this, the rep advises me you can trade it but you cannot turn that trade around again until settlement occurs on the original funds)
In Fidelity, Cash I can use is labeled “Cash Available to Trade” (Browser and Platform)
At Optionshouse / Etrade, the line I look at is:
Browser: “Cash Purchasing Power”
Platform: “Cash Buying Power”
What I interpret from you is that your broker makes you wait 2 days or more before that cash is released for you to place a new Covered call or other trade.
The only other times I have restrictions are reserve funds when I set an automatic order (GTC) to Buy to Close for Alan’s 20/10% Rule when a stock declines. Since it uses cash to buy the closing, I cannot use the cash I am committing for the Buy to Close. I notice when that happens with OptionsHouse/Etrade, it includes the Commissions and Regulatory Fees. I am not sure if Fidelity includes the commissions and Regulatory Fees.
When a stock has gapped up, I set an order to UNWIND a position ITM at my 0.1% Loss threshold (time value is 0.1% of my ITM Strike), I do not have any reserve funds, since it is Credit Limit order (Selling Underlying). The credit limit I use, as I have presented before is: Strike – Time Value which is identical to the Stock price – Premium Paid to Close.
Mario
Juntin,
One other difference I see between Fidelity and Optionshouse/Etrade is regarding the charging of the base fee.
When I unwind (Sell) or Buy a CC call Contract and Underlying stock, Fidelity only charges me 4.95 base plus contract and Regulatory Fees. Optionshouse/Etrade however, charges me for each leg the $4.95 base plus contract fee and Regulatory fees.
For both Brokers, when I Roll a contract (Buy to Close, Sell to Open legs) , they only charge me once the 4.95 Fee.
It’s nice now that both brokers are now open 24 hours to answer questions. Fidelity has been superb with this 24 hour service.
I have been using the Chat service with Etrade successfully and easily resolves questions I have had. I recently linked an very old Etrade Brokerage joint account which had been unused for several years but had $3 in the Savings account portion. Discovered I could change the Nicknames on the account to reflect the Joint and Individual accounts accurately. The Nicknames transferred over the platform accounts as well.
Regarding trading levels or trading plans:
I am approved with both Brokers to CC and Cash Secured Puts for both my Individual and IRA accounts.
With Fidelity Level B trading plan give me the Cash Secured Puts capability and hedged Puts (protective puts), Included also is the capability to buy Call or Buy Puts since you pay with cash the Buy to Open and there is a limited risk of the premium you pay. With Level B I can do combination straddles (Buy a Put and Call combination). I can also purchase Collars (similar to a Covered call plus protective put usually for a longer term).
What I can’t do, it has become clear to me is that capability to do Vertical Spreads like you see in Options Action on TV. That requires a margin account and I am ready to do that at this time.
I plan to try buying a call one of these days when I see the right buying opportunity and just to see how it works out. I will accept the limited loss if I get burned.
Had a difficult time with Fidelity adding Cash Secured Puts capability to my Joint Trust Account. Finally got it done after understanding and finding out the problem was that I had to mark my objective as “Most Aggressive” to Options Applications to get it approved.
Mario
Hey Mario.
I replied below shortly ago then read the last half of this post in greater detail.
I have Level 3 clearance at Options House/e-Trade in my IRA. I can do any zany options trade under the sun I want :). There is not a doubt in my mind you could get the same clearance on request filling out an on line form or just calling them.
I love the Options Action guys every Friday on MSNBC too and have made more than I have lost taking their spread trades in my IRA. Since vertical spreads have a defined risk they usually only take Level 2 so I am surprised you can not do them now.
CC’s and CSP’s along with buying calls and puts are all in Level 1 clearance. If the accounts are a trust or have other stipulations I suppose that could be a factor. But for a straight IRA you should be able to make any options trade you desire with routine extra clearance. – Jay
Mario,
Some brokers permit spreads in an IRA account. I believe that Fidelity is one of them and they require a “Supplemental Options Spreads Agreement” to enable this.
Since you have approval for Level 1 (covered calls and long protective Puts) as well as Level 2 (long call or put), it’s often a matter of just asking for Level 3 approval (spreads). If there’s any resistance, explain that it is just a more expedient way of doing what you are already approved for.
IOW, buy long stock and sell an OTM covered call (Level 1) then buy an OTM put (Level 2). That 3 legged position is collared long stock and is synthetically equivalent to a vertical spread. Many brokers will immediately approve you for Level 3 if you have been trading on Levels 1 & 2 for awhile and you can explain that you understand this equivalence.
Spin
Justin P,
SIPC insurance provides up to $500,000 protection for securities and cash with a $250,000 limit for cash so if under than cap, a broker going under isn’t your main problem. If there is any delay in account accessibility with no ability to defend, your positions, you may incur losses. That’s why it’s a good idea to have funds at a second broker so that if need be, you can place offsetting positions to limit the risk. As an example, buy the synthetically equivalent put to offset a covered call.
Spin
Thanks guys, I seem to recall that Fidelity and Etrade are US-only brokers so not relevant to me here in Australia. Actually I was surprised to find the funds from my exercised ITM cc’s in my account before the start of Monday’s trade at IB, so hopefully that will continue!
Spin – under that cap at the moment but won’t be after a year or so unless I switch a bunch of money to a new broker; will probably be Schwab since I can’t seem to find any other good alternatives (I only want to go with the largest firms to limit the risk.)
Justin
Roni and Justin,
Congrats on fine months – nice trading/investing!
In my market reading Friday I learned in 8 out of the last 10 years next week, which is the week after Friday’s “Triple Witching expiration” in the US options markets, the DOW has been down. So I played the odds selling a few overhead call spreads and buying a few ITM puts on some Dow stocks for this Friday expiration just for fun. Now watch them all go up :)!
We get “Fed Speak” in the US markets Wednesday. I have learned the hard way to be careful before shorting Fed Chair Yellen or Trump. Neither admit it but both seem to have an up US market as a success measure.
I shared recently I was leery of September into October expiry. That hunch has not paid so far. I sold some SPY at 248.3 on 9/1 and it closed at 249.19 Friday. Same day I sold some QQQ at 146.14 and it closed at 146.06 Friday.
It could well be I got off the bus too soon on part of my position. That is always the risk when you try to time the market. SPY and QQQ were winners I was protecting in a time of year I pay particular attention to seasonality.
On ensuing down days I sold October CSP’s under SPY at 242 and under QQQ at 139. So we shall see if those are just income trades I keep inching up every month or if I buy back below where I sold plus some premiums on a dip.
For all friends here with fresh expiry cash itching to put it back to work tomorrow I offer a cautionary thought for your consideration: US Fed announcements can be like earnings reports. If you see stocks on the Premium list you like that get a haircut tomorrow or Tuesday please buy them. Then wait until after the Fed announcement on Wednesday to cover them.
Please take advantage of the 5 week expiry for October. Let time and the news cycle work for you. – Jay
Jay, Thanks for the heads up on the Fed Announcement and considerations for your cash position in advance of that Fed Time Event. Mentioning it will help some of us re-think our actions early in the week.
Mario
Good morning Mario,
Thanks for your always helpful insights in your posts above. It is informative listening to an investor like yourself who has experience with a few different brokers.
I was very satisfied with Options House for years. But this old dog has to learn new tricks since e-Trade bought them. They threw me a bone grandfathering my commission rates so I am rolling over playing happy with it for now :).
I am typing this as the US market opens Monday morning. I am not expecting much movement until the Fed announcement Wednesday. But we have a nice little uptick this morning which I could have predicted since I opened bearish trades on Friday :)!
That’s OK, I am still 50% long and I have some underneath sold puts so it’s fine if my small short trades for Friday don’t work. But I am a greedy old coot and want my cake and eat it too :)!
A successful week to all. – Jay
Thanks Jay,
The market was favorable, and that makes it far easier to manage our trades successfully.
Let’s see what the FED meeting will cause.
I’m holding 50% in cash while waiting.
Good luck to you.
Roni
Good morning Roni,
I am in Central time US so I will be tuned for the 1PM announcement. As Justin mentions below betting against Yellen and the Fed has been a losing proposition so it will not surprise me if the market responds favorably and we get some decent call prices for current holdings this afternoon. Often there is a “sell the news” profit taking dip the following days which might present some buying opportunities for our ready cash. – Jay
Premium Members,
This week’s Weekly Stock Screen And Watch List has been uploaded to The Blue Collar Investor premium member site and is available for download in the “Reports” section. Look for the report dated 09/15/17.
Also, be sure to check out the latest BCI Training Videos and “Ask Alan” segments. You can view them at The Blue Collar YouTube Channel. For your convenience, the link to the BCI YouTube Channel is:
http://www.youtube.com/user/BlueCollarInvestor
For all of The Blue Collar Investor community that are impacted by hurricanes Harvey and Irma, our thoughts and prayers are with you. Stay safe…come back even stronger…
Best,
Barry and The Blue Collar Investor Team
Barry,
Re DWDP – no chart to speak of, and EarningsWhispers haven’t heard of it; I’m assuming you must be unusually bullish on it’s fundamentals then? 🙂
Justin
Justin P.
DowDupont.
Alan posted this on last blog:
“DD is now DWDP: DuPont from our Blue Chip Report:
Shares of DuPont and Dow ceased trading at the close of the New York Stock Exchange (NYSE) on Aug. 31, 2017. DowDuPont will start trading on the New York Stock Exchange under the stock ticker symbol “DWDP.” Pursuant to the merger agreement, Dow shareholders received a fixed exchange ratio of 1.00 share of DowDuPont for each Dow share, and DuPont shareholders received a fixed exchange ratio of 1.282 shares of DowDuPont for each DuPont share.”
Hey Justin,
Re: DWDP
[1] Passed IBD Smart Select (Composite rating of “95”…top 5% of all stocks)
[2] Chart:
– Meets all BCI requirements…candle entirely above 20 EMA, 20 EMA above 100 EMA…passed MACD…passed Slow Stochastics
[3] ER date came from the CBOE website…I use 4 different sources for ER data, with Earnings Whispers (EW) as the primary source. If EW does not have the date, I then go to the other sources that I use.
[4] No risk reward rating yet…just started trading under new symbol (DWDP, Dow DuPont) post merger
[5] Other non-BCI services rate DWDP as a buy
I hope this helps. If not, please get back to me (barry@thebluecollarinvestor.com).
Best,
Barry
Thanks Barry and Terry – actually I see that DD itself has one of my favorite types of chart – a mostly long and steady uptrend (that’s looking on CBOE – if you type in DD on MarketWatch you get a stock called DoubleDragon).
Post offices in SE Florida:
Most post offices here in southeast Florida are back up and running. We were shipping books and DVDs from our satellite office in New Jersey but inventory was depleted so more recent orders were shipped from Florida. At the time some post offices were running on generator partial power and those shipments may be delayed.
I hope all our friends in Texas and Florida stayed safe.
Alan
Some ideas for your shopping trolley:
CORT 17’s
EDU 84.57’s
LITE 56’s
YY 74’s
That’ll do me for today anyway.
Thanks Justin,
Excellent ideas as always! Up here in the US the “White haired lady” sings tomorrow. That is usually worth waiting for. – Jay
Thanks Jay, I’m getting up at 3 a.m. to run scans and place my trades btw – that’s ok though, I’ve got the rest of the day free to go hiking or whatever 🙂 I’m not sure it matters that much what tune or lyrics Yellen warbles – the algo’s seem to be set to ‘buy the news’ and ‘buy the dip’ so it can be risky to try and fade that. Still got some money burning a hole in my pocket but I’ll probably stick to ITM trades this month – here’s a snapshot though of some potential
OTM candidates from my latest scan:
Justin
And those four I mentioned above – all good chunky ROO’s with substantial Downside Protection, though somewhat less in the case of EDU, which I’m happy to accept as EDU’s chart is ‘safer’ in my opinion (much less volatile, good areas of support.) All charts are in uptrends, which I think should be a minimum requirement for bullish trades. So tell your fund manager buddies and hopefully they’ll buy a few million and bump the prices up 🙂
Great stuff, Justin!
I don’t know if I would have gotten any further in my working years if I had your spreadsheet and computer skills but I would have been able to impress the “whiz kids” on my staff that grew up with iPhones and laptops :)! – Jay
Great XLS Scan results – Justin. Thanks for the information.
Mario
Thanks Jay & Mario. I’m treading cautiously again this month, and for the opposite reason to last month – instead of plunging downwards, the market’s been sprinting upwards instead, so I’ve been waiting for the second week to put on more positions. Not so much of a rush anyway with a five week contract I think.
Justin
Premium members:
This week’s 8-page report of top-performing ETFs and analysis of ALL Select Sector Components has been uploaded to your premium site. The report also lists Top-performing ETFs with Weekly options as well as the implied volatility of all eligible candidates. For your convenience, here is the link to login to the premium site:
https://www.thebluecollarinvestor.com/member/login.php
NOT A PREMIUM MEMBER? Check out this link:
https://www.thebluecollarinvestor.com/membership.shtml
Alan and the BCI team
Alan,
I have recently purchased your book complete encyclopedia for covered call writing.
I have a question on options,is the option value always decreases as it reaches towards expiration (as the time value decays).
I want to write the covered calls for existing my stocks to called away,should I be choosing way OTM strikes?
Thanks,
Harini
Harini,
It is true that the time value of an option will decrease as expiration approaches but the total premium value may increase due to increase in share price or volatility.
Now, if we want to write a call and sell our shares, the deeper out-of-the-money we go, the less likely will be exercise (the strike expiring in-the-money). If you want to continue to generate additional income and hold the stock but if exercise occurs, you’re okay, then out-of-the-money strikes would work.
If you’re looking to sell the shares via option exercise, in-the-money strikes are more appropriate.
Alan