The index short put strategy is a form of selling cash-secured puts. It is a bullish strategy with the goal of generating premiums selling put options that expire worthless. Traditionally, at-the-money strikes are sold. As opposed to using stocks and exchange-traded funds as the underlying securities, index options are cash-settled at a profit if the strikes expire in-the-money (with an intrinsic value component). In other words, no securities will be sold or “put” to us but cash will exchange hands.
The options trader using the index short put strategy projects that the underlying index value to be above the put strike price on the expiration date, leaving the strike price out-of-the-money and expiring worthless.
Profit Potential
Maximum profit is limited to the premiums received for selling the index puts as with all forms of selling cash-secured puts. This is one of the distinguishing features of put-selling compared to writing out-of-the-money covered calls where share appreciation up to the strike can generate a second income stream for that trade.
Formula for calculating maximum profit is:
- Max Profit = Premium Received – Commissions Paid
- Max Profit Achieved When Index Settlement Value is greater than the Index Put Strike Price, leaving the strike out-of-the-money on expiration
Profit and Loss Graph
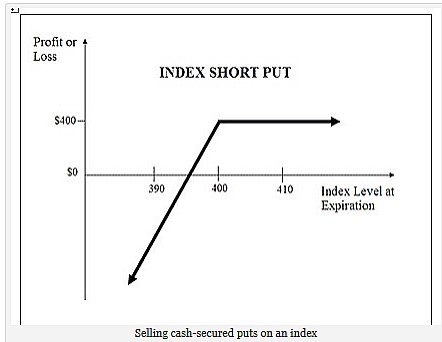
Unlimited Risk
P&L graphs for option-selling are misleading in that they make the assumption that no action is taken when value of the underlying security drops dramatically.
Formula for calculating loss
- Maximum Loss is technically unlimited
- Loss Occurs When Index Settlement Value is less than the Index Put Strike Price – Premium received
- Loss = Index Put Strike Price – Index Settlement Value – Premium Received + Commissions Paid
Breakeven Point
Calculated using the following formula:
- Breakeven Point = Index Put Strike Price – Premium Received
Real-life example
The S&P 500 is one of the most commonly used benchmarks for the overall U.S. stock market. The ticker for this index is SPX or $SPX. Let’s set up a real-life trade using published pricing and not negotiating the bid price with the Show or Fill Rule:
- SPX trading at $2120.95 on 4/27/2015
- $2120 (near-the-money) put for 6/19/2015 has a bid price of $40.00
Let’s enter this information into the BCI Put Calculator (get a free copy by clicking on the “Free resources” link on the black bar of these web pages):
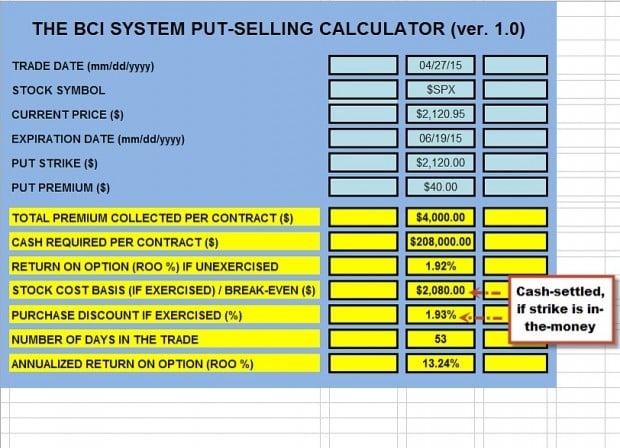
Put calculations for SPX
Note the following:
- The amount of cash required to secure the put is (strike – premium x 100) = $208,000, the maximum loss if index drops to zero and no action is taken
- If the strike expires out-of-the-money (unexercised) the profit is 1.92% which annualizes to 13.24%
- The breakeven is $2120.00 – $40.00 = $2080.00
The put-seller believes that SPX will rise moderately over the next 53 days. If that occurs, the strike will end up out-of-the-money on expiration and the option will expire worthless, the best case scenario.
Let’s say SPX dropped to $2000.00 and the put expired in-the-money by $120.00.. Upon assignment of this option, the trader is required to pay a settlement amount of $12,000 ($120.00 x 100 shares) per contract. Taking into account the premium received for selling the option, which is $4000.00, the trader’s net loss comes to $8000.00. This, of course, assumes no management intervention as the index plummeted from $2120.95 to $2000.00.
If SPX remained above $2120.00 by 6/19/2015, the put expires out-of-the-money. The index put option will expire worthless with no intrinsic value. The trader’s net profit is therefore equal to the amount received for selling the index put option which is $4000.00 or 1.92%
Other popular index options include the Dow Jones Industrial Average Index Options (DJX) and Nasdaq-100 Index Options (NDX). Index options are typically cash settled.
Next live appearances
1- St. Louis, Missouri
September 15, 2015
6:30 PM – 9 PM
2- All Stars of Option Trading
September 16, 2015
Discussion panel
New York Stock Exchange
4:20 PM – 5:15 PM

Market tone
US stocks slid while European stocks rose this week, and Asian shares were mixed. A positive US monthly employment report was seen as increasing the likelihood that the Federal Reserve would raise interest rates in September. This week’s economic reports:
- The US economy added 215,000 jobs in July, and the May and June stats were revised up by 14,000 for an average of 235,000 per month, up from the first quarter’s average of 195,000
- The unemployment rate remained at 5.3% and labor force participation at 62.6%, a 38-year low
- Full-time jobs rose to 81.7% of total employment, the highest share since November 2008
- Hourly pay rose 0.2% over the month and 2.1% from a year earlier, while the average work week increased 6 minutes to 34.6 hours
- Crude oil futures fell for a sixth straight week, with OPEC maintaining its output and US crude oil inventories remaining high
- The US trade deficit widened 7.1% to $43.8 billion in June
- US manufacturing activity grew at a slower pace in July, as the Institute for Supply Management’s purchasing managers’ index fell from 53.5 in June to 52.7
- New orders rose from 56.0 to 56.5
- Initial jobless claims edged up 3,000 to 270,000 for the week ending August 1st, marking the 22nd consecutive week of initial claims below 300,000
- Continuing claims declined 14,000 to 2.26 million for the week ended July 25th
For the week, the S&P 500 declined by 1.25% for a year-to-date return of 0.91%.
Summary
IBD: Uptrend under pressure
GMI: 3/6- Buy signal since July 30, 2015
BCI: Cautiously bullish using an equal number of in-the-money and out-of-the-money strikes. An interest rate hike is more likely in September after the recent jobs report and this may have a temporary negative influence on the market.
Wishing you the best in investing,
Alan (alan@thebluecollarinvestor.com)
Premium Members,
This week’s Weekly Stock Screen And Watch List has been uploaded to The Blue Collar Investor premium member site and is available for download in the “Reports” section. Look for the report dated 08/07/15.
Also, be sure to check out the latest BCI Training Videos and “Ask Alan” segments. You can view them at The Blue Collar YouTube Channel. For your convenience, the link to the BCI YouTube Channel is:
http://www.youtube.com/user/BlueCollarInvestor
Since we are still in Earnings Season, be sure to read Alan’s article, “Constructing Your Covered Call Portfolio During Earnings Season”. You can access it at:
https://www.thebluecollarinvestor.com/constructing-your-covered-call-portfolio-during-earnings-season/
Best,
Barry and The BCI Team
Alan,
I am a new premium member and have a question on the running list section. Can you explain the column NTM OI > 100 Contr. I may have more questions as I go through all the information in the report. Thanks
Jorge,
This column has to do with option liquidity. We require at least 100 contracts of open interest (not VOL) and/or a bid-ask spread of $0.30 or less for near-the-money strikes. Inadequate option liquidity can result in wide-bid ask spreads and unfavorable trade executions if we need to buy back an option. Check the key above the “Running List” for more explanations. Let me know if you need further clarifications.
Alan
Devaluation of the Chinese Yuan by China’s Central Bank last night will have an impact on US exports to China and may effect the Fed’s decision on raising interest rates. Our stock market may struggle initially to evaluate the impact of this unexpected decision.
Alan
Alan,
Nice market alert time stamped well before the open!
I have found news related dips create great stock buying and cash secured put selling opportunities. But something feels different about this dip. And with many weeks of poor seasonality ahead along with possible budget battles and international issues it seems a good time to sell calls on up days and cash secured puts on down days well out of the money. My two cents, anyway.
As for the headline blog above I had to get extra options clearance in my IRA from my broker to trade the index derivatives like SPX. That in itself is no big deal but it is something to be aware of for any of our friends here who feel new to the game.
My hunch is most of us who desire the relative safety and diversification of the index but still want to “own something” might be better served using the high volume and high open interest ETF’s like SPY, QQQ, IWM, EEM, etc..
Yet, alas, while the market may seem volatile day to day it is still in a range. VIX is low historically and there is not much premium to be found at the moment. So it is natural to call up options chains on the ETF’s above and think “Why bother?”
An alternative is the Premium Members List stocks from Barry and the Team with lower Beta’s and start your cash secured put selling on those to be followed by covered call writing if you accept ownership over exit strategies on your puts.
As always the greatest advantage we have as options sellers is flexibility! – jay
Hi Jay,
I bought a new machine, and was away from the blog for a few days.
Therefore, I saw your kind reply to my last post and answered, but one week too late.
Sorry about that.
My new machine is super fast.
Cheers – Roni
Alan, just to first say I eventually found an ETF to replace the stock I got rid of last week, but as I’m unsure if this was the right decision my first question is about this:-
1. Now if in the expiry w/end and I want to use ETF’s for the following Monday, then should I use the last ETF report that was out or is it better to wait a few more days for the next one due?
Here are some other things I had to throw out to you,-
2. How much importance do you put on the R/R ratings of stocks you want to choose between, or do you use it as a secondary screen(like beta) where you then most likely go for the higher rating(R/R)?
3. I had years ago read a book from someone about writing options, and in it she says that we shouldn’t rolldown a stock more than once, because she thinks we would just keep compounding our losses.
Would you agree at all with this statement from her?
4. And when rolling out any option, then is it always advised that the best time to do this is on expiry day, and as close to the market close as possible?
More still to come next week now. Thanks
Adrian,
1- Use the most recent Stock of ETF Report when you are ready to make a trade but check to make sure chart still looks good and no egregious news came out since that report (www.finviz.com).
2- It must meet are requirement of “5” or higher and then becomes a secondary consideration.
3- Not necessarily. Each trade needs to be evaluated on its own merit. I may stick with a stock if the decline is based on overall market movement. This stock may actually be out-performing the market.
4- Yes. Theta will decrease the near-term premium more than the next month premium due to the logarithmic nature of time value erosion for near-the-money strikes. We must make sure we don’t cut it too close and miss the 4PM ET deadline.
Alan