Strike price selection is a critical concept needed to master covered call writing. Selling in-the-money strikes is the most conservative approach to this strategy and selling out-of-the-money strikes is the most bullish. We use the latter when the overall market is bullish and chart technicals are bullish and confirming. Once we have decided that a bullish approach is indicated the next decision is how far out-of-the-money should we go when writing our calls.
Let’s first review the pros and cons of a deep OTM call vs. an OTM with a lower strike price:
Advantages
- More room for share appreciation
- Less likely to be assigned
- The net effective sale price (NESP- call strike price + call premium) is higher
Disadvantages
- Lower call premiums
- Lower final returns if share price remains static
If we decide to sell deep OTM strikes we must be bullish on the overall market and the stock itself. The way to determine how far OTM to go we must first set our investment goals for the month. In the BCI methodology our goal for a 1-month initial return is 2-4% for stocks and 1-2% for exchange-traded funds. Of course, each investor can tweak these guidelines based on their personal risk tolerance. The deeper OTM we go, the closer to the 2% figure we get (and then below) and the further from the 4% stat. Let’s take a look at a real-life example using one of the stocks on our current Premium Stock List: YNDX:
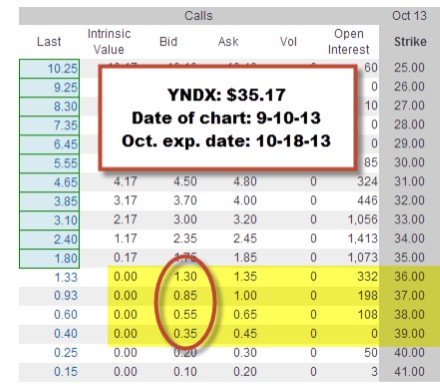
Options chain for YNDX
Please note the following:
- On 9-10-13 YNDX was trading @ $35.17
- We will look at the October 18th expiration, 5 weeks away
- We will evaluate 4 OTM strikes: $36, $37, $38 and $39
- Bid prices range from $1.30 down t0 $0.35
Next we will enter the options chain information into the “multiple tab” of the Ellman Calculator:

Ellman Calculator: multiple tab for YNDX
The 2 strikes that meet our criteria of a 2-4% initial return (ROO) are the $36 (3.7%) and $37 (2.4%) strikes. The $38 strike just misses at 1.6% but can be used at the investor’s discretion. Same holds for the $39 (1%) strike. The maximum returns for the 2 strikes that do meet our initial criteria are 6.1% for the $36 strike and 7.6% for the $37 strike. The ultimate decision rests with the individual investor. For me, I would opt for the $37 strike and be happy with a 2.4%, 5-week return and thrilled with a 7.6% 5-week return. As always, we must follow our exit strategy guidelines once these positions are entered.
Conclusion
Deep OTM strikes can be used in a bull market environment with strong chart technicals. The higher the strike selected, the lower the initial return but the higher the maximum return possibility. Strike selection should be based on sound fundamental, technical and common sense principles along with your personal risk tolerance comfort level.
LAST WEEK: DISCOUNT COUPON FOR NEW EXIT STRATEGY DVD PROGRAM
A live seminar presentation and extensive Q&A of ALL scenarios that can arise after entering a covered call position and how to manage them to help mitigate losses and enhance gains. The Companion Workbook contains 47 all-color pages of all charts, graphs and slides used during the presentation. Purchase now for an early bird discount:
Regular price: $125
Early bird discount $99 + FREE SHIPPING
Use promo code ESDISCOUNT
Be sure to use this promo code to receive the discount @ checkout. Premium members have received a promo code via direct email.
This is a LIMITED TIME OFFER
Here is a link to our store:
https://www.thebluecollarinvestor.com/store/
********************************************************************************************************************
Next live seminar:
September 24, 2013
Philadelphia Chapter of the American Association of Individual Investors
http://www.aaii.com/chapters/meeting?mtg=2469&ChapterID=22
6:30 PM Registration and 7 PM start.
The charge is $15 for pre-registration and $17 at the door.
Details are available on the above website.
Market tone:
The market reacted favorably to the surprise Federal Reserve’s announcement that it will maintain its aggressive bond-buying program (QE) to stimulate the economy by keeping interest rates low. This week’s mixed reports:
- The Fed expressed concern regarding weak employment and fiscal fighting in Washington. The committee does not expect a raise in Fed funds rate until 2015
- The Fed decreased its outlook for 2013 real GDP to the 2.0 – 2.3% range, down from the 2.3% – 2.6% range
- US housing starts were up 0.9% in August compared to a 5.7% increase in July
- Housing permits were down 3.8% in August although housing starts were up 19% from a year ago
- Single-family housing permits are at the highest levels since 2008
- Sales 0f existing homes in August were up 1.7% to an annualized $5.48 million units, the highest level in 6 years and above analyst expectations
- Single family and condo sales were up 13% and 16% year-over-year
- Housing inventory in August came in @ 4.9 months, less than the 6.0% from a year ago
- Industrial production increased by 0.4% in August better than the 0.3% predicted
- Fed officials project unemployment to drop to between 6.4% and 6.8% by the end of 2014 (7.3% last month)
- Consumer Price Index (CPI) rose by 0.1% in August, below the 0.2% expected mainly due to a decline in energy prices
- Core CPI (excludes food and energy) rose by 0.1% in August less than the 0.2% anticipated
- Year-to-year inflation rose by 1.8%, below the Fed’s 2.5% threshold for lessening stimulus programs
- The Conference Board’s index of leading indicators rose by 0.7% in August better than the 0.6% analysts expected
- Initial jobless claims for the week ending September 14th came in @ 309,000, lower than the 330.000 expected
For the week, the S&P 500 rose by 1.3% for a year-to-date return of 22%.
Summary:
IBD: Confirmed uptrend
BCI: Moderately bullish but taking a slightly defensive posture due to concerns over a possible government shut-down (here we go again). Selling an equal number of in-the-money and out-of-the-money strikes
Wishing you all successful trading,
Alan (alan@thebluecollarinvestor.com)
Hi Alan,
I have read your first two books, am almost done with your Encyclopedia, and have started paper trading to get a feel for covered call writing. But one thing has been nagging at the back of my mind: if this strategy is considered great for income generation why have buy-write mutual funds had such mixed success? I would be interested in your thoughts.
Thank you,
Paul
Paul,
I get dozens of questions per week (sometimes in a day!) and yours is one of the best. I’ll bet that this is one of the first questions I would ask if I were first learning this strategy. My responses:
1- Generally speaking, 70-80% of all actively managed funds underperform the S&P 500. That’s a staggering statistic and an important reason why retail investors like us must take control of our own financial future. Covered call writing funds are no exception and the last stat I read was only about 20% of them are outperforming the market. That may be why several money managers have been contacting me to help enhance their portfolios. Thus far, I have stayed focused on assisting fellow retail investors through education.
2- These funds are generally closed end funds (CEFs) meaning that cash is raised on a prescribed number of shares via an IPO. After that, no new shares are produced as with an ETF or as we would as our portfolios expanded.
3- Most generally sell only slightly OTM strikes, great for certain market conditions but not all
4- They charge a 1% administrative fee. This must be overcome just to breakeven
5- Many sell calls on indexes which, if exercised, may have to be delivered to the option holder.
6- Most do not sell calls on their entire holdings and use other strategies (maybe up to 50%) on the remainder of their portfolios.
7- Some sell puts for protection, decreasing yields
8- Most do not have an arsenal of exit strategies in place to manage positions the way we do
9- ITM strikes are never used, even in bear market environments
To sum up, it’s better to self-invest after educating ourselves and mastering the strategy.
Alan
Premium Members,
The Weekly Report for 09-20-13 has been uploaded to the Premium Member website and is available for download.
Also, be sure to check out the latest BCI Training Videos and “Ask Alan” segments. You can view them at The Blue Collar YouTube Channel. For your convenience, the BCI YouTube Channel link is:
http://www.youtube.com/user/BlueCollarInvestor
Best,
Barry and The BCI Team
Hi Alan,
Your youtube videos are great. Thank you for sharing your knowledge. I plan to buy your book next. I have a question for you.
When you sell a covered call do you have to hold the stock until the call option expires? Can you sell the stock if the price drops too much? Can you use stop losses when you sell covered calls, or do you have to just rely on the downside protection you get from selling the option?
Thanks,
Mark
Mark,
Glad you benefitted from my videos. Your question is an important one:
1- Yes, you must hold the stock as long as you still have the option obligation…this is what makes the position “covered” or protected.
2- If the stock price declines in value, the position can absolutely be managed to mitigate losses or enhance gains. I have devoted over 50 pages in my latest book (Encyclopedia…) to this one topic (exit strategies). FIRST, the option is bought back so you no longer have an obligation to sell your shares. Once accomplised you can sell the stock, sell a different option or take no immediate action. All this is detailed in my books/DVDs and must be mastered before you invest one penny of your hard-earned money.
3- Take your time to master the strategy and then you will have years and decades to benefit. You will be amazed at the amount of control this strategy affords us.
Alan
In searching for a strike or even a stock, why wouldn’t the implied volatility be of use in sorting out best return for the risk?
Bruce,
We are on the same page here as far as an option is concerned. In my view, the IV plays no role in stock selection (for our watch list) because I would never write a call on an under-performer given any IV.
As far as an option is concerned, assuming we are looking at calls with similar expirations, premium profit is mostly contingent on time value which is mostly impacted by IV. So we are in effect making our decisions based on our investment goals and personal risk tolerance. For example, I consider myself a conservative investor and would rarely use an option that returns > 6% for an ATM, 1-month option. The reason: the IV is too high and therefore so is the risk. On the other hand, I would rarely use an option that returns < 2% for a 1-month option (unless using ETFs) because the IV is too low and the returns will not meet my goals. This topic is detailed in my books and DVDs. Therefore, your point is a good one and right in line with the BCI methodology where IV does play a major role in our cc writing decisions. Alan
Alan,
I am wanting to write a covered call on SLV. But I have a couple of questions.
1. Why are the spreads only .01 cent?
2. Why are there series ending every week of the month?
3. Why are the series of OTM calls separated by only .50 cents $22, $22.50, $23?
So much to learn.
Thanks,
Bill
Hi Bill,
My responses:
1- Highly liquid options tend to have small b-a spreads. Market makers make very little per contract but make up for it with huge volume.
2- Certain securities have weekly options associated with them as opposed to just “monthlys” SLV is one such security. We identify ETFs with weeklys that pass the BCI screens in our Premium ETF Reports.
3- Based on supply and demand and new flexibility that exchanges have certain securities trade in $0.50 increments. SPY is another.
Alan
Alan,
Can you explain what the letters that are to the right of the BID/ASK prices mean on the attached file? I thought the “C” was for “Call Option” but got lost when I saw the Q, A, Z, M, &, T…
Thanks,
Ric
MEMBERS: Click on Ric’s image to enlarge and use the back arrow to return to this blog.
Ric,
It appears that the platform is identifying the options exchange from which the quote is coming. There are several such exchanges. For example:
Q = Nasdaq
A = Amex
Z = Bats
M = Miami
Good question.
Alan
Premium members:
This week’s 6-page report of top-performing ETFs and analysis of ALL Select Sector Components has been uploaded to your premium site. The report also lists Top-performing ETFs with Weekly options.
For your convenience, here is the link to login to the premium site:
https://www.thebluecollarinvestor.com/member/login.php
NOT A PREMIUM MEMBER? Check out this link:
https://www.thebluecollarinvestor.com/membership.shtml
Alan and the BCI team