A covered call trade can be initiated by first purchasing the underlying stock or exchange-traded fund (ETF). It can also be launched by first selling an out-of-the-money (OTM) cash-secured put and allowing exercise if the put strike is in-the-money (ITM) at expiration. This article will highlight a real life trade with LogMein, Inc (LOGM) which began by selling a put option.
Trade overview for LOGM
- 11/21/2016: Sell an OTM $100.00 (lower than current market value of $106.50) cash-secured put
- 12/16/2016: The put strike is now ITM as share price moves down to $99.75 and shares are purchased at the put strike
- 12/19/2016: An ITM covered call is sold
Selling the OTM put
LOGM passed the required BCI screens as an eligible option-selling stock when it was trading at $106.50. The $100.00 OTM put was sold. Here is a screenshot of the BCI Put Calculator:

Put Calculations for LOGM
Note the following:
- Red arrows: The initial (unexercised) return from the put sale was 1.78% for a 4-week return. This annualizes to 26%
- Blue arrow: If exercise occurs, the stock is purchased at a 7.75% discount from current market value
On 12/16/2016 the stock price declined below the $100.00 put strike and no action was taken to avoid assignment. As a result, shares were purchased at the strike price of $100.00 and therefore at a cost basis of $98.25 when accounting for the $1.75 put premium.
Selling the covered call
A defensive in-the-money covered call was selected since the chart pattern was no longer bullish. Here is a screenshot of the Ellman Calculator results from this call sale:

LOGM: Covered Call Calculations
Note the following:
- Red arrow: Shows a 4% initial return on the option-ROO (time value only) for the 5-week contract. Since an ITM strike was sold, there is no additional income generated if share price rises
- Blue arrows: The downside protection is the amount the share can depreciate in value and still retain the initial ROO (4.0%) profit. There are two figures shown in the screenshot. The protection is 3.3% from our cost basis ($98.25) and 4.8% from actual current market value ($99.75)
- The breakeven point is $91.20 ($98.25 – $7.05)
Overview of the series of trades
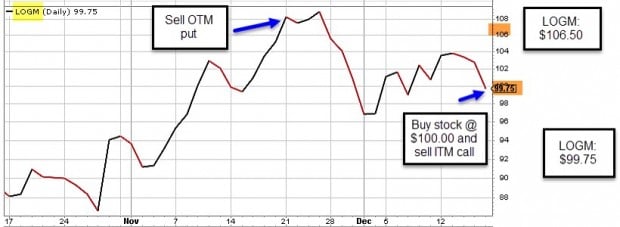
LOGM Chart: Put and Call Trades
One month later
Share price accelerated locking in the 4% initial return:
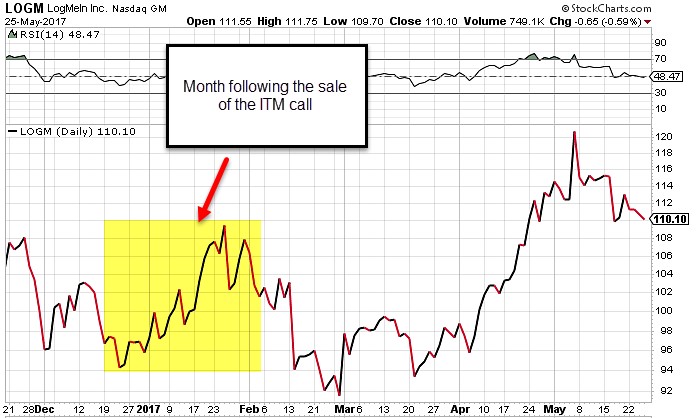
LOGM: Price Movement after the Call Sale
Discussion
The put trade allowed us to by the stock at a 7.75% discount and the call trade put us in a position to generate a cash profit while allowing for additional downside protection. If the price of LOGM remained above the $95.00 call strike (which it did), a 4% 9-week profit will be realized even if the share price had declined by 10.8% (from $106.50 to $95.00).
Blue Chip Report
Premium members: The June edition of the Blue Chip Report naming the best-performing Dow 30 stocks to consider for option-selling has been uploaded to your member site (“resources/downloads” section).
Next live event
American Association of Individual Investors
Washington DC Chapter
Saturday July 15, 2017
9 AM – 12:00 PM
“Using Stock Options to Buy Stocks at a Discount and to Bring Portfolio Returns to Higher Levels”
Co-presenter: Dr. Eric Wish, Finance Professor, University of Maryland
Events recently added (links and info to follow)
1- Money Show Dallas
October 5, 2017
1:15 – 3:15
Two-hour paid event
2- Money Show Orlando
February 8th – 11th, 2018
Market tone
Global stocks rose this week, especially in the US where record highs were recorded. West Texas Intermediate crude fell to $48.95 a barrel from $50.30 a week ago as OPEC extended its output cap for another nine months. Volatility, as measured by the Chicago Board Options Exchange Volatility Index (VIX), slipped to 9.81 from 10.80 last Friday. This week’s reports and international news of importance:
- Gross domestic product expanded at an annual rate of 1.2%, according to the Bureau of Economic Analysis, up from an initial 0.7% reading
- After revisions, consumer spending was a bit stronger than the initial report, though capital expenditures were less robust
- For the first time in nearly three decades, Moody’s has downgraded China’s sovereign credit rating. The rating now stands at A1, with a stable outlook
- Following an attack in Manchester that killed 22 and injured scores more Monday, British prime minister Theresa May put the country on its highest alert level, warning of the potential for an imminent follow-on attack. The general election campaign was suspended, but was expected to resume on May 26th
- Upbeat corporate earnings and positive economic data led to a continued rally in US equities, with both the S&P 500 Index and the Nasdaq Composite Index hitting all-time highs on Thursday
- Officials from the European Union and the United Kingdom are scheduled on June 19th to begin negotiations on the UK’s exit from the European Union
- In the minutes of the May Federal Open Market Committee meeting, the US Federal Reserve began to lay out the methodology it could use to shrink the central bank’s $4.5-trillion balance sheet
- With 477 of the S&P 500 companies having reported for Q1, earnings are expected to increase 15.3% compared with Q1 2016, according to Lipper. Stripping out the energy sector, earnings are expected to rise 11%. Revenue growth is seen up 7.3% versus a year ago, and up 5.4% ex energy
THE WEEK AHEAD
MONDAY, May 29th
- Memorial Day holiday: None scheduled
TUESDAY, MAY 30th
- Personal income April
- Consumer spending April
- Core inflation April
- Case-Shiller U.S home prices March
- Consumer confidence index May
WEDNESDAY, MAY 31st
- Chicago PMI May
- Pending home sales index April
- Beige book
THURSDAY, JUNE 1st
- ADP employment report May
- Weekly jobless claims 5/27
- Markit manufacturing PMI (final) May
- ISM manufacturing index May
- Construction spending April
FRIDAY, JUNE 2nd
- Unemployment rate May
- Average hourly earnings May
- Trade deficit April
For the week, the S&P 500 declined by 0.38% for a year-to-date return of 6.38%.
Summary
IBD: Market in a confirmed uptrend
GMI: 6/6- Buy signal since market close of April 21, 2017
BCI: It is remarkable how resilient the market has been despite the shocking political events taking place almost on a daily basis. I am currently holding an equal number of in-the-money and out-of-the-money strikes.
WHAT THE BROAD MARKET INDICATORS (S&P 500 AND VIX) ARE TELLING US
The 6-month charts point to a moderately bullish outlook. In the past six months, the S&P 500 was up 10% while the VIX (9.81) moved down by 25%.
_____________________________________________________
Wishing you the best in investing,
Alan (alan@thebluecollarinvestor.com) and the BCI team
If any friends here have yet to add selling cash secured puts to their bag of tricks I highly recommend you try it with a portion of your next intended position add.
If you are run away bullish on a stock you are likely better off buying it, letting it get a little upside under it’s belt then starting your call writing campaign.
But if you are on the fence to a bit bearish and don’t want your cash to sit idle for the month look seriously at OTM cash secured puts on something you would like to buy. That last part is the key. You may not own it right away or it may scare you off before expiry but be certain it is something you want at the time of the trade.
Last month I wanted more SPY and QQQ and to start a position in GLD. I sold OTM cash secured puts. The stocks did not drop to my strike so I kept the premiums and am doing it again. The GLD did drop, I got assigned and that was fine. At some point soon after GLD comes back more I will start selling covered calls on it.
Who says metals create no cash flow or income :)? – Jay
Premium Members:
This week’s Weekly Stock Screen and Watch List has been uploaded to The Blue Collar Investor Premium Member site and is available for download in the “Reports” section. Look for the report dated 05/26/17.
For your convenience, here is the link to login to the premium site:
https://www.thebluecollarinvestor.com/member/login.php
Also, be sure to check out the latest BCI Training Videos and “Ask Alan” segments. You can view them at The Blue Collar YouTube Channel. For your convenience, the link to the BCI YouTube Channel is:
http://www.youtube.com/user/BlueCollarInvestor
Best,
Barry and the BCI Team
barry@thebluecollarinvestor.com
Alan
I have a question for you about covered calls. My question is when earnings comes if I own the stock I’m not supposed to sell a covered call and I get why. But am I supposed to sell the stock and buy and back after earnings or just hold it and do nothing. I’m using skechers at the moment.
Thank u,
Mike,
We have 2 choices in this scenario:
1- Sell the stock and re-purchase after the report passes if it still meets our system criteria.
2- Hold the stock through the earnings report without selling the option . After post-report price settles, then sell the option.
In a typical covered call portfolio, we use only stocks not reporting that contract month. Exceptions can be made in instances where a stock has a history of positive surprises. Years ago, I held AAPL and CSCO through earnings reports with a high degree of success.
Personal risk tolerance plays a role as well. Companies can report outstanding sales and earnings but not meet market consensus and take a price hit.
Alan
If you are concerned about earnings you can sell the stock.
You can also sell a deep ITM call which will protect you by the amount of the premium received. This will save you a commission. It all depends on how risk averse you are .
If you are very risk averse, collar your positions (no/low cost), providing you with upside potential and a floor below which you cannot lose.
Hi Alan, I am back again after quite a few weeks, so now I have more time to ask you some more questions if I may.
I’ll start by asking about the Blue-chips, as I feel the market has gone up a lot and might correct soon, when it’s probably a better idea to transfer into these when the need arises:-
1. Firstly for these Blue-chip stocks why is it they don’t under-go the same strict screens as the usual running-list stocks do?- could this be because they are more stable, and less volatile/risky than the running-list, so no need for screens?
2. If I used the Blue-chip stocks then do I still need 5 stocks in 5 different Industries?, if so then is there a website I can go to find out from what Industries the stocks are from?
3. Would you recommend it always best to turn our investing away from the IBD stocks to be in favour of the Blue-chips when there is possible market concerns or a bearish market environment? (this was hoping to be a confirmation to my idea of it at the start?)
4. What about for the other Running-list requirements as there is no Industry rank so shouldn’t I need to see some Industry charts(like I once asked)?, and then there’s the R/R plus Beta values,- should we really need to have research for these figures on each blue-chip stock too?
5. Can I also ask what the most ‘ATM % return’ on a Blue-chip stock I should not go past? (you’ve stated no greater than 6% for the IBD stocks but I was thinking perhaps these others are less?)
I recently had read an article saying that when the market corrects that it is the less established Small-cap stocks that sell-off faster and harder than the Bigger-cap stocks, and that in this instance the Blue-chip stocks were the safest to be in.
So because I find the Running-lists don’t distinguish which are the Small-caps, then I guess my better investing decision in bearish markets is to avoid the whole lists, to be in favour of using Blue-chips/ Etf’s instead.
That was just my thinking on it, and why as you can see I am lately becoming more interested in this larger-cap variety.
Thanks for your help.
Adrian,
The Blue Chip Report was developed in response to some of our members who prefer to work with established, “name-brand” stocks. It represents a list of best-performing Dow-30 stocks. The ETF Reports and Dividend/LEAPS Reports also represent lists that support specific trading styles. Initially, BCI produced one weekly list for our members, today it’s 2 weekly, 1 monthly and 1 quarterly. My responses:
1- Most Dow 30 stocks will not pass our rigorous BCI screens. One reason is that sales and earnings growth will not put them in the “elite” category as many growth companies find themselves. So we have more conservative underlyings that will generate lower returns because of lower volatility.
2- I will consider adding industry name to the list. In the interim, a free site to locate this information is http://www.finviz.com (see screenshot below).
3- I believe in a true bear market this is an appropriate list to use as are the ETF Report and many candidates in our traditional stock reports. ALL lists can be used in all market environments when used appropriately which includes appropriate strike price selection. It really boils down to trading style…I use the stock reports in my portfolios and the ETF reports in my mother’s portfolio.
4- I believe that if we are limiting our universe of candidates to 10 or so stocks, we should base our decisions on performance and diversification. Since these reports come out monthly, we can adjust on a frequent basis.
5- The max ATM return is based on our personal risk tolerance. One range is not appropriate for all. My preference is 2-4% for initial 1-month returns in my accounts and 1-2% in my mother’s portfolio. I will go as high as 6% in bull market environments. This is appropriate for me but not necessarily for others. Once a range is established, it is appropriate for all lists.
Many of our members hold multiple covered call portfolios. Some dedicate specific portfolios to specific BCI lists.
CLICK ON IMAGE TO ENLARGE & USE THE BACK ARROW TO RETURN TO BLOG
Alan
Alan, on your book I read:
“The VIX is a useful indicator for short-term investors, including 1-month covered call writers. Generally speaking, as market volatility increases market pricing will diminish, and vice-versa.”
What do you mean by market pricing and why inverse?
Thanks,
Luis
Phoenix AZ
Luis,
Historically, when the stock market declines, volatility (VIX) rises. This, in part, relates to the “panic” that sets in. In neutral to bull market environments, there is a calming factor that quiets the volatility so there is a general “inverse” relationship between performance of the S&P 500 and the VIX as shown in the screenshot I made this morning below.
CLICK ON IMAGE TO ENLARGE & USE THE BACK ARROW TO RETURN TO BLOG
Alan
Hello Alan,
I watched your webinar videos on Youtube and found them to be highly effective and easy to follow. I recently completed a course on covered calls, and began executing covered calls virtually.
My first play was on AMD for a 11 call at 5/11 expiration. I bought 1000 shares of the stock at 10.34, and sold 10 option contracts at a total of 334.00. When the contract expired, I profited over 500 dollars.
I was told by the instructor on my course forum that this was a bad play and too risky because the premium was too low. He said putting up over 10k to get back only 334.00 was a bad play. His instruction was to find option bid prices that gave at least a 15% return. My problem with this was, I have yet to find a bid price that gives 15% + return in 30 days.
So my question, did I still do alright making a 3%+ return in less than 30 days? Because most of the covered call plays I see are returning less than 5% a month. I have yet to see one returning 15% or more. Is a 15%+ return on a covered call realistic?
Harold,
Thanks for a great post I suspect a few of us will chime in :). Please, as always, listen to Alan the most!
My hunch is your instructor either misunderstood your trade and/or mis-spoke. First he missed your .66 upside between your purchase and your strike. Second There is nothing “risky” about selling an OTM covered call on AMD – or any other stock – if you define risk as the possibility of losing money BECAUSE you you sold the call. Your risk was the purchase of the AMD. You may lose opportunity and you might have made more if you never sold the option. But selling it reduced your risk profile and can not in itself cause a loss.
If your instructor was suggesting there are better ways to make money in the options market than selling covered calls that can be true if you take real option risk and have luck on your side. But that is a strategy debate.
If you ever see a covered call with a 15% return treat it like a downed power line and stay away :)! Even 5% is a warning flag. You did great making 3%+. Congratulations! – Jay
Jay,
As Alan says below, that’s a great analogy.
Compulsive gamblers make the Cassinos rich by betting against the odds.
The market makers know much more than we do, and if they are willing to give you 15% in one month, it means they are 99.99% sure it will not happen.
When they offer 2% ATM, it means there is a 50/50 chance.
Our “edge” is the diversification and the exit strategy.
Roni
Thanks Roni,
Hope all is well with you!
Oh, and Alan, if you want to use that analogy in one of your workshops it is yours free of charge :)!
Hope everyone has a great trading week. – Jay
Harold,
Let me add this to Jay’s terrific response:
We must all first establish our goals before entering a trade. The greater the initial time value return, the greater the implied volatility of the underlying stock and therefore the greater the risk. Your goal of a 3% monthly return is a lot less risky than one of a 15% 1-month return if you could find such a return.
Covered call writing is a low-risk option strategy. Most of us would avoid a 1-month 15% initial time value return like the plague (Jay’s downed power line is a tough analogy to beat!). It may be appropriate for those with a very high personal risk-tolerance. Most growth stocks will fall into the 2-4%/month initial time value returns, blue-chips and ETFs into the 1-2% monthly returns for near-the-money strikes. For most of us, it’s best to start conservatively and look to hit “singles and doubles” and avoid grand slam homeruns until we have a good understanding as to where our goals should reside.
Alan
Hello Alan,
I have been working my way through the Beginners Corner and have a question relating to the method of exiting a put writing strategy when it is going against me by falling below the break-even point.
In Video 7 of Put option selling, slide 3 you discuss “Events leading to Exit Strategy Opportunities in the 1st Half of the Contract
1. Stock price falls below the strike of the put by > 3%
2. Stock price declines dramatically.
3. Stock price rises significantly”
You discuss Events #1 & 3 are they are clear to me but you don’t discuss Event #2. Is there a different way of coping with this situation or is it just a matter of accepting the loss of a dramatic decline? Is there any alternative to buying back an expensive put or should I just accept the assignment? Should I have already set up a protective put on an index to to mitigate against a market crash which might be one way that this type of event occurs?
Perhaps you answer this question somewhere else on your website and could point me to it.
Thank you and regards,
Mike (Australian, living in Sydney)
Mike,
In my put book and DVD program I go into more detail on this topic. When there is a gap-down in price, we check the news to determine the reason for the decline. Based on that assessment, we either allow assignment and then write out-of-the-money calls or buy back the put at a loss and use the cash to secure a different put.
Alan
A few In-The-Money stocks from a quick scan – seems to be more value in some of the OTM options though at the moment.
.
Hi Alan.
I have a question. I came across your posted spreadsheet entitled “Daily Checkup”, and cell I-3 is entitled Stock Decline Alert. I see that the value is hard-entered (at 4%), and I can’t trace that it is used anywhere in the spreadsheet. Can you please comment on the use of this cell? Maybe I am overlooking something obvious.
Thanks!
Michael
Michael,
As you know, we must close the short call position before selling the stock. Some investors also want an alert as to when share value declines by a certain value. Cell I-3 can be adjusted to any value. In the screenshot below, I changed the 4% to 3%. If and when share value declines by the set threshold or lower, stock price will appear in “red” as shown in the screenshot below.
CLICK ON IMAGE TO ENLARGE & USE THE BACK ARROW TO RETURN TO BLOG
Alan
Alan,
Thank you for allowing me to get your newsletter.
I would like to know if you recommend covered calls under $5 or $10. I do not have much capital to buy expensive stocks.
Thank you.
Salomon
Salomon,
In general, stocks trading under $10 per share are not quality stocks that would pass our screens. There are exceptions.
As a guideline, we would need about $10 – $15k to trade with exchange-traded funds and $35 – $50k to trade with individual stocks.
The learning process, however, can start today with or without the necessary capital.
For those looking to build up wealth in anticipation of writing covered calls, indexing is a strategy that should be considered. Here is a link to an article I posted last week on this topic:
https://www.thebluecollarinvestor.com/indexing-a-key-component-to-successful-long-term-investing/
There is also much more detail in my book, “Stock Investing for Students”:
https://www.thebluecollarinvestor.com/stock-investing-for-students/
If capital needs to be built, we can begin the learning process and paper-trade in the interim so that we can hit the ground running when portfolio value is adequate.
Alan
To the topic above that started our blog this week I sent this to an investing friend today and thought it might be relevant. Please forgive the time slippage in prices mentioned:
Do you ever use cash secured puts to enter new positions? I would like to build my QQQ position but at a lower price. I checked the options table since QQQ is down today and puts are up. if I sold the July $137 put I would receive $1.35 for a 1% return on the frozen cash and my basis if assigned would be $135.65. QQQ is at $141.06 as I type this so it would have to go down 4%. But if it did I would not be hurt, I would simply have been paid to wait for a lower price. If it goes up that option will sink fast, I will buy it back and sell another one a little higher. That process for continuous return on cash using a ticker you want to own anyway waiting for lower prices works well unless the market really takes off higher. Then you would have been better off just buying. But one never knows 🙂 – Jay
Premium members:
This week’s 8-page report of top-performing ETFs and analysis of ALL Select Sector Components has been uploaded to your premium site. The report also lists Top-performing ETFs with Weekly options as well as the implied volatility of all eligible candidates. For your convenience, here is the link to login to the premium site:
https://www.thebluecollarinvestor.com/member/login.php
NOT A PREMIUM MEMBER? Check out this link:
https://www.thebluecollarinvestor.com/membership.shtml
Alan and the BCI team
FIZZ: 1-Time special dividend:
Thanks to Geoff for sending this email:
Greetings Gentlemen:
If it’s helpful, I’m just making you aware of a special dividend of $1.50 being paid by FIZZ that went ex-dividend today (06/01). I sold a $95 call yesterday and when I checked my account today it showed the position as -1 $93.50 Jun 16 17 Call. I was kind of confused and wondered if I “fat-fingered” the trade yesterday. I checked the actual trade confirmation which showed that I did sell the $95 strike.
After much searching and not finding any news, I did find a special dividend notice on Seeking Alpha which didn’t appear or I couldn’t find on NASDAQ or anywhere else that I searched.
In any case, in the event you get some confused emails this may shortcut your work.
Thanks for all your great efforts!
Geoff
Check out this article I previously published on this topic:
https://www.thebluecollarinvestor.com/special-1-time-cash-dividends-and-our-covered-call-positions/
Alan
Re FIZZ there appears to be an ER on June 8 as well.
Thank you for the head’s up, Justin. I see that on the Finviz website. I can’t confirm anything with other sites which have information ranging from June 15th to July 21st for the anticipated ER date. I haven’t been able to find any historical data but the chart indicates that the last ER may have been March 8th which would be a good indicator that your information may very well be correct.
Alan,
I am a new to options and cash secured puts are fascinating to me. Your videos have been amazing and I hope to learn more from you. I have purchased your book on .stock investing for students and I hope to read it soon .
One thing i am confused about is closing position mid contracts and buying back puts when it comes to cash secured puts. I was wondering if you could explain that with an example.
Thank you so much.
Rob
Rob,
Welcome to the BCI community.
Here is an example taken from pages 141 – 143 of my book, “Selling Cash-Secured Puts”
Stock price = $51
Sell $50 put for $1.50
Cash to secure put = $4850
Initial return = $150/$4850 = 3.1%
Share price accelerates to $57 in first half of contract
Put value declines to $0.30 (20% of original premium)
Buy back $50 put retaining 80% of original value
Use the now freed up cash to secure another put and generate a 2nd income stream in the same contract month with the same cash
I refer to this as the “20/10% guidelines” for puts.
There are also guidelines to buy back puts when share price declines.
Alan
SINA Special Dividend goes ex-Div on Monday. The new contract will be for 100 shares of SINA and 10 shares of WB deliverable at expiration.
Liquidity may become an issue. Today is the last trading day before the ex-date so evaluate your exposure and risk tolerance for the special dividend and the potential for reduced liquidity.