When covered call writing is combined with protective puts the strategy is known as the collar strategy. The short call places a ceiling on gains and the long put represents a floor protecting losses. The two option positions should result in a net credit. Typically, out-of-the-money calls and puts are selected.
Covered call writing and selling cash-secured puts are low-risk option-selling strategies used to generate monthly cash flow. Low-risk does not mean no risk so how can we measure the degree of risk we are undertaking? Let’s first all agree that any strategy that aspires to generate higher than a risk-free return (Treasuries, for example) will incur some degree of risk. Portfolio managers and institutional investors focus in on market risk like a laser and use Delta in many instances to ascertain and manage market risk (also called systematic risk).
Delta-Neutral Portfolios
These are portfolios consisting of positive and negative Delta positions which balance out to bring the net change to zero. Institutional traders use Delta-neutral positions to eliminate market risk from their positions. For example, if 1000 shares of stock are purchased for a positive Delta of +1000 (1.00 x 1000), the trader may then purchase 20 put contracts (representing 2000 shares) with a Delta of -0.50, thereby creating a Delta-neutral position. If share value declines, put value increases.
Delta and the collar strategy
Using the option Greeks and Delta in particular, we can see how the collar mitigates risk in much the same way portfolio managers attempt to mitigate market risk in their portfolios.
The 3 components of the collar
- Long stock (Delta of +1.00)
- Short call (negative Delta)
- Long put (negative Delta)
Generally, out-of-the-money calls and puts are used.
Strategies overview
Covered call writing (consisting of the first 2) lowers overall Delta and therefore decreases market risk. Adding in the long put further mitigates systemic risk. The disadvantage of the long put component is the cost of the put which will decrease potential returns but enhance portfolio protection.
Real-life example with Microsoft (MSFT) as of 7/21/2017
Here are the stock and option pricing as market opens on 7/21/2017:

MSFT: Option Chain for Collar Strategy
- Stock price: $74.22
- $75.oo call price (bid): $1.54
- $70.00 put price (ask): $0.68
Portfolio Deltas for each strategy (100 shares and 1 contract of each component)
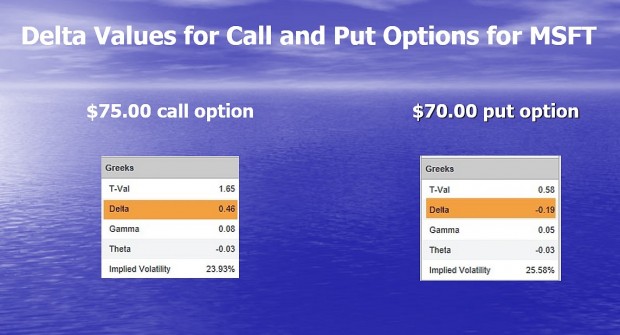
MSFT: Call and Put Deltas
- Stock: +100
- Covered call writing: (+100 -46) = +54
- Collar: (+100 -46 -19) = +35
Maximum gains per 100 shares
- Stock: Unlimited
- Covered call writing: ($154.00 + $78.00) = $232.00 (call premium + share appreciation to strike)
- Collar: ($154.00 + $78.00 – $68.00) = $164.00 (call premium + share appreciation to strike – put premium)
Maximum loss (with no position management, a ridiculous assumption…does not apply to Blue Collar Investors)
- Stock: $7422.00 (if stock price declines to zero)
- Covered call writing: ($7422.00 – 154.00) = $7268.00 (stock price drops to zero)
- Collar: [(7422.00 – $7000.00) + $154.00 – $68.00] = (-) $336.00 (stock price drops below the $70.00 put strike price)
Collar calculator
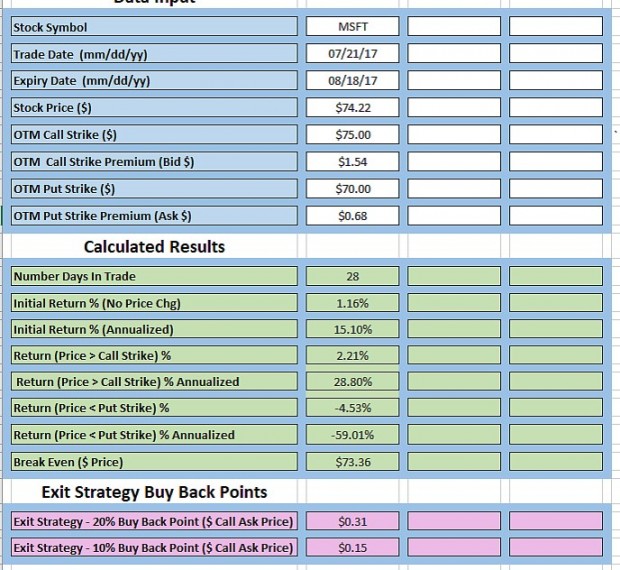
BCI Collar Calculator
After entering option chain information into the white cells, the green cells become populated with the following calculations:
- Initial return: 1.16% (15.10% annualized)
- Maximum return: 2.21% (28.80% annualized)
- Breakeven: $73.36
- Maximum loss: 4.53% (59.01% annualized)
The pink cells reflect the price points to buy back the short calls to initiate our exit strategies.
Discussion
Portfolio managers tend to reduce market risk by seeking Delta-neutral portfolios. By using this analogy, we can visualize the benefits of selling covered call options and buying put options after taking a stock position. A critical skill not discussed in this article is the use of position management techniques which will enhance our gains and mitigate losses.
Upcoming speaking event
Orlando Money Show: February 8th – 11th, 2018
Thursday, Feb 8, 2018
09:00 AM – 09:45 AM
All Stars of Options
“How to Select the Best Options for Covered Call Writing in Bull and Bear Markets”
Friday, Feb 9, 2018
12:15 PM – 03:15 PM
Premium Master Classes (Paid event to Money Show)
“Basics of Options Trading Using Covered-Call Writing with Pro-Active workshop”

Friday, Feb 9, 2018 06:30 PM – 07:00 PM
Stage presentation
“Covered Call Writing with Dow 30 and S&P 500 Stocks”
Market tone
This week’s economic news of importance:
- Markit manufacturing PMI for Dec. 55.1 (expansion)
- ISM manufacturing for Dec. 59.7% (expansion)
- Construction spending for Nov. 0.8% (above expectations)
- ADP Employment for Dec. 250,000 (last 185,000)
- Weekly jobless claims for week ending 12/30/17 250,000 (above expectations)
- Non-farm payrolls 148,000 (below consensus)
- Unemployment rate 4.1% (as expected)
- Trade deficit $50.5 billion (above expectations)
- ISM non-manufacturing for Dec. 55.9% (expansion)
- Factory orders for Nov. 1.3% (above expectations)
THE WEEK AHEAD
Mon Jan 8th
- Consumer credit for Nov.
Tue Jan 9th
- Job openings for Nov.
Wed Jan 10th
- Wholesale inventories
Thu Jan 11th
- Weekly jobless claims for week ending 1/6/18
- Producer price index
- Federal budget for Dec.
Fri Jan 12th
- Consumer price index
- Retail sales
- Business inventories
For the week, the S&P 500 rose by 2.60% for a year-to-date return of 2.60%
Summary
IBD: Market in confirmed uptrend
GMI: 6/6- Buy signal since market close of August 31, 2017
BCI: I have a short-term bullish approach to the market, selling 2 out-of-the-money strikes for every 1 in-the-money strike. A strong global economy, the tax plan’s favorable impact on corporations, the accommodative Fed funds rate, low unemployment and strong corporate profits all factor in to this assessment. Potential political fireworks needs to be monitored but the market has been extraordinarily resilient thus far.
WHAT THE BROAD MARKET INDICATORS (S&P 500 AND VIX) ARE TELLING US
The 6-month charts point to a bullish outlook. In the past six months, the S&P 500 was up 13% while the VIX (9.22) moved down by 17%.
Wishing you much success,
Alan and the BCI team

Alan,
Wouldn’t it be more efficient and safer to sell deep ITM Calls five or six months to expiration (in good underlying, of course) and then rolling them when it is two or three months to expiration to avoid significant time decay? (there are is so much to learn, so much risk in every step).
Looking forward to your reply.
Regards, John
John,
You are 100% spot on that using deep ITM calls is a risk-reduction technique because the intrinsic value of the premium will reduce cost basis and breakeven more than OTM strikes. The downside is that in neutral to bull markets, we lose the opportunity to add the additional income stream, of potential share appreciation up to the OTM strike price.
I prefer to keep my time frames to 1-month (a few exceptions where I may go to 2 months) to avoid earnings reports and allow for more frequent bullish assessments. By going 5-6 months out, we are incurring the risk of 1-2 earnings reports.
The best time to roll options is as close to contract expiration as possible. The reason is that the time value erosion of our options is logarithmic in nature meaning it is faster as expiration approaches so our near-term options will lose time value to a greater extent than the later-month expiration as shown in the screenshot below.
CLICK ON IMAGE TO ENLARGE & USE THE BACK ARROW TO RETURN TO BLOG
Alan
John,
As a loose rule of thumb, an ATM option us related to the square root of the time remaining (seen in an option pricing formula). Time decay speeds up “As Time Goes By’ (Casablanca).
In practical terms, that means that a 9 month option takes 5 months to lose 1/3 of it’s value then another 3 months to lose the next 1/3 of its value and then it loses 1/3 of its value in the last month before expiration (see the graph in Alan’s reply). Because of this decay rate, option writers benefit from writing shorter term options. Option buyers benefit from buying longer term options and if so inclined, rolling before the last month.
” Wouldn’t it be more efficient and safer to sell deep ITM Calls five or six months to expiration and then rolling them when it is two or three months to expiration to avoid significant time decay?”
By selling a deep ITM call so far out, you get more downside protection but very little benefit from the time decay that you seek (not wish to avoid).
A few thoughts on collared long stock.
Equidistant collars tend to provide a net credit. However, there are some circumstances where they do not:
1) The volatility smile for index options and ETFs is unbalanced and that can result in puts costing more than calls leading to an equidistant collar incurring a debit to execute.
2) A pending dividend increases put premium and decreases call premium. This can also increase the debit cost of a collar. This premium shift needs to be incorporated into one’s analysis. For many here, this applies to the decision of whether to do a buy/write or sell a cash secured short put. If the dividend is large enough, the short put position will appear to be far more profitable than the B/W but when you factor in the dividend, it is not.
3) Collared long stock is equivalent to a bullish vertical spread. If you do not already own the stock and you are contemplating doing collared long stock, you will save on B/A slippage and possibly save on commissions if you do the vertical instead.
Spin,
Happy weekend and thank you for your insights. I have had success buying call verticals lately since most stocks have been going up. I buy the underlying call at about .8 delta ITM and sell the overhead call anywhere from 5 to 20 dollars above that depending on the stock price. I use 4 – 6 week out expirations.
I can’t hit any home runs doing that but if I get the direction of a stock correct for the month I can make a nice cash flow in my IRA with little at risk and little money down! I do the same thing buying put verticals but it is a tad harder to pick losers in the current market which is always a nice problem to have 🙂 – Jay
Jay,
Did you enjoy your stress test with the Saints on Sunday?
Do you have any annuity experience from your previous life in the brokerage lane?
Spin
Hey Spin,
I am glad no one took my pulse or blood pressure in the last minute of that damn game!
There is now a scenario, remote I grant you, where the Saints win in Minnesota and the Falcons in Philly and the title game will be here in the Dome! Believe me, this town will be nuts if that happens!
Thank you for your kind recall of what I did long ago at Merrill Lynch! I did not like annuities then and I do not like them now unless a person is fortunate enough to have a lot of discretionary savings they need to bury somewhere.
In my view the average retiree would be far better off holding 70% SPY, 20% TLT and 10% GLD over writing them for a half percent a month and working on their golf game, fishing or teaching a grand child how to throw a baseball :)! – Jay
Buying Protective Puts is a net loser:
https://ssrn.com/abstract=2934538
Stick with Covered Calls!
What does the article in your link have to do with collared long stock, which is the topic at hand?
Also, what is your opinion of vertical spreads?
Jeff, I skimmed a few paragraphs of your abstract. It was obvious from the first paragraph that the author has an agenda and he set out to scientifically prove some bad assumptions with statistical analysis. I’ll just address two of his points.
1) “Unless your option purchases [long puts] and their maturities are timed just right around equity draw downs, they may offer little downside protection.”
It’s common sense protective put cost will be a drag on performance if the underlyings appreciate. ATM SPX protection for one year costs about 5% today. Does that prove the author’s point? Not really. It proves that buying puts in a bull market loses money.
What would have been more honest would have been to break down the performance stats. During the 21 month GFC debacle from mid 2007 to the low in March 2009, the SPX lost 56% whereas the PPUT index lost only 41%. While I wouldn’t brag about losing “only” 41%, it clearly demonstrates that there are times when one might consider hedging.
Framing this in terms of Alan’s article, collaring positions at low/no cost might have been very beneficial to some. IOW, giving up all of the covered call premiums would have provided protection from all of the debacles that cratered share price. For many (most?), they might have done better just selling covered calls. For others, maybe not the case. For example, consider TGT which dropped 25+ pts last year and GWW which dropped nearly 100 pts the previous year (both Dividend Aristocrats). Imagine owning a long put that prevented 80-90% of that loss. Not too shabby for giving up a few points (or less) of covered call premium.
2) “In fact, they [long puts] could make things worse by increasing rather than decreasing drawd owns and volatility per unit of expected return.”
Another poor conclusion by the author. The only way that long puts could make draw downs worse would be an increase in implied volatility and that is very unlikely since if a stock is dropping (fear), IV tends to increase and that benefits the put owner.
As for your statement of “Buying Protective Puts is a net loser so Stick with Covered Calls!”, that’s no better than saying buying long calls is a loser so do calendar spreads instead. Both statements are apples and oranges.
Spin
Premium Members,
This week’s Weekly Stock Screen And Watch List has been uploaded to The Blue Collar Investor Premium Member site and is available for download in the “Reports” section. Look for the report dated 01/05/18.
For your convenience, here is the link to login to the premium site:
https://www.thebluecollarinvestor.com/member/login.php
Also, be sure to check out the latest BCI Training Videos and “Ask Alan” segments. You can view them at The Blue Collar YouTube Channel. For your convenience, the link to the BCI YouTube Channel is:
http://www.youtube.com/user/BlueCollarInvestor
On behalf of Alan, myself, and the entire Blue Collar Investor Team…we wish you a Happy, Healthy, and Prosperous 2018.
Best,
Barry and The BCI Team
barry@thebluecollarinvestor.com
Alan,
Thanks for another informative article. I’m curious if you feel we should be using protective puts and whether you use them in your accounts.
Thank you.
Marsha
Marsha,
There is no one correct answer to your first question. For those who have a low risk-tolerance and if it helps them sleep better at night, then protective puts will serve a valuable function. The downside is that returns will be lower due to the cost of the put.
For most covered call writers who have mastered the skill of position management, protective puts may not be necessary.
I, personally, very rarely use protective puts. When I do, it is usually associated with a scenario when I am travelling and may not have internet access and want to remain in a particular covered call position.
Bottom line: Appropriate for some in my view.
Alan
Alan,
I assume that Collar Calculator is a preview of things to come?
Tom
Tom,
Yes. We will be making available 3 new calculators with the release of our new book, “Covered Call Writing Alternative Strategies” They include:
Collar Calculator
Portfolio Overwriting Calculator
Poor Man’s Covered Call Calculator
We’re hoping to release the book and calculators within the next 2 months.
Alan
No doubt most people are having a good Jan contract so far – WIFI is my worst performer so far (down 0.5%). HIMX was offering some attractive premium on Friday, 2.8% ROO with 3.3% DP, so I did an MCU on WUBA and WB, giving up about 0.5% in each to close the positions and switch the money into HIMX.
I don’t know about other people, but I’ve found that I can often close positions where the share price has galloped at close to IV late on Fridays when there’s two weeks left in a contract.
Hi Justin;
Regarding HIMX, is there a bank fee that you pay because it is an American Depositary Receipt (ADR), issued by a U.S. bank in a foreign stock traded on a U.S. exchange?
Thanks;
Terry
Terry – they slugged me $38.50 for the shares and another $65 to sell the options (profiteering swine!) at IB – no idea if that includes a bank fee, but somebody’s sure profiting from my trade…
Justin,
You don’t mean $38.50 and $65 in commissions on a single covered call? Are you including those in your ROO% calculations?
It looks like you are not sticking to Run List picks from each weeks list and going to higher premium stocks with some other criteria review.
Mario
No Mario – that’s on the whole 83 contracts. Currently I’m running scans on all stocks in the Nasdaq and NYSE greater than $800MM market cap, looking for stocks with good ROO, DP and bullish charts.
Justin
Justin,
$1.25 per contract seems very low to me.
Schwab charges me aprox. $6 to $8.00 per buy/write, and the same again for unwind. ???
Roni
The Market looks like it will be trending up. I’m curious though on strategies for utilizing Inverse ETF’s if the market should crash or correct. Any insight would be appreciated. For example, do you set a limit order or trailing stop?
Jonathan
Hi Jonathan,
My experience with inverse ETF’s is mixed. Intuitively there have to be times when they work because the market can not always go up :)! They can simply be hard to time and frustrating in “normal” markets. If you buy them after a sudden correction, for example, and then the market get’s back on course you will feel whip sawed.
If you have a bearish trigger like adding short positions when the S&P or DOW fall through a key support/moving average line then I suggest you only use the 1X unleveraged variety like tickers SH and DOG. There are lots of 2X and 3X leveraged short ETF’s out there. But in my opinion those are for short term traders taking small positions for specific reasons with clear targets and stops in mind as opposed to a hedge you might hold for a period of time knowing your timing is not likely to be exact.
I don’t use hard or trailing stop orders live in the system unless I am going to be away from the market for a period of time. The computers can “see” the stop orders and will run the market down to get them if there are enough at a given price point. – Jay
Inverse ETFs provide a nice gain if the market is collapsing. Leveraged inverse ETFs provide an even better return. But they have compounding issues in a non trending market which you should be aware of.
Suppose an index ETF called ABC is $100 and it drops 10% on Day 1 and rises 11.1 % on Day 2. ABC has an inverse ETF called XYZ which is also $100,
ABC = $100
$ 90 on Day 1 after 10% drop
$100 on Day 2 after 11.1% rise
XYZ = $100
$110 on Day 1 after ABC drops 10%
$ 97.79 on Day 2 after ABC rises 11.1%
So even though index ABC dropped and recovered its loss, XYZ ended up losing $12.21
There are a number of other permutations for up and down, some better, some worse. An inverse ETF (XYZ) will have performance drag in a sideways market. For leveraged ETF (2X, 3X), this drag will be magnified and will be worse.
Management of inverse ETFs is no different than for equities. You determine your profit targets and risk loss amounts and you
employ a stop loss to execute at those prices. If so inclined, you can incorporate options to enhance that but that is another level or complexity.
Spin
Jonathan,
Let me add a few comments to Jay’s excellent response:
The inverse ETFs are outstanding choices for a limited market environment. For example, if we purchased inverse ETFs in 2008 and sold out-of-the-money calls on those securities, we could have generated outstanding returns during disastrous market conditions. However, 2008 was an aberration (thank goodness for that) and so the use of inverse ETFs should be considered carefully. Generally, our wealth will be built on the basis of an accelerating market.
In our covered call positions, we must close the short call first, so the stop loss will be with the 20/10% guidelines in the BCI methodology. If the short call is closed, we can then decide what are next step will be regarding the underlying.
Alan
Alan…
I have a question of “in sync timing” with your
weekly reports:
It seems to me that the only weekly report
to be acted on is the last report of the current
month to place the CC trade on the next month.
The Front Month.
If you get inside the Front Month then you are
losing Time value. With ERs being critical there
seems to be no report info for the next month
ERs. Or should I seek out this info myself.
Am I looking at this wrong ?? IF this is a nuisance
question I apologize.
Thank You
Dave
Dave,
The report that will have the most influence on our portfolios is the one that is published the weekend after expiration Friday. The reason we provide reports every week for our members is that if we close a position due to significant price change in either direction, we will need replacement stocks and ETFs. By doing weekly reports, our members can select using the most up-to-date information.
Projected ER dates are provided for each stock on the list. Check the 5th column from the right. We also place the stocks in the report based on contract expiration month separated by solid or broken black lines. For example, in the latest report you will note that CPRT through ADBE have option expirations during the March contracts.
Alan
Alan,
Just a quick question. I’ve read and re-read the section in the BCI Encyclopedia on Playing the Bid/Ask Spread, but I’m not sure of how to actually implement it on my Scottrade platform. Would playing the spread be classified as a Limit Order?
Whenever I put in Market order all I get is the published bid price on the Sell to Open.
Any ideas?
Thanks,
Bert
Bert,
When leveraging the “Show or Fill Rule” always use a limit order. This means that you are instructing your broker to execute the trade only at that price or better. When we use a market order, we will receive the best available price.
Keep up the good work.
Alan
Bert – As Alan says, always a limit order. you might get burned otherwise.
I remember when I started out here I misread a Bid / Ask (Bid was 0!) and I got a fill with a sell price essentially pennies and the month was just starting (sad face – wait for weeks for a $0.01 premium!). So I called Options house and they said somebody took advantage of me and was told he was going to see what he can do something — the next day I got an adjustment on bid price so I would a $1 bid price so I got $100 out of it…. Always make the call to your broker… They may throw in some free trades as well for being a good customer.
In general, I start with a bid to my advantage and then play the spread up till it fills – if you do not need an instant fill. It It does not fill in 15 seconds, I generally go to my next higher bid increment. Since I do 4 account in parallel, I set them all up, place the orders, then play with one till it fills, then go to the other 3 and set the new limit to get a fill…done.
Mario
Bert,
Another thing, when I do a Buy Covered call Combination Form order (Buy-Write), I get a Debit Limit Min – Max horizontal line in both Fidelity (Active Trader Pro) and Etrade (was Optionshouse) Covered Call combination order form. You should be trading the Debit Limit (Stock price – Premium), not the Bid / Ask. Is this what you get on Scott Platform? (This is also equal to your Breakeven point.)
Mario
Alan,
I noticed watching expirations that TIME VALUE does not go to ZERO but can often be a 1/2 percent even on a highly traded stock/option. This means I should allow an option to expire especially in my TAX DEFERRED account. (I have been doing BCI trading strategy for 2 months now.)
In my taxable account, since it is unlikely that any trade would be a long term due to BCI strategy, it is still beneficial to allow these options to get called too.
Am I correct with regard to my two statements above?
When you are sell OTM option in the current bull market, do you have a rule of thumb on the minimum OPTION PREMIUM you will sell at – example 1/2 percent?
2-4% rule clarification – is this the option premium range that you look for for an ATM strike? Or is 2-4% the amount of total money – premium plus stock appreciation that you try to achieve on any given trade? Can you give me an example of options sold in the current market so I get a better idea of how you setup in this bull market?
Carl
Carl – Good set of questions. I have been with BCI for 20 months now… the first few months were crazy, tenseful, … particular since my first month was Earnings Rport month! Read many books for 4 months including the Classic Encyclopedia in detail.
***
“TIME VALUE does not go to ZERO” “should allow an option to expire” –
Taxable or not taxable account – That why you do the rolling out calculations (What Now Tab, Pg 131 Classic, manually page 290+,402+ , Alan mentions that many covered call writers head for the hill at loosing the BTC premium – you need to do the numbers) to an ITM or OTM strike so you can see your potential gain. Even a 1.5% rollout gain is 18% per year. You have spent a lot of your valuable time on this pick and why not let it run with a simple roll out (no earning report next month). You might even roll out a second month later, dramatically increasing your ROO% . Even if the stock is not on the current run list, the rule it to keep it if you can roll it out ITM or if the stock is near its OTM price or go for iTM if that is the stock trajectory. If the stock if below your. If the stock is below your strike , let it expire and cover the stock on Monday if it it is still a good pick.
***
“do you have a rule of thumb on the minimum OPTION PREMIUM you will sell at – example 1/2 percent?”
A 1/2% on 10,000 is $50 from your option. from 20,000 is $100.00 Not worth it. Your BEP margin is lower. If the stock flattens out you are stuck with 1/2% instead of a happier 1.5% or 2% initial premium. Must just as well speculate and stay long. That is essentially what your doing when you accept a small premium. It took me a long time to realize that. All these option niceties are not self-evident. ..Then the stock reaches your strike that limits any further gain.
***
2-4% rule clarification – I try to go for 2+% in week 1 or 2 whether I am going with an ITM or OTM strike but I am happy with 1.8% and look for the stock appreciation benefit. You can get % even when not an ATM strike. As I have state here before, I calculate my Breakeven (BEP0, look at the price chart and see how volatile the stock is and my margin to the BEP.
Good luck…
Mario
Carl,
Options will not have 1/2 a pct of time value at expiration. It’s gone by then. The B/A spread may be very wide but that is meaningless unless one is foolish enough to trade at those prices.
If you want to transact, determine the time value in real time. If OTM, it’s zero. If ITM, it’s zero. Either way, offer a few cents more if you are trying to BTC the call or roll the option. Place combo orders since MM-s are more likely to fill them than single orders. For example, if you’re trying to roll a covered call out a month, use a calendar spread combo order. If you are trying to roll the call up and out (or down and out), use a diagonal spread order. If you know your acceptable price for execution, the combo order ensures that (if you want a $1 credit, it doesn’t matter if it’s $1.10 – $0.10 or if it’s $1.05 – $0.05).
If the call is nicely ITM at expiration, do nothing and let assignment occur, making the maximum amount from the position.
Hi Bert,
To me the most immediate benefit from always using limit orders is the ability to set my price and offset commission costs versus market orders which I can’t recall the last time I used.
Example: some of us here have used PYPL in recent months. At the close there was 10 cents difference between the bid and ask. If I wanted 100 shares at market that would have filled but so would have the limit order at Mid 5 cents below that or even 4 cents below market to be “generous” to the market maker. That is $5 or $4 on a 100 lot and I pay $3.95 for a trade of any size so my use of a limit order “saved” a commission versus a market order.
The leverage on that grows with larger orders or options orders. You may not get filled right away. But you will if you give them a penny above mid unless the stock is moving fast and the machines “know” they are taking it higher
I like to enter at bid or below and will play cat and mouse with the computers for hours as I go the gym, run an errand or do something else. It’s part of my hobby :). More times than not I get the price I want. – Jay
Alan,
Regarding this weeks blog on Collar Strategy, I noticed you stated “Position Delta” with:
Stock: +100
Covered call writing: (+100 -46) = +54
Collar: (+100 -46 -19) = +35
From a hedging perspective, at the current price of the underlying, for a 1 volt change in the underlying, the Covered call will gain or lose $0.54 while the Collar with gain or lose $0.35 per share.
In real hedging portfolios, the are trying to get the position delta to Zero and then rely on the Initial Premium from the trade as your profit to realize.
Is that my correct interpretation of Hedging goals. Hedging comes with a price (commissions) so we are settling for less hedging and taking advantage of Share appreciation while using Exit strategies to mitigate the down side.
I gather there is a limit to hedging if the hedging side turns sour since you hear about Hedgers going out of business. May be you can clarify the reasons?
Mario
Mario,
In this example, selling the CC reduces the stock’s 100 delta to 54. That means that in this moment in time (execution date), upside gain and downside loss will be diminished. Because the delta of the short call drops as share price drops, as the stock drops, delta accelerates and therefore losses will accelerates. Because of this, covered calls and short puts are higher risk option strategies. This is due to the finite premium received from the short call versus a stock which though very unlikely, can drop 100% of its value. If the stock dropped to $70 immediately, the delta would jump to approx 85. At $65 delta would be near 100 since the call would be near worthless and you’ll lose $ for $ on the way down. There’s no ‘loss limiter’ and the losses can really accrue (higher risk).
The long put of the collar is a built in ‘loss limiter’. The position is hedged. For that reason, it’s a low risk strategy (it’s equivalent to a vertical spread).
I wouldn’t get carried away with analysis of delta for a covered call or collared long stock. It’s just a statistical number that tells you the approximate non linear rate at which you will make or lose money per point of underlying movement. It does not quantify total risk.
Delta hedging is more sophisticated than these basic option strategies. You have to have an ultra low commission rate to play this game and you need some cooperation from the underlying to succeed with it. I’ll leave it at that since the devil is in the details.
Spin
Mario,
As Spin implied, Delta hedging is mainly for professionals as they adjust their positions when Delta changes which is all the time. The Delta position of a portfolio is based on stats at that point in time and professional portfolio managers will adjust frequently to achieve their targeted Delta portfolios.
For retail investors like us, the takeaway is that our risk is mitigated by selling calls and buying puts and Delta is used as the parameter to quantify the degree of risk. The numbers presented are “entry” Deltas. Very few of us should dip our toes in the world of Delta hedging. However, it is instructive to understand that by selling call options, we are lowering our cost basis and increasing the chances of successful trades. When we buy protective puts, we are lowering the returns as we pay for these “insurance policies” One size does not fit all. Protective puts are okay if it helps one sleep better at night and who are willing to accept lower returns. Our position management arsenal is critical and required whether protective puts are in place or not.
The screenshot of the BCI Collar Calculator (available soon) depicts initial returns, breakeven, maximum returns and maximum loss. These are the stats most retail investors will focus in on as we compare collar trades to other possible investments.
Alan
Mario,
Here’s a simple example of delta neutral hedging with a lot of number fudging to make the calculations easy.
Suppose XYZ is $100 and you buy two of the 1 month out XYZ $100 puts trading @ $2.50 each with a delta of -50 ea. You are delta neutral (+100 + 2 * -50). This position is synthetically equal to a long straddle and at expiration, it will make money above $105 or below $95. You have an outlay of $500 of put premium to make up. IF XYZ expires at $100, you’re out $500.
Now suppose XYX drops immediately to $98. The delta of the put will rise to -60 and since long two of them, net delta is -20 (+100 + 2 * -60). So you buy 20 shares at $98 to even delta out (+120 + 2* -60). XYZ now drops immediately to $96 and with a delta of -72.5 per put, you buy 25 shares to be delta neutral (+145 + 2 * -72.5).
Your 100 shares is down $400. The 20 shares is down $40 and the 25 shares is flat. Net loss is -$440.
The put is worth $4.70 so your two long puts have a gain of $440 (2 * $4.70 – 2 * 2.50)
What have you achieved? Other than remaining delta neutral, nothing (zero gain or loss).
Now suppose that magically, XYZ now rises immediately back to $100 with no time decay or change in implied volatility. The options are back to $2.50 so there is no gain or loss on the opening trade. However, the 20 shares @ $98 is up $40 and the 25 shares @ $96 is up $100. You sell them, book a $140 gain and you are back to your original delta neutral position and you have whittled the $500 at risk down to $360.
This is a cooperative stock. You want lots of volatility back and forth, presenting you with many opportunities to do this. However, the above numbers are theoretical values. B/A spreads on each transaction and commissions will drop the return as will time decay. If the underlying trades in a box and goes nowhere, you’ll watch your premium erode day by day. Slow death by decay :->)
I hope this makes some sense (and I hope I got my arithmetic right in the calculations).
Spin
Alan and Spindr –
Thanks to you both for your comments on hedging and delta adjustments.
It is good this subject has been brought up. I wanted clarification as it applies to our cc trading and at the same time see the deeper implications of real time hedging for a particular underlying price.
Mario
Alan,
Inline with my previous post, another way is to look at the Position Delta for particular price points of the position
:
Covered Call:
Current price: Position Delta 1 + (-.46 Naked short call delta) = +.54
Price above OTM Strike: Position Delta 1 + (-1 naked call delta) = 0
Price deep OTM: Position Delta 1 + (-0 Naked Call limited loss delta) = 1
There is not protection at the lower end for a covered call.
.*****
Collar:
Current Price; Position Delta (+1 -.46 -.19) = +.35
Price above OTM Strike of call : 1 + (-1 naked call delta) + 0 (Long put) = 0
Price below lower strike of collar: 1 +(-0 Naked call) + (-1 long put) = 0
So the collar allows for share appreciation (for a lower reward) while you are protected with Position Deltas of 0 to limit your losses and limiting your gains.
When I initially stated with options, all this was gibberish and there were other things to worry about. Options are an amazing concept with complexities. Now at least I seem to be grasping some understanding of this.
Mario
Alan have you ever hit a double using the Spdr ETFs? Are there less chances of increasing returns with exit strategies with these funds?
William,
What a great question. I have, in fact, hit doubles with Spdr ETFs (my Mom’s account) but these are few and far between. Also, keep in mind that I have been using these strategies since the mid 1990s as the main strategy in the stock portion of my portfolios. Over those many years, I have hit a few doubles with Spdr ETFs. I have hit many more in my accounts with the stocks selected from our stock reports. The reason has to do with the implied volatility of the underlyings. Spdr ETFs are baskets of blue chip stocks, some going up, some going down. Overall a lower implied volatility, in general, than individual stocks (there are exceptions). Since Spdr prices whipsaw less, there is less opportunity to implement the 20/10% guidelines to setup a possible scenario where we can “hit a double” In return, we are receiving a decent return for a top-performing segment of the S&P 500. When appropriate, we can use out-of-the-money strikes to add an additional potential income stream of share appreciation up to the strike price.
There are pros and cons to the Spdr ETFs and we should choose based on return goals and personal risk tolerance.
Alan
Alan / Barry –
TEAM ER is on 1/18 but you did not flag it on your 1/5/18 Run list as having an ER problem. I verified it with EarningsWhispers.com I was just about to Buy a Covered call for 1 week. Has good ROO, price chart, but has ER problem.
Same problem with SCHW.
LRCX ER is 1/24/18. Run list says 1/24/17.
Strange no one has caught this….
Regards,
Mario
Mario,
Thanks for the heads up.
Some comments…
TEAM:
The press release for TEAM’s ER date just came out on Monday, 1/8/18, after the publication date of the 01/05/18 Weekly Report.
SCHW:
Called Schwab Investor Relations Dept…they told me that the ER Date has NOT been announced yet. They also said that they usually announce the date a day or two prior to the actual announcement.
LRCX:
Thanks for noticing the typo…will fix tonight.
Mario, as you know, ER Dates are difficult to nail down. We do our best, but until the company announces the date, ER Dates are moving targets. You did exactly the right thing…you checked the ER date prior to placing your trade…per Alan’s teachings.
As above with TEAM and SCHW…these are moving targets.
Best,
Barry
Hi Alan,
Wonderful article on Collar. Loved every bit of your column. I am a frequent visitor to your website and referred my friends to your website.
Thank you for your excellent work for the covered call community.
One variation I do often in collar(I do collars on high IV) is:
I buy put 10 days or a week less than short call expiration time(For ex. I sell 40 days out short call and buy 30 days out long put), thus acheiving same risk reward, but better delta(just providing better directional bias).
Just a comment wanted to share.
Happy Friday.
Thanks
Sankar.
Sankar,
Thanks very much for sharing your ideas. Feel free to share with our BCI community one or more trades you made with this process and your approach to trade management when the collar becomes a covered call.
Alan
Hi Alan,
Love to share. Thanks for the response
Let’s say my trade is:
Buy ABC @$100
Sell 40 days out Short call 102 Strike
Buy 30 days out Long put(instead of 40 days out long put)
This is what I do with the trade when the collar becomes covered call(that is after 30 days):
Case 1:
if profitable and met my expectations of 2 or 3% return after 30 days, i will close the entire trade.
Case 2: Rolling day(30 days after the initial trade, that’s when long put expires)
if I chose to continue with the trade, I will roll the trade
Do another
sell 40 days out short call
and buy long put 30 days out at appropriate strikes
and
continue the trade management process…
VERY profitable and provides better risk than covered call.
I take this type of COLLAR trade on high IV stocks like MU, NVDA.
Sankar,
I understand the logic of your strategy and would be curious about:
1. The impact of limiting underlyings to stocks with Weeklys?
2. How deep out-of-the-money do you go with long puts? Do you use a net option credit percentile return?
3. Any management if share price drops, but not below the put strike?
4. Negative impact on bottom line when buying back short calls with 10 days of time value still remaining?
Thanks again for sharing.
Alan
Hello Sankar,
I don’t follow the logic of your trade. Selling a put that expires 10 days earlier than the call does not change net delta much. It reduces the cost of the collar which provides a better R/R for a big move before near term expiration (upside directional bias) but it’s the opposite and offers a poorer R/R if the underlying is between the two strikes at near term expiration.
What do you do at day 30 when the put expires? Do you close the position or do you go uncovered to the downside for the next 10 days?
Spin
Hi Spin,
Yes. I roll the trade after 30 days when the long put expires.
Basically, sell another short call 40 days out from the rolling day and buy another long put 30 days out from the rolling day.
By this, I don’t pay too much for long put thus getting better returns than doing same-expiration short call and long put.
Sankar.
Trades for today and Fidelity Trade Count: 1/12/18:
Today I was able to MCU Gap Up Unwind TRU (Transunion) at 0.1% loss. Strike 55. Set Credit Limit order on 4 accounts to Strike – 0.1% of 55 or 55 – .06 = 54.94. This is equivalent to the Stock price – Premium for an ITM trade. Waited a few days but it finally filled.
Then looked for a stock I could trade for 1 week to Expiration Friday 1/19.
Using 1/5/18 run list entered in FinViz.com portfolio, found CTRL at 31.16 and bought covered calls Strike 30 at 1.1% to 1.3% ROO% ITM with Downside protection of 4.5% and BEP of 29.7. The 1.3% occurred because the stock price declined nearer to the strike as I played the spread.
One trade was 900 shares with net commission for combination order of 11.21. Commission loss was then 11.21 / 900 or .012 which amount to less than 0.04% loss ([.012 / 30]x100) from commissions.
.************
Fidelity Trade Count and Commissions Paid
Got some good information from Fidelity. You can check online the number of trades, commissions paid, and price improvement you have done in the last 12 rolling months, Month to date, and Year to date,
In the Balances tab for an account, there is a link called : Commissions & Price Improvement Summary which will results in a popup window with the information nicely listed.
In one account, I am averaging 12 trades per month. This is about right since I try to diversity into 5 or more stock positions. A combination trade is considered 1 trade. Total commissions for last 12 months was $1100.15 or $91.68 per month. With 12 trades per month average trade then costs $7.64, which looks right since I pay $4.95 base commission.
With my Etrade (formerly Optionshouse), the per trade cost is higher around $ 10.00 because they charge the Base Commission ($4.95) for each leg of a combination order (Not charged for Rolling trades)).
Mario